
 Login Sign Up


| |||||
 |  | ||||

| 12Stocks.com Market Intelligence |
Best Latin America Stocks
|
|
| Quick Read: Top Latin America Stocks By Performances & Trends: Daily, Weekly, Year-to-Date, Market Cap (Size) & Technical Trends | |||
| Best Latin America Views: Quick Browse View, Summary & Slide Show | |||
| 12Stocks.com Latin America Stocks Performances & Trends Daily | |||||||||
|
|  The overall market intelligence score is 18 (0-bearish to 100-bullish) which puts Latin America index in short term bearish trend. The market intelligence score from previous trading session is 32 and hence a deterioration of trend.
| ||||||||
| Here are the market intelligence trend scores of the most requested Latin America stocks at 12Stocks.com (click stock name for detailed review): | |
| Scroll down this page for most comprehensive review of Latin America stocks by performance, trends, technical analysis, charts, fund plays & more | |


| 12Stocks.com: Top Performing Latin America Index Stocks | ||||||||||||||||||||||||||||||||||||||||||||||||
 The top performing Latin America Index stocks year to date are
Now, more recently, over last week, the top performing Latin America Index stocks on the move are


|
||||||||||||||||||||||||||||||||||||||||||||||||
| 12Stocks.com: Investing in Latin America Index with Stocks | |
|
The following table helps investors and traders sort through current performance and trends (as measured by market intelligence score) of various
stocks in the Latin America Index. Quick View: Move mouse or cursor over stock symbol (ticker) to view short-term technical chart and over stock name to view long term chart. Click on  to add stock symbol to your watchlist and to add stock symbol to your watchlist and  to view watchlist. Click on any ticker or stock name for detailed market intelligence report for that stock. to view watchlist. Click on any ticker or stock name for detailed market intelligence report for that stock. |
12Stocks.com Performance of Stocks in Latin America Index
| Ticker | Stock Name | Watchlist | Category | Recent Price | Market Intelligence Score | Change % | YTD Change% |
| ERJ | Embraer S.A |   | Industrials | 25.00 | 68 | 2.21 | 35.50% |
| ASR | Grupo Aeroportuario | | Transports | 347.71 | 93 | 2.21 | 18.16% |
| PAC | Grupo Aeroportuario | | Transports | 179.97 | 100 | 2.17 | 2.71% |
| FNV | Franco-Nevada | | Materials | 121.56 | 43 | 2.14 | 9.70% |
| LOMA | Loma Negra | | Industrials | 7.17 | 73 | 2.14 | 1.13% |
| TFPM | Triple Flag | | Materials | 16.20 | 95 | 2.08 | 22.36% |
| AG | First Majestic | | Materials | 6.94 | 68 | 2.06 | 12.85% |
| GROY | Gold Royalty | | Materials | 2.04 | 75 | 2.00 | 41.18% |
| KGC | Kinross Gold | | Materials | 6.73 | 63 | 1.97 | 11.24% |
| AEM | Agnico Eagle | | Materials | 64.94 | 88 | 1.96 | 18.40% |
| IE | Ivanhoe Electric | | Materials | 9.55 | 36 | 1.92 | -5.77% |
| PAAS | Pan American | | Materials | 18.97 | 78 | 1.88 | 16.17% |
| NU | Nu | | Financials | 10.87 | 56 | 1.87 | 30.34% |
| WRN | Western Copper | | Materials | 1.46 | 44 | 1.75 | 9.40% |
| NG | NovaGold Resources | | Materials | 2.90 | 51 | 1.75 | -22.46% |
| NOA | North American | | Energy | 21.79 | 24 | 1.73 | 4.51% |
| AMBI | Ambipar Emergency | | Industrials | 4.19 | 17 | 1.70 | -46.69% |
| VET | Vermilion Energy | | Energy | 12.03 | 54 | 1.69 | -0.25% |
| CPG | Crescent Point | | Energy | 9.00 | 81 | 1.69 | 29.87% |
| ENB | Enbridge | | Energy | 36.26 | 87 | 1.68 | 0.67% |
| CNI | Canadian National | | Transports | 124.78 | 13 | 1.56 | -0.68% |
| XENE | Xenon | | Health Care | 40.10 | 0 | 1.52 | -12.94% |
| GGAL | Grupo Financiero | | Financials | 29.49 | 58 | 1.44 | 70.81% |
| PBR | Petroleo Brasileiro | | Energy | 17.05 | 69 | 1.43 | 6.76% |
| DESP | Despegar.com | | Services & Goods | 12.77 | 90 | 1.43 | 34.99% |
| To view more stocks, click on Next / Previous arrows or select different range: 0 - 25 , 25 - 50 , 50 - 75 , 75 - 100 , 100 - 125 , 125 - 150 , 150 - 175 , 175 - 200 , 200 - 225 | ||
 | Click To Change The Sort Order: By Market Cap or Company Size Performance: Year-to-date, Week and Day |  |
| Detailed Overview Of Latin America Stocks |
| Latin America Technical Overview, Leaders & Laggards, Top Latin America ETF Funds & Detailed Latin America Stocks List, Charts, Trends & More |
| Latin America: Technical Analysis, Trends & YTD Performance | |
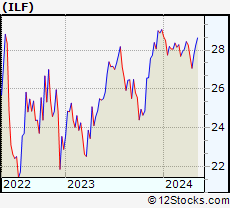
 ILF Weekly Chart |
|
| Long Term Trend: Not Good | |
| Medium Term Trend: Not Good | |
 ILF Daily Chart |
|
| Short Term Trend: Deteriorating | |
| Overall Trend Score: 18 | |
| YTD Performance: -6.23% | |
| **Trend Scores & Views Are Only For Educational Purposes And Not For Investing | |
| 12Stocks.com: Investing in Latin America Index using Exchange Traded Funds | |
|
The following table shows list of key exchange traded funds (ETF) that
help investors play Latin America stock market. For detailed view, check out our ETF Funds section of our website. Quick View: Move mouse or cursor over ETF symbol (ticker) to view short-term technical chart and over ETF name to view long term chart. Click on ticker or stock name for detailed view. Click on to add stock symbol to your watchlist and to view watchlist. |
12Stocks.com List of ETFs that track Latin America Index
| Ticker | ETF Name | Watchlist | Recent Price | Market Intelligence Score | Change % | Week % | Year-to-date % |
| ILF | Latin America 40 | | 27.25 | 18 | -0.22 | 0.66 | -6.23% |
| EWC | Canada | | 37.50 | 61 | 0.37 | 1.05 | 2.24% |
| FLN | Latin America AlphaDEX | | 19.37 | 31 | -0.51 | 0.78 | -6.83% |
| EWZ | Brazil | | 30.81 | 35 | -0.58 | 0.23 | -11.87% |
| EWW | Mexico | | 65.80 | 18 | 0.05 | 1.4 | -3.02% |
| ARGT | Argentina | | 54.62 | 71 | 0.18 | 2.15 | 6.39% |
| EWZS | Brazil Small-Cap | | 13.06 | 32 | -0.87 | 0.42 | -13.31% |
| BRF | Brazil Small-Cap | | 14.88 | 25 | -0.93 | 0.13 | -15.4% |
| BZQ | Short Brazil | | 12.63 | 63 | 0.84 | -0.8 | 25.92% |
| BRZU | Brazil Bull 3X | | 77.07 | 27 | -1.41 | 0.35 | -25.09% |
| FBZ | Brazil AlphaDEX | | 11.17 | 10 | -0.71 | -0.62 | -8.61% |
| 12Stocks.com: Charts, Trends, Fundamental Data and Performances of Latin America Stocks | |
|
We now take in-depth look at all Latin America stocks including charts, multi-period performances and overall trends (as measured by market intelligence score). One can sort Latin America stocks (click link to choose) by Daily, Weekly and by Year-to-Date performances. Also, one can sort by size of the company or by market capitalization. |
| Select Your Default Chart Type: | |||||
| |||||
| Click on stock symbol or name for detailed view. Click on to add stock symbol to your watchlist and to view watchlist. Quick View: Move mouse or cursor over "Daily" to quickly view daily technical stock chart and over "Weekly" to view weekly technical stock chart. | |||||

 | ERJ Embraer S.A. |
| Sector: Industrials | |
| SubSector: Aerospace/Defense Products & Services | |
| MarketCap: 1623.71 Millions | |
| Recent Price: 25.00 Market Intelligence Score: 68 | |
| Day Percent Change: 2.21% Day Change: 0.54 | |
| Week Change: 5.09% Year-to-date Change: 35.5% | |
| ERJ Links: Profile News Message Board | |
| Charts:- Daily , Weekly | |
| Add ERJ to Watchlist: View: Get Complete ERJ Trend Analysis ➞ | |
 | ASR Grupo Aeroportuario del Sureste, S. A. B. de C. V. |
| Sector: Transports | |
| SubSector: Air Services, Other | |
| MarketCap: 2739.98 Millions | |
| Recent Price: 347.71 Market Intelligence Score: 93 | |
| Day Percent Change: 2.21% Day Change: 7.52 | |
| Week Change: 12.82% Year-to-date Change: 18.2% | |
| ASR Links: Profile News Message Board | |
| Charts:- Daily , Weekly | |
| Add ASR to Watchlist: View: Get Complete ASR Trend Analysis ➞ | |
 | PAC Grupo Aeroportuario del Pacifico, S.A.B. de C.V. |
| Sector: Transports | |
| SubSector: Air Services, Other | |
| MarketCap: 3204.18 Millions | |
| Recent Price: 179.97 Market Intelligence Score: 100 | |
| Day Percent Change: 2.17% Day Change: 3.82 | |
| Week Change: 15.25% Year-to-date Change: 2.7% | |
| PAC Links: Profile News Message Board | |
| Charts:- Daily , Weekly | |
| Add PAC to Watchlist: View: Get Complete PAC Trend Analysis ➞ | |
 | FNV Franco-Nevada Corporation |
| Sector: Materials | |
| SubSector: Gold | |
| MarketCap: 17703.9 Millions | |
| Recent Price: 121.56 Market Intelligence Score: 43 | |
| Day Percent Change: 2.14% Day Change: 2.55 | |
| Week Change: 0.07% Year-to-date Change: 9.7% | |
| FNV Links: Profile News Message Board | |
| Charts:- Daily , Weekly | |
| Add FNV to Watchlist: View: Get Complete FNV Trend Analysis ➞ | |
 | LOMA Loma Negra Compania Industrial Argentina Sociedad Anonima |
| Sector: Industrials | |
| SubSector: General Building Materials | |
| MarketCap: 408.853 Millions | |
| Recent Price: 7.17 Market Intelligence Score: 73 | |
| Day Percent Change: 2.14% Day Change: 0.15 | |
| Week Change: 3.91% Year-to-date Change: 1.1% | |
| LOMA Links: Profile News Message Board | |
| Charts:- Daily , Weekly | |
| Add LOMA to Watchlist: View: Get Complete LOMA Trend Analysis ➞ | |
 | TFPM Triple Flag Precious Metals Corp. |
| Sector: Materials | |
| SubSector: Other Precious Metals & Mining | |
| MarketCap: 3640 Millions | |
| Recent Price: 16.20 Market Intelligence Score: 95 | |
| Day Percent Change: 2.08% Day Change: 0.33 | |
| Week Change: 3.98% Year-to-date Change: 22.4% | |
| TFPM Links: Profile News Message Board | |
| Charts:- Daily , Weekly | |
| Add TFPM to Watchlist: View: Get Complete TFPM Trend Analysis ➞ | |
 | AG First Majestic Silver Corp. |
| Sector: Materials | |
| SubSector: Silver | |
| MarketCap: 1128.56 Millions | |
| Recent Price: 6.94 Market Intelligence Score: 68 | |
| Day Percent Change: 2.06% Day Change: 0.14 | |
| Week Change: 3.12% Year-to-date Change: 12.9% | |
| AG Links: Profile News Message Board | |
| Charts:- Daily , Weekly | |
| Add AG to Watchlist: View: Get Complete AG Trend Analysis ➞ | |
 | GROY Gold Royalty Corp. |
| Sector: Materials | |
| SubSector: Other Precious Metals & Mining | |
| MarketCap: 254 Millions | |
| Recent Price: 2.04 Market Intelligence Score: 75 | |
| Day Percent Change: 2.00% Day Change: 0.04 | |
| Week Change: 4.62% Year-to-date Change: 41.2% | |
| GROY Links: Profile News Message Board | |
| Charts:- Daily , Weekly | |
| Add GROY to Watchlist: View: Get Complete GROY Trend Analysis ➞ | |
 | KGC Kinross Gold Corporation |
| Sector: Materials | |
| SubSector: Gold | |
| MarketCap: 5389.29 Millions | |
| Recent Price: 6.73 Market Intelligence Score: 63 | |
| Day Percent Change: 1.97% Day Change: 0.13 | |
| Week Change: -0.59% Year-to-date Change: 11.2% | |
| KGC Links: Profile News Message Board | |
| Charts:- Daily , Weekly | |
| Add KGC to Watchlist: View: Get Complete KGC Trend Analysis ➞ | |
 | AEM Agnico Eagle Mines Limited |
| Sector: Materials | |
| SubSector: Gold | |
| MarketCap: 9491.49 Millions | |
| Recent Price: 64.94 Market Intelligence Score: 88 | |
| Day Percent Change: 1.96% Day Change: 1.25 | |
| Week Change: 1.72% Year-to-date Change: 18.4% | |
| AEM Links: Profile News Message Board | |
| Charts:- Daily , Weekly | |
| Add AEM to Watchlist: View: Get Complete AEM Trend Analysis ➞ | |
 | IE Ivanhoe Electric Inc. |
| Sector: Materials | |
| SubSector: Copper | |
| MarketCap: 1200 Millions | |
| Recent Price: 9.55 Market Intelligence Score: 36 | |
| Day Percent Change: 1.92% Day Change: 0.18 | |
| Week Change: -9.91% Year-to-date Change: -5.8% | |
| IE Links: Profile News Message Board | |
| Charts:- Daily , Weekly | |
| Add IE to Watchlist: View: Get Complete IE Trend Analysis ➞ | |
 | PAAS Pan American Silver Corp. |
| Sector: Materials | |
| SubSector: Silver | |
| MarketCap: 2832.56 Millions | |
| Recent Price: 18.97 Market Intelligence Score: 78 | |
| Day Percent Change: 1.88% Day Change: 0.35 | |
| Week Change: -0.52% Year-to-date Change: 16.2% | |
| PAAS Links: Profile News Message Board | |
| Charts:- Daily , Weekly | |
| Add PAAS to Watchlist: View: Get Complete PAAS Trend Analysis ➞ | |
 | NU Nu Holdings Ltd. |
| Sector: Financials | |
| SubSector: Banks - Diversified | |
| MarketCap: 37240 Millions | |
| Recent Price: 10.87 Market Intelligence Score: 56 | |
| Day Percent Change: 1.87% Day Change: 0.20 | |
| Week Change: 3.72% Year-to-date Change: 30.3% | |
| NU Links: Profile News Message Board | |
| Charts:- Daily , Weekly | |
| Add NU to Watchlist: View: Get Complete NU Trend Analysis ➞ | |
 | WRN Western Copper and Gold Corporation |
| Sector: Materials | |
| SubSector: Industrial Metals & Minerals | |
| MarketCap: 38.191 Millions | |
| Recent Price: 1.46 Market Intelligence Score: 44 | |
| Day Percent Change: 1.75% Day Change: 0.03 | |
| Week Change: 1.04% Year-to-date Change: 9.4% | |
| WRN Links: Profile News Message Board | |
| Charts:- Daily , Weekly | |
| Add WRN to Watchlist: View: Get Complete WRN Trend Analysis ➞ | |
 | NG NovaGold Resources Inc. |
| Sector: Materials | |
| SubSector: Gold | |
| MarketCap: 2499.49 Millions | |
| Recent Price: 2.90 Market Intelligence Score: 51 | |
| Day Percent Change: 1.75% Day Change: 0.05 | |
| Week Change: -6.45% Year-to-date Change: -22.5% | |
| NG Links: Profile News Message Board | |
| Charts:- Daily , Weekly | |
| Add NG to Watchlist: View: Get Complete NG Trend Analysis ➞ | |
 | NOA North American Construction Group Ltd. |
| Sector: Energy | |
| SubSector: Oil & Gas Equipment & Services | |
| MarketCap: 160.461 Millions | |
| Recent Price: 21.79 Market Intelligence Score: 24 | |
| Day Percent Change: 1.73% Day Change: 0.37 | |
| Week Change: 6.09% Year-to-date Change: 4.5% | |
| NOA Links: Profile News Message Board | |
| Charts:- Daily , Weekly | |
| Add NOA to Watchlist: View: Get Complete NOA Trend Analysis ➞ | |
 | AMBI Ambipar Emergency Response |
| Sector: Industrials | |
| SubSector: Waste Management | |
| MarketCap: 462 Millions | |
| Recent Price: 4.19 Market Intelligence Score: 17 | |
| Day Percent Change: 1.70% Day Change: 0.07 | |
| Week Change: -14.14% Year-to-date Change: -46.7% | |
| AMBI Links: Profile News Message Board | |
| Charts:- Daily , Weekly | |
| Add AMBI to Watchlist: View: Get Complete AMBI Trend Analysis ➞ | |
 | VET Vermilion Energy Inc. |
| Sector: Energy | |
| SubSector: Oil & Gas Drilling & Exploration | |
| MarketCap: 335.839 Millions | |
| Recent Price: 12.03 Market Intelligence Score: 54 | |
| Day Percent Change: 1.69% Day Change: 0.20 | |
| Week Change: 1.43% Year-to-date Change: -0.3% | |
| VET Links: Profile News Message Board | |
| Charts:- Daily , Weekly | |
| Add VET to Watchlist: View: Get Complete VET Trend Analysis ➞ | |
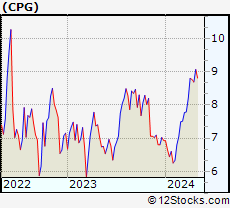 | CPG Crescent Point Energy Corp. |
| Sector: Energy | |
| SubSector: Independent Oil & Gas | |
| MarketCap: 381.593 Millions | |
| Recent Price: 9.00 Market Intelligence Score: 81 | |
| Day Percent Change: 1.69% Day Change: 0.15 | |
| Week Change: 3.57% Year-to-date Change: 29.9% | |
| CPG Links: Profile News Message Board | |
| Charts:- Daily , Weekly | |
| Add CPG to Watchlist: View: Get Complete CPG Trend Analysis ➞ | |
 | ENB Enbridge Inc. |
| Sector: Energy | |
| SubSector: Oil & Gas Pipelines | |
| MarketCap: 62578.4 Millions | |
| Recent Price: 36.26 Market Intelligence Score: 87 | |
| Day Percent Change: 1.68% Day Change: 0.60 | |
| Week Change: 4.02% Year-to-date Change: 0.7% | |
| ENB Links: Profile News Message Board | |
| Charts:- Daily , Weekly | |
| Add ENB to Watchlist: View: Get Complete ENB Trend Analysis ➞ | |
 | CNI Canadian National Railway Company |
| Sector: Transports | |
| SubSector: Railroads | |
| MarketCap: 54114.1 Millions | |
| Recent Price: 124.78 Market Intelligence Score: 13 | |
| Day Percent Change: 1.56% Day Change: 1.92 | |
| Week Change: -2.25% Year-to-date Change: -0.7% | |
| CNI Links: Profile News Message Board | |
| Charts:- Daily , Weekly | |
| Add CNI to Watchlist: View: Get Complete CNI Trend Analysis ➞ | |
 | XENE Xenon Pharmaceuticals Inc. |
| Sector: Health Care | |
| SubSector: Biotechnology | |
| MarketCap: 388.585 Millions | |
| Recent Price: 40.10 Market Intelligence Score: 0 | |
| Day Percent Change: 1.52% Day Change: 0.60 | |
| Week Change: 0.55% Year-to-date Change: -12.9% | |
| XENE Links: Profile News Message Board | |
| Charts:- Daily , Weekly | |
| Add XENE to Watchlist: View: Get Complete XENE Trend Analysis ➞ | |
 | GGAL Grupo Financiero Galicia S.A. |
| Sector: Financials | |
| SubSector: Foreign Regional Banks | |
| MarketCap: 1274.69 Millions | |
| Recent Price: 29.49 Market Intelligence Score: 58 | |
| Day Percent Change: 1.44% Day Change: 0.42 | |
| Week Change: 3.62% Year-to-date Change: 70.8% | |
| GGAL Links: Profile News Message Board | |
| Charts:- Daily , Weekly | |
| Add GGAL to Watchlist: View: Get Complete GGAL Trend Analysis ➞ | |
 | PBR Petroleo Brasileiro S.A. - Petrobras |
| Sector: Energy | |
| SubSector: Oil & Gas Drilling & Exploration | |
| MarketCap: 38939.2 Millions | |
| Recent Price: 17.05 Market Intelligence Score: 69 | |
| Day Percent Change: 1.43% Day Change: 0.24 | |
| Week Change: 3.52% Year-to-date Change: 6.8% | |
| PBR Links: Profile News Message Board | |
| Charts:- Daily , Weekly | |
| Add PBR to Watchlist: View: Get Complete PBR Trend Analysis ➞ | |
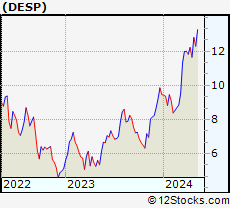 | DESP Despegar.com, Corp. |
| Sector: Services & Goods | |
| SubSector: Lodging | |
| MarketCap: 547.536 Millions | |
| Recent Price: 12.77 Market Intelligence Score: 90 | |
| Day Percent Change: 1.43% Day Change: 0.18 | |
| Week Change: 9.61% Year-to-date Change: 35.0% | |
| DESP Links: Profile News Message Board | |
| Charts:- Daily , Weekly | |
| Add DESP to Watchlist: View: Get Complete DESP Trend Analysis ➞ | |
| To view more stocks, click on Next / Previous arrows or select different range: 0 - 25 , 25 - 50 , 50 - 75 , 75 - 100 , 100 - 125 , 125 - 150 , 150 - 175 , 175 - 200 , 200 - 225 | ||
| Click To Change The Sort Order: By Market Cap or Company Size Performance: Year-to-date, Week and Day | |
| Select Chart Type: | ||
 Best Stocks Today 12Stocks.com |
© 2024 12Stocks.com Terms & Conditions Privacy Contact Us
All Information Provided Only For Education And Not To Be Used For Investing or Trading. See Terms & Conditions


One More Thing ... Get Best Stocks Delivered Daily!
Never Ever Miss A Move With Our Top Ten Stocks Lists
Find Best Stocks In Any Market - Bull or Bear Market
Take A Peek At Our Top Ten Stocks Lists: Daily, Weekly, Year-to-Date & Top Trends
Find Best Stocks In Any Market - Bull or Bear Market
Take A Peek At Our Top Ten Stocks Lists: Daily, Weekly, Year-to-Date & Top Trends
Latin America Stocks With Best Up Trends [0-bearish to 100-bullish]: SilverCrest Metals[100], Grupo Aeroportuario[100], Mercer [100], Descartes Systems[100], Hudbay Minerals[95], Triple Flag[95], Grupo Aeroportuario[93], SunOpta [93], Despegar.com [90], Controladora Vuela[88], BRF S.A[88]
Best Latin America Stocks Year-to-Date:
Aurora Cannabis[1311.17%], Fusion [123.13%], Banco Macro[71.01%], Grupo Financiero[70.81%], Canopy Growth[70.06%], D-Wave Quantum[68.68%], McEwen Mining[65.6%], Banco BBVA[64.71%], Celestica [47.71%], Hudbay Minerals[47.1%], IAMGOLD [46.64%] Best Latin America Stocks This Week:
Grupo Aeroportuario[15.25%], Grupo Aeroportuario[13.53%], Grupo Aeroportuario[12.82%], Controladora Vuela[12.56%], SunOpta [9.9%], Despegar.com [9.61%], Canopy Growth[9.45%], Afya [8.75%], Central Puerto[7.78%], SilverCrest Metals[7.72%], Trilogy Metals[7.58%] Best Latin America Stocks Daily:
McEwen Mining[9.34%], Teck Resources[9.02%], New Gold[5.23%], Grupo Aeroportuario[5.18%], Hudbay Minerals[4.91%], Afya [4.69%], Trilogy Metals[4.56%], SilverCrest Metals[4.42%], Endeavour Silver[3.33%], Coca-Cola FEMSA[3.22%], TransAlta [3.17%]