
 Login Sign Up


| |||||
 |  | ||||

| 12Stocks.com Market Intelligence |
Best Latin America Stocks
|
|
| Quick Read: Top Latin America Stocks By Performances & Trends: Daily, Weekly, Year-to-Date, Market Cap (Size) & Technical Trends | |||
| Best Latin America Views: Quick Browse View, Summary & Slide Show | |||
| 12Stocks.com Latin America Stocks Performances & Trends Daily | |||||||||
|
|  The overall market intelligence score is 0 (0-bearish to 100-bullish) which puts Latin America index in short term bearish trend. The market intelligence score from previous trading session is 13 and a deterioration of trend continues.
| ||||||||
| Here are the market intelligence trend scores of the most requested Latin America stocks at 12Stocks.com (click stock name for detailed review): | |
| Scroll down this page for most comprehensive review of Latin America stocks by performance, trends, technical analysis, charts, fund plays & more | |


| 12Stocks.com: Top Performing Latin America Index Stocks | ||||||||||||||||||||||||||||||||||||||||||||||||
 The top performing Latin America Index stocks year to date are
Now, more recently, over last week, the top performing Latin America Index stocks on the move are


|
||||||||||||||||||||||||||||||||||||||||||||||||
| 12Stocks.com: Investing in Latin America Index with Stocks | |
|
The following table helps investors and traders sort through current performance and trends (as measured by market intelligence score) of various
stocks in the Latin America Index. Quick View: Move mouse or cursor over stock symbol (ticker) to view short-term technical chart and over stock name to view long term chart. Click on  to add stock symbol to your watchlist and to add stock symbol to your watchlist and  to view watchlist. Click on any ticker or stock name for detailed market intelligence report for that stock. to view watchlist. Click on any ticker or stock name for detailed market intelligence report for that stock. |
12Stocks.com Performance of Stocks in Latin America Index
| Ticker | Stock Name | Watchlist | Category | Recent Price | Market Intelligence Score | Change % | YTD Change% |
| TD | Toronto-Dominion Bank |   | Financials | 56.09 | 0 | -0.85 | -13.20% |
| WPM | Wheaton Precious | | Materials | 50.78 | 76 | -0.86 | 2.92% |
| CNI | Canadian National | | Transports | 127.67 | 31 | -0.87 | 1.62% |
| BIOX | Bioceres Crop | | Industrials | 12.39 | 10 | -0.88 | -9.76% |
| CX | CEMEX S.A.B. | | Industrials | 8.32 | 13 | -0.89 | 7.42% |
| BHC | Bausch Health | | Health Care | 8.55 | 26 | -0.93 | 6.61% |
| SUPV | Grupo Supervielle | | Financials | 5.30 | 31 | -0.93 | 30.54% |
| PBA | Pembina Pipeline | | Energy | 34.17 | 5 | -0.93 | -0.73% |
| ANY | Sphere 3D | | Technology | 1.05 | 0 | -0.94 | -68.37% |
| NG | NovaGold Resources | | Materials | 3.11 | 61 | -0.96 | -16.84% |
| RCI | Rogers | | Technology | 37.53 | 0 | -1.00 | -19.82% |
| FTS | Fortis | | Utilities | 37.16 | 0 | -1.01 | -9.65% |
| AEZS | Aeterna Zentaris | | Health Care | 1.95 | 36 | -1.02 | 4.84% |
| BAM | Brookfield Asset | | Financials | 38.13 | 0 | -1.06 | -5.08% |
| BMA | Banco Macro | | Financials | 46.94 | 39 | -1.10 | 63.55% |
| ASM | Avino Silver | | Materials | 0.74 | 56 | -1.11 | 41.20% |
| BTG | B2Gold | | Materials | 2.68 | 18 | -1.11 | -15.19% |
| TU | TELUS | | Technology | 15.57 | 0 | -1.17 | -12.51% |
| TRP | TC Energy | | Energy | 35.58 | 10 | -1.18 | -8.99% |
| SUZ | Suzano S.A | | Consumer Staples | 11.62 | 26 | -1.19 | 2.29% |
| AQN | Algonquin Power | | Utilities | 5.75 | 10 | -1.20 | -9.02% |
| UGP | Ultrapar Participacoes | | Energy | 5.14 | 0 | -1.25 | -5.07% |
| CIGI | Colliers | | Financials | 108.52 | 0 | -1.27 | -14.23% |
| VIV | Telefonica Brasil | | Technology | 9.29 | 0 | -1.28 | -15.08% |
| LOMA | Loma Negra | | Industrials | 6.88 | 25 | -1.29 | -2.96% |
| To view more stocks, click on Next / Previous arrows or select different range: 0 - 25 , 25 - 50 , 50 - 75 , 75 - 100 , 100 - 125 , 125 - 150 , 150 - 175 , 175 - 200 | ||
 | Click To Change The Sort Order: By Market Cap or Company Size Performance: Year-to-date, Week and Day |  |
| Detailed Overview Of Latin America Stocks |
| Latin America Technical Overview, Leaders & Laggards, Top Latin America ETF Funds & Detailed Latin America Stocks List, Charts, Trends & More |
| Latin America: Technical Analysis, Trends & YTD Performance | |
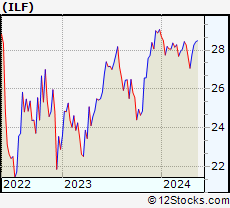
 ILF Weekly Chart |
|
| Long Term Trend: Not Good | |
| Medium Term Trend: Not Good | |
 ILF Daily Chart |
|
| Short Term Trend: Not Good | |
| Overall Trend Score: 0 | |
| YTD Performance: -8.31% | |
| **Trend Scores & Views Are Only For Educational Purposes And Not For Investing | |
| 12Stocks.com: Investing in Latin America Index using Exchange Traded Funds | |
|
The following table shows list of key exchange traded funds (ETF) that
help investors play Latin America stock market. For detailed view, check out our ETF Funds section of our website. Quick View: Move mouse or cursor over ETF symbol (ticker) to view short-term technical chart and over ETF name to view long term chart. Click on ticker or stock name for detailed view. Click on to add stock symbol to your watchlist and to view watchlist. |
12Stocks.com List of ETFs that track Latin America Index
| Ticker | ETF Name | Watchlist | Recent Price | Market Intelligence Score | Change % | Week % | Year-to-date % |
| ILF | Latin America 40 | | 26.65 | 0 | -2.18 | -3.63 | -8.31% |
| EWC | Canada | | 36.58 | 13 | -0.81 | -1.53 | -0.27% |
| FLN | Latin America AlphaDEX | | 19.57 | 76 | -4.07 | -4.07 | -5.87% |
| EWZ | Brazil | | 30.11 | 0 | -2.29 | -3.73 | -13.89% |
| EWW | Mexico | | 64.89 | 0 | -2.48 | -3.75 | -4.36% |
| ARGT | Argentina | | 52.71 | 46 | -4.01 | -5.25 | 2.67% |
| EWZS | Brazil Small-Cap | | 12.94 | 7 | -2.04 | -4.47 | -14.08% |
| BRF | Brazil Small-Cap | | 14.57 | 0 | -3.51 | -6.39 | -17.16% |
| BZQ | Short Brazil | | 13.35 | 100 | 5.08 | 8.41 | 33.05% |
| BRZU | Brazil Bull 3X | | 73.42 | 0 | -5.09 | -7.96 | -28.64% |
| FBZ | Brazil AlphaDEX | | 11.44 | 61 | -3.46 | -3.46 | -6.4% |
| 12Stocks.com: Charts, Trends, Fundamental Data and Performances of Latin America Stocks | |
|
We now take in-depth look at all Latin America stocks including charts, multi-period performances and overall trends (as measured by market intelligence score). One can sort Latin America stocks (click link to choose) by Daily, Weekly and by Year-to-Date performances. Also, one can sort by size of the company or by market capitalization. |
| Select Your Default Chart Type: | |||||
| |||||
| Click on stock symbol or name for detailed view. Click on to add stock symbol to your watchlist and to view watchlist. Quick View: Move mouse or cursor over "Daily" to quickly view daily technical stock chart and over "Weekly" to view weekly technical stock chart. | |||||

 | TD The Toronto-Dominion Bank |
| Sector: Financials | |
| SubSector: Money Center Banks | |
| MarketCap: 75152.4 Millions | |
| Recent Price: 56.09 Market Intelligence Score: 0 | |
| Day Percent Change: -0.85% Day Change: -0.48 | |
| Week Change: -1.3% Year-to-date Change: -13.2% | |
| TD Links: Profile News Message Board | |
| Charts:- Daily , Weekly | |
| Add TD to Watchlist: View: Get Complete TD Trend Analysis ➞ | |
 | WPM Wheaton Precious Metals Corp. |
| Sector: Materials | |
| SubSector: Silver | |
| MarketCap: 11349.6 Millions | |
| Recent Price: 50.78 Market Intelligence Score: 76 | |
| Day Percent Change: -0.86% Day Change: -0.44 | |
| Week Change: -1.97% Year-to-date Change: 2.9% | |
| WPM Links: Profile News Message Board | |
| Charts:- Daily , Weekly | |
| Add WPM to Watchlist: View: Get Complete WPM Trend Analysis ➞ | |
 | CNI Canadian National Railway Company |
| Sector: Transports | |
| SubSector: Railroads | |
| MarketCap: 54114.1 Millions | |
| Recent Price: 127.67 Market Intelligence Score: 31 | |
| Day Percent Change: -0.87% Day Change: -1.12 | |
| Week Change: -0.61% Year-to-date Change: 1.6% | |
| CNI Links: Profile News Message Board | |
| Charts:- Daily , Weekly | |
| Add CNI to Watchlist: View: Get Complete CNI Trend Analysis ➞ | |
 | BIOX Bioceres Crop Solutions Corp. |
| Sector: Industrials | |
| SubSector: Conglomerates | |
| MarketCap: 198.348 Millions | |
| Recent Price: 12.39 Market Intelligence Score: 10 | |
| Day Percent Change: -0.88% Day Change: -0.11 | |
| Week Change: -0.88% Year-to-date Change: -9.8% | |
| BIOX Links: Profile News Message Board | |
| Charts:- Daily , Weekly | |
| Add BIOX to Watchlist: View: Get Complete BIOX Trend Analysis ➞ | |
 | CX CEMEX, S.A.B. de C.V. |
| Sector: Industrials | |
| SubSector: Cement | |
| MarketCap: 2948.23 Millions | |
| Recent Price: 8.32 Market Intelligence Score: 13 | |
| Day Percent Change: -0.89% Day Change: -0.08 | |
| Week Change: -2.75% Year-to-date Change: 7.4% | |
| CX Links: Profile News Message Board | |
| Charts:- Daily , Weekly | |
| Add CX to Watchlist: View: Get Complete CX Trend Analysis ➞ | |
 | BHC Bausch Health Companies Inc. |
| Sector: Health Care | |
| SubSector: Drug Delivery | |
| MarketCap: 5485.3 Millions | |
| Recent Price: 8.55 Market Intelligence Score: 26 | |
| Day Percent Change: -0.93% Day Change: -0.08 | |
| Week Change: -2.4% Year-to-date Change: 6.6% | |
| BHC Links: Profile News Message Board | |
| Charts:- Daily , Weekly | |
| Add BHC to Watchlist: View: Get Complete BHC Trend Analysis ➞ | |
 | SUPV Grupo Supervielle S.A. |
| Sector: Financials | |
| SubSector: Foreign Regional Banks | |
| MarketCap: 224.779 Millions | |
| Recent Price: 5.30 Market Intelligence Score: 31 | |
| Day Percent Change: -0.93% Day Change: -0.05 | |
| Week Change: -9.09% Year-to-date Change: 30.5% | |
| SUPV Links: Profile News Message Board | |
| Charts:- Daily , Weekly | |
| Add SUPV to Watchlist: View: Get Complete SUPV Trend Analysis ➞ | |
 | PBA Pembina Pipeline Corporation |
| Sector: Energy | |
| SubSector: Oil & Gas Pipelines | |
| MarketCap: 8813.35 Millions | |
| Recent Price: 34.17 Market Intelligence Score: 5 | |
| Day Percent Change: -0.93% Day Change: -0.32 | |
| Week Change: -2.65% Year-to-date Change: -0.7% | |
| PBA Links: Profile News Message Board | |
| Charts:- Daily , Weekly | |
| Add PBA to Watchlist: View: Get Complete PBA Trend Analysis ➞ | |
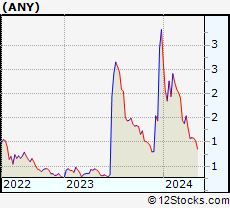 | ANY Sphere 3D Corp. |
| Sector: Technology | |
| SubSector: Application Software | |
| MarketCap: 2.57662 Millions | |
| Recent Price: 1.05 Market Intelligence Score: 0 | |
| Day Percent Change: -0.94% Day Change: -0.01 | |
| Week Change: -2.78% Year-to-date Change: -68.4% | |
| ANY Links: Profile News Message Board | |
| Charts:- Daily , Weekly | |
| Add ANY to Watchlist: View: Get Complete ANY Trend Analysis ➞ | |
 | NG NovaGold Resources Inc. |
| Sector: Materials | |
| SubSector: Gold | |
| MarketCap: 2499.49 Millions | |
| Recent Price: 3.11 Market Intelligence Score: 61 | |
| Day Percent Change: -0.96% Day Change: -0.03 | |
| Week Change: -1.27% Year-to-date Change: -16.8% | |
| NG Links: Profile News Message Board | |
| Charts:- Daily , Weekly | |
| Add NG to Watchlist: View: Get Complete NG Trend Analysis ➞ | |
 | RCI Rogers Communications Inc. |
| Sector: Technology | |
| SubSector: Wireless Communications | |
| MarketCap: 22111.6 Millions | |
| Recent Price: 37.53 Market Intelligence Score: 0 | |
| Day Percent Change: -1.00% Day Change: -0.38 | |
| Week Change: -4.19% Year-to-date Change: -19.8% | |
| RCI Links: Profile News Message Board | |
| Charts:- Daily , Weekly | |
| Add RCI to Watchlist: View: Get Complete RCI Trend Analysis ➞ | |
 | FTS Fortis Inc. |
| Sector: Utilities | |
| SubSector: Electric Utilities | |
| MarketCap: 14741.8 Millions | |
| Recent Price: 37.16 Market Intelligence Score: 0 | |
| Day Percent Change: -1.01% Day Change: -0.38 | |
| Week Change: -1.22% Year-to-date Change: -9.7% | |
| FTS Links: Profile News Message Board | |
| Charts:- Daily , Weekly | |
| Add FTS to Watchlist: View: Get Complete FTS Trend Analysis ➞ | |
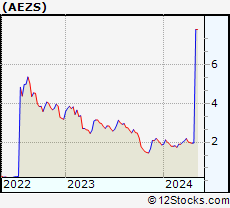 | AEZS Aeterna Zentaris Inc. |
| Sector: Health Care | |
| SubSector: Biotechnology | |
| MarketCap: 13.6785 Millions | |
| Recent Price: 1.95 Market Intelligence Score: 36 | |
| Day Percent Change: -1.02% Day Change: -0.02 | |
| Week Change: -1.27% Year-to-date Change: 4.8% | |
| AEZS Links: Profile News Message Board | |
| Charts:- Daily , Weekly | |
| Add AEZS to Watchlist: View: Get Complete AEZS Trend Analysis ➞ | |
 | BAM Brookfield Asset Management Inc. |
| Sector: Financials | |
| SubSector: Real Estate Development | |
| MarketCap: 47134.9 Millions | |
| Recent Price: 38.13 Market Intelligence Score: 0 | |
| Day Percent Change: -1.06% Day Change: -0.41 | |
| Week Change: -3.17% Year-to-date Change: -5.1% | |
| BAM Links: Profile News Message Board | |
| Charts:- Daily , Weekly | |
| Add BAM to Watchlist: View: Get Complete BAM Trend Analysis ➞ | |
 | BMA Banco Macro S.A. |
| Sector: Financials | |
| SubSector: Foreign Regional Banks | |
| MarketCap: 1769.99 Millions | |
| Recent Price: 46.94 Market Intelligence Score: 39 | |
| Day Percent Change: -1.10% Day Change: -0.52 | |
| Week Change: -8.78% Year-to-date Change: 63.6% | |
| BMA Links: Profile News Message Board | |
| Charts:- Daily , Weekly | |
| Add BMA to Watchlist: View: Get Complete BMA Trend Analysis ➞ | |
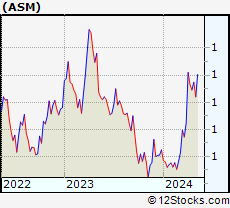 | ASM Avino Silver & Gold Mines Ltd. |
| Sector: Materials | |
| SubSector: Silver | |
| MarketCap: 29.7456 Millions | |
| Recent Price: 0.74 Market Intelligence Score: 56 | |
| Day Percent Change: -1.11% Day Change: -0.01 | |
| Week Change: -3.32% Year-to-date Change: 41.2% | |
| ASM Links: Profile News Message Board | |
| Charts:- Daily , Weekly | |
| Add ASM to Watchlist: View: Get Complete ASM Trend Analysis ➞ | |
 | BTG B2Gold Corp. |
| Sector: Materials | |
| SubSector: Gold | |
| MarketCap: 2792.39 Millions | |
| Recent Price: 2.68 Market Intelligence Score: 18 | |
| Day Percent Change: -1.11% Day Change: -0.03 | |
| Week Change: -7.27% Year-to-date Change: -15.2% | |
| BTG Links: Profile News Message Board | |
| Charts:- Daily , Weekly | |
| Add BTG to Watchlist: View: Get Complete BTG Trend Analysis ➞ | |
 | TU TELUS Corporation |
| Sector: Technology | |
| SubSector: Wireless Communications | |
| MarketCap: 10864.7 Millions | |
| Recent Price: 15.57 Market Intelligence Score: 0 | |
| Day Percent Change: -1.17% Day Change: -0.19 | |
| Week Change: -1.8% Year-to-date Change: -12.5% | |
| TU Links: Profile News Message Board | |
| Charts:- Daily , Weekly | |
| Add TU to Watchlist: View: Get Complete TU Trend Analysis ➞ | |
 | TRP TC Energy Corporation |
| Sector: Energy | |
| SubSector: Oil & Gas Pipelines | |
| MarketCap: 44071.1 Millions | |
| Recent Price: 35.58 Market Intelligence Score: 10 | |
| Day Percent Change: -1.18% Day Change: -0.42 | |
| Week Change: -1.48% Year-to-date Change: -9.0% | |
| TRP Links: Profile News Message Board | |
| Charts:- Daily , Weekly | |
| Add TRP to Watchlist: View: Get Complete TRP Trend Analysis ➞ | |
 | SUZ Suzano S.A. |
| Sector: Consumer Staples | |
| SubSector: Paper & Paper Products | |
| MarketCap: 7042.93 Millions | |
| Recent Price: 11.62 Market Intelligence Score: 26 | |
| Day Percent Change: -1.19% Day Change: -0.14 | |
| Week Change: -2.35% Year-to-date Change: 2.3% | |
| SUZ Links: Profile News Message Board | |
| Charts:- Daily , Weekly | |
| Add SUZ to Watchlist: View: Get Complete SUZ Trend Analysis ➞ | |
 | AQN Algonquin Power & Utilities Corp. |
| Sector: Utilities | |
| SubSector: Diversified Utilities | |
| MarketCap: 5916.4 Millions | |
| Recent Price: 5.75 Market Intelligence Score: 10 | |
| Day Percent Change: -1.20% Day Change: -0.07 | |
| Week Change: -3.04% Year-to-date Change: -9.0% | |
| AQN Links: Profile News Message Board | |
| Charts:- Daily , Weekly | |
| Add AQN to Watchlist: View: Get Complete AQN Trend Analysis ➞ | |
 | UGP Ultrapar Participacoes S.A. |
| Sector: Energy | |
| SubSector: Oil & Gas Refining & Marketing | |
| MarketCap: 3473.54 Millions | |
| Recent Price: 5.14 Market Intelligence Score: 0 | |
| Day Percent Change: -1.25% Day Change: -0.07 | |
| Week Change: -2.19% Year-to-date Change: -5.1% | |
| UGP Links: Profile News Message Board | |
| Charts:- Daily , Weekly | |
| Add UGP to Watchlist: View: Get Complete UGP Trend Analysis ➞ | |
 | CIGI Colliers International Group Inc. |
| Sector: Financials | |
| SubSector: Property Management | |
| MarketCap: 1928.42 Millions | |
| Recent Price: 108.52 Market Intelligence Score: 0 | |
| Day Percent Change: -1.27% Day Change: -1.40 | |
| Week Change: -4.1% Year-to-date Change: -14.2% | |
| CIGI Links: Profile News Message Board | |
| Charts:- Daily , Weekly | |
| Add CIGI to Watchlist: View: Get Complete CIGI Trend Analysis ➞ | |
 | VIV Telefonica Brasil S.A. |
| Sector: Technology | |
| SubSector: Wireless Communications | |
| MarketCap: 19611.1 Millions | |
| Recent Price: 9.29 Market Intelligence Score: 0 | |
| Day Percent Change: -1.28% Day Change: -0.12 | |
| Week Change: -2.82% Year-to-date Change: -15.1% | |
| VIV Links: Profile News Message Board | |
| Charts:- Daily , Weekly | |
| Add VIV to Watchlist: View: Get Complete VIV Trend Analysis ➞ | |
 | LOMA Loma Negra Compania Industrial Argentina Sociedad Anonima |
| Sector: Industrials | |
| SubSector: General Building Materials | |
| MarketCap: 408.853 Millions | |
| Recent Price: 6.88 Market Intelligence Score: 25 | |
| Day Percent Change: -1.29% Day Change: -0.09 | |
| Week Change: -5.23% Year-to-date Change: -3.0% | |
| LOMA Links: Profile News Message Board | |
| Charts:- Daily , Weekly | |
| Add LOMA to Watchlist: View: Get Complete LOMA Trend Analysis ➞ | |
| To view more stocks, click on Next / Previous arrows or select different range: 0 - 25 , 25 - 50 , 50 - 75 , 75 - 100 , 100 - 125 , 125 - 150 , 150 - 175 , 175 - 200 | ||
| Click To Change The Sort Order: By Market Cap or Company Size Performance: Year-to-date, Week and Day | |
| Select Chart Type: | ||
 Best Stocks Today 12Stocks.com |
© 2024 12Stocks.com Terms & Conditions Privacy Contact Us
All Information Provided Only For Education And Not To Be Used For Investing or Trading. See Terms & Conditions


One More Thing ... Get Best Stocks Delivered Daily!
Never Ever Miss A Move With Our Top Ten Stocks Lists
Find Best Stocks In Any Market - Bull or Bear Market
Take A Peek At Our Top Ten Stocks Lists: Daily, Weekly, Year-to-Date & Top Trends
Find Best Stocks In Any Market - Bull or Bear Market
Take A Peek At Our Top Ten Stocks Lists: Daily, Weekly, Year-to-Date & Top Trends
Latin America Stocks With Best Up Trends [0-bearish to 100-bullish]: BRF S.A[100], Sprott Physical[95], Sprott Physical[83], Sprott Physical[81], Wheaton Precious[76], Northern Dynasty[75], Milestone [73], BRP [69], Pan American[68], Grupo Simec[63], McEwen Mining[63]
Best Latin America Stocks Year-to-Date:
Aurora Cannabis[1152.63%], Banco Macro[63.55%], Grupo Financiero[57.66%], McEwen Mining[55.89%], Celestica [52.19%], Banco BBVA[46.88%], OrganiGram [43.51%], IAMGOLD [42.69%], Silvercorp Metals[38.02%], Hudbay Minerals[35.96%], Endeavour Silver[33.5%] Best Latin America Stocks This Week:
BRF S.A[7.21%], Silvercorp Metals[2.83%], Sprott Physical[1.63%], Sprott Physical[1.38%], Xenon [1.36%], Milestone [1.16%], Canada Goose[1.16%], IMAX [1.13%], Sprott Physical[0.95%], Tilray [0.55%], GFL Environmental[0.52%] Best Latin America Stocks Daily:
Tilray [2.81%], Descartes Systems[2.70%], Companhia Brasileira[2.13%], New Gold[2.00%], IMAX [1.75%], IAMGOLD [1.12%], Suncor Energy[1.02%], Xenon [1.02%], Northern Dynasty[0.95%], Seabridge Gold[0.85%], Cenovus Energy[0.73%]