
 Login Sign Up


| |||||
 |  | ||||

| 12Stocks.com Market Intelligence |
Best Latin America Stocks
|
|
| Quick Read: Top Latin America Stocks By Performances & Trends: Daily, Weekly, Year-to-Date, Market Cap (Size) & Technical Trends | |||
| Best Latin America Views: Quick Browse View, Summary & Slide Show | |||
| 12Stocks.com Latin America Stocks Performances & Trends Daily | |||||||||
|
|  The overall market intelligence score is 32 (0-bearish to 100-bullish) which puts Latin America index in short term bearish to neutral trend. The market intelligence score from previous trading session is 0 and hence an improvement of trend.
| ||||||||
| Here are the market intelligence trend scores of the most requested Latin America stocks at 12Stocks.com (click stock name for detailed review): | |
| Scroll down this page for most comprehensive review of Latin America stocks by performance, trends, technical analysis, charts, fund plays & more | |


| 12Stocks.com: Top Performing Latin America Index Stocks | ||||||||||||||||||||||||||||||||||||||||||||||||
 The top performing Latin America Index stocks year to date are
Now, more recently, over last week, the top performing Latin America Index stocks on the move are


|
||||||||||||||||||||||||||||||||||||||||||||||||
| 12Stocks.com: Investing in Latin America Index with Stocks | |
|
The following table helps investors and traders sort through current performance and trends (as measured by market intelligence score) of various
stocks in the Latin America Index. Quick View: Move mouse or cursor over stock symbol (ticker) to view short-term technical chart and over stock name to view long term chart. Click on  to add stock symbol to your watchlist and to add stock symbol to your watchlist and  to view watchlist. Click on any ticker or stock name for detailed market intelligence report for that stock. to view watchlist. Click on any ticker or stock name for detailed market intelligence report for that stock. |
12Stocks.com Performance of Stocks in Latin America Index
| Ticker | Stock Name | Watchlist | Category | Recent Price | Market Intelligence Score | Change % | YTD Change% |
| AGI | Alamos Gold |   | Materials | 15.30 | 100 | 1.59% | 13.59% |
| ERJ | Embraer S.A | | Industrials | 23.79 | 41 | -1.78% | 28.94% |
| TFII | TFI | | Transports | 142.96 | 26 | 0.92% | 5.13% |
| AFYA | Afya | | Services & Goods | 16.00 | 10 | -0.19% | -27.04% |
| SSRM | SSR Mining | | Materials | 5.34 | 62 | 3.99% | -50.33% |
| TEO | Telecom Argentina | | Technology | 7.18 | 17 | 2.28% | 0.42% |
| TAC | TransAlta | | Utilities | 6.45 | 59 | 0.31% | -22.38% |
| TIXT | TELUS | | Technology | 7.81 | 17 | -1.20% | -8.65% |
| SIM | Grupo Simec | | Materials | 31.00 | 37 | 0.00% | -0.55% |
| ZYME | Zymeworks | | Health Care | 8.85 | 17 | 2.08% | -14.82% |
| AUPH | Aurinia | | Health Care | 4.99 | 35 | 3.74% | -44.49% |
| AZUL | Azul S.A | | Transports | 5.78 | 10 | -0.34% | -40.35% |
| GGAL | Grupo Financiero | | Financials | 28.46 | 83 | 1.53% | 64.84% |
| INTR | Inter & Co | | Financials | 5.21 | 58 | 2.76% | -7.05% |
| IE | Ivanhoe Electric | | Materials | 10.60 | 83 | -1.85% | 4.59% |
| OMAB | Grupo Aeroportuario | | Transports | 75.10 | 36 | -0.27% | -11.26% |
| IAG | IAMGOLD | | Materials | 3.66 | 78 | 0.55% | 44.66% |
| AG | First Majestic | | Materials | 6.73 | 51 | -0.59% | 9.43% |
| OR | Osisko Gold | | Materials | 16.11 | 68 | -0.31% | 12.82% |
| PAM | Pampa Energia | | Utilities | 43.08 | 40 | 2.84% | -13.00% |
| EGO | Eldorado Gold | | Materials | 15.04 | 56 | 0.94% | 15.96% |
| LICY | Li-Cycle | | Industrials | 0.67 | 36 | -16.60% | 7.27% |
| CSIQ | Canadian Solar | | Technology | 14.41 | 10 | -0.83% | -45.06% |
| BBAR | Banco BBVA | | Financials | 8.57 | 83 | 6.20% | 57.54% |
| MEOH | Methanex | | Materials | 47.91 | 93 | 1.81% | 1.16% |
| To view more stocks, click on Next / Previous arrows or select different range: 0 - 25 , 25 - 50 , 50 - 75 , 75 - 100 , 100 - 125 , 125 - 150 , 150 - 175 , 175 - 200 , 200 - 225 | ||
 | Click To Change The Sort Order: By Market Cap or Company Size Performance: Year-to-date, Week and Day |  |
| Detailed Overview Of Latin America Stocks |
| Latin America Technical Overview, Leaders & Laggards, Top Latin America ETF Funds & Detailed Latin America Stocks List, Charts, Trends & More |
| Latin America: Technical Analysis, Trends & YTD Performance | |
 ILF Weekly Chart |
|
| Long Term Trend: Not Good | |
| Medium Term Trend: Not Good | |
 ILF Daily Chart |
|
| Short Term Trend: Very Good | |
| Overall Trend Score: 32 | |
| YTD Performance: -6.85% | |
| **Trend Scores & Views Are Only For Educational Purposes And Not For Investing | |
| 12Stocks.com: Investing in Latin America Index using Exchange Traded Funds | |
|
The following table shows list of key exchange traded funds (ETF) that
help investors play Latin America stock market. For detailed view, check out our ETF Funds section of our website. Quick View: Move mouse or cursor over ETF symbol (ticker) to view short-term technical chart and over ETF name to view long term chart. Click on ticker or stock name for detailed view. Click on to add stock symbol to your watchlist and to view watchlist. |
12Stocks.com List of ETFs that track Latin America Index
| Ticker | ETF Name | Watchlist | Recent Price | Market Intelligence Score | Change % | Week % | Year-to-date % |
| ILF | Latin America 40 | | 27.07 | 32 | 1.20 | -2.1 | -6.85% |
| EWC | Canada | | 37.11 | 68 | 0.71 | -0.11 | 1.17% |
| FLN | Latin America AlphaDEX | | 19.22 | 18 | 0.68 | -5.78 | -7.55% |
| EWZ | Brazil | | 30.74 | 32 | 2.09 | -1.69 | -12.07% |
| EWW | Mexico | | 64.89 | 18 | -0.05 | -3.75 | -4.36% |
| ARGT | Argentina | | 53.47 | 58 | 1.06 | -3.88 | 4.15% |
| EWZS | Brazil Small-Cap | | 13.00 | 25 | 1.56 | -4.02 | -13.68% |
| BRF | Brazil Small-Cap | | 14.86 | 25 | 1.57 | -4.53 | -15.51% |
| BZQ | Short Brazil | | 12.73 | 68 | -3.98 | 3.43 | 26.94% |
| BRZU | Brazil Bull 3X | | 76.80 | 32 | 4.18 | -3.72 | -25.35% |
| FBZ | Brazil AlphaDEX | | 11.24 | 32 | 1.94 | -5.15 | -8.03% |
| 12Stocks.com: Charts, Trends, Fundamental Data and Performances of Latin America Stocks | |
|
We now take in-depth look at all Latin America stocks including charts, multi-period performances and overall trends (as measured by market intelligence score). One can sort Latin America stocks (click link to choose) by Daily, Weekly and by Year-to-Date performances. Also, one can sort by size of the company or by market capitalization. |
| Select Your Default Chart Type: | |||||
| |||||
| Click on stock symbol or name for detailed view. Click on to add stock symbol to your watchlist and to view watchlist. Quick View: Move mouse or cursor over "Daily" to quickly view daily technical stock chart and over "Weekly" to view weekly technical stock chart. | |||||

 | AGI Alamos Gold Inc. |
| Sector: Materials | |
| SubSector: Gold | |
| MarketCap: 1740.39 Millions | |
| Recent Price: 15.30 Market Intelligence Score: 100 | |
| Day Percent Change: 1.59% Day Change: 0.24 | |
| Week Change: 0.59% Year-to-date Change: 13.6% | |
| AGI Links: Profile News Message Board | |
| Charts:- Daily , Weekly | |
| Add AGI to Watchlist: View: Get Complete AGI Trend Analysis ➞ | |
 | ERJ Embraer S.A. |
| Sector: Industrials | |
| SubSector: Aerospace/Defense Products & Services | |
| MarketCap: 1623.71 Millions | |
| Recent Price: 23.79 Market Intelligence Score: 41 | |
| Day Percent Change: -1.78% Day Change: -0.43 | |
| Week Change: -4.27% Year-to-date Change: 28.9% | |
| ERJ Links: Profile News Message Board | |
| Charts:- Daily , Weekly | |
| Add ERJ to Watchlist: View: Get Complete ERJ Trend Analysis ➞ | |
 | TFII TFI International Inc. |
| Sector: Transports | |
| SubSector: Trucking | |
| MarketCap: 1621.25 Millions | |
| Recent Price: 142.96 Market Intelligence Score: 26 | |
| Day Percent Change: 0.92% Day Change: 1.31 | |
| Week Change: -8.44% Year-to-date Change: 5.1% | |
| TFII Links: Profile News Message Board | |
| Charts:- Daily , Weekly | |
| Add TFII to Watchlist: View: Get Complete TFII Trend Analysis ➞ | |
 | AFYA Afya Limited |
| Sector: Services & Goods | |
| SubSector: Education & Training Services | |
| MarketCap: 1559.26 Millions | |
| Recent Price: 16.00 Market Intelligence Score: 10 | |
| Day Percent Change: -0.19% Day Change: -0.03 | |
| Week Change: -5.66% Year-to-date Change: -27.0% | |
| AFYA Links: Profile News Message Board | |
| Charts:- Daily , Weekly | |
| Add AFYA to Watchlist: View: Get Complete AFYA Trend Analysis ➞ | |
 | SSRM SSR Mining Inc. |
| Sector: Materials | |
| SubSector: Gold | |
| MarketCap: 1546.09 Millions | |
| Recent Price: 5.34 Market Intelligence Score: 62 | |
| Day Percent Change: 3.99% Day Change: 0.21 | |
| Week Change: 2.99% Year-to-date Change: -50.3% | |
| SSRM Links: Profile News Message Board | |
| Charts:- Daily , Weekly | |
| Add SSRM to Watchlist: View: Get Complete SSRM Trend Analysis ➞ | |
 | TEO Telecom Argentina S.A. |
| Sector: Technology | |
| SubSector: Diversified Communication Services | |
| MarketCap: 1508.64 Millions | |
| Recent Price: 7.18 Market Intelligence Score: 17 | |
| Day Percent Change: 2.28% Day Change: 0.16 | |
| Week Change: -4.77% Year-to-date Change: 0.4% | |
| TEO Links: Profile News Message Board | |
| Charts:- Daily , Weekly | |
| Add TEO to Watchlist: View: Get Complete TEO Trend Analysis ➞ | |
 | TAC TransAlta Corporation |
| Sector: Utilities | |
| SubSector: Diversified Utilities | |
| MarketCap: 1487.8 Millions | |
| Recent Price: 6.45 Market Intelligence Score: 59 | |
| Day Percent Change: 0.31% Day Change: 0.02 | |
| Week Change: 6.44% Year-to-date Change: -22.4% | |
| TAC Links: Profile News Message Board | |
| Charts:- Daily , Weekly | |
| Add TAC to Watchlist: View: Get Complete TAC Trend Analysis ➞ | |
 | TIXT TELUS International (Cda) Inc. |
| Sector: Technology | |
| SubSector: Software - Infrastructure | |
| MarketCap: 1470 Millions | |
| Recent Price: 7.81 Market Intelligence Score: 17 | |
| Day Percent Change: -1.20% Day Change: -0.10 | |
| Week Change: -8.87% Year-to-date Change: -8.7% | |
| TIXT Links: Profile News Message Board | |
| Charts:- Daily , Weekly | |
| Add TIXT to Watchlist: View: Get Complete TIXT Trend Analysis ➞ | |
 | SIM Grupo Simec, S.A.B. de C.V. |
| Sector: Materials | |
| SubSector: Steel & Iron | |
| MarketCap: 1418.28 Millions | |
| Recent Price: 31.00 Market Intelligence Score: 37 | |
| Day Percent Change: 0.00% Day Change: 0.00 | |
| Week Change: -6.06% Year-to-date Change: -0.6% | |
| SIM Links: Profile News Message Board | |
| Charts:- Daily , Weekly | |
| Add SIM to Watchlist: View: Get Complete SIM Trend Analysis ➞ | |
 | ZYME Zymeworks Inc. |
| Sector: Health Care | |
| SubSector: Biotechnology | |
| MarketCap: 1373.55 Millions | |
| Recent Price: 8.85 Market Intelligence Score: 17 | |
| Day Percent Change: 2.08% Day Change: 0.18 | |
| Week Change: -4.32% Year-to-date Change: -14.8% | |
| ZYME Links: Profile News Message Board | |
| Charts:- Daily , Weekly | |
| Add ZYME to Watchlist: View: Get Complete ZYME Trend Analysis ➞ | |
 | AUPH Aurinia Pharmaceuticals Inc. |
| Sector: Health Care | |
| SubSector: Biotechnology | |
| MarketCap: 1319.75 Millions | |
| Recent Price: 4.99 Market Intelligence Score: 35 | |
| Day Percent Change: 3.74% Day Change: 0.18 | |
| Week Change: -2.16% Year-to-date Change: -44.5% | |
| AUPH Links: Profile News Message Board | |
| Charts:- Daily , Weekly | |
| Add AUPH to Watchlist: View: Get Complete AUPH Trend Analysis ➞ | |
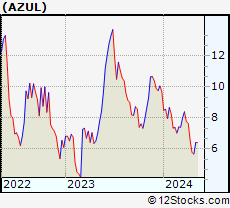 | AZUL Azul S.A. |
| Sector: Transports | |
| SubSector: Major Airlines | |
| MarketCap: 1289.85 Millions | |
| Recent Price: 5.78 Market Intelligence Score: 10 | |
| Day Percent Change: -0.34% Day Change: -0.02 | |
| Week Change: -12.02% Year-to-date Change: -40.4% | |
| AZUL Links: Profile News Message Board | |
| Charts:- Daily , Weekly | |
| Add AZUL to Watchlist: View: Get Complete AZUL Trend Analysis ➞ | |
 | GGAL Grupo Financiero Galicia S.A. |
| Sector: Financials | |
| SubSector: Foreign Regional Banks | |
| MarketCap: 1274.69 Millions | |
| Recent Price: 28.46 Market Intelligence Score: 83 | |
| Day Percent Change: 1.53% Day Change: 0.43 | |
| Week Change: -4.4% Year-to-date Change: 64.8% | |
| GGAL Links: Profile News Message Board | |
| Charts:- Daily , Weekly | |
| Add GGAL to Watchlist: View: Get Complete GGAL Trend Analysis ➞ | |
 | INTR Inter & Co, Inc. |
| Sector: Financials | |
| SubSector: Banks - Regional | |
| MarketCap: 1250 Millions | |
| Recent Price: 5.21 Market Intelligence Score: 58 | |
| Day Percent Change: 2.76% Day Change: 0.14 | |
| Week Change: -3.16% Year-to-date Change: -7.1% | |
| INTR Links: Profile News Message Board | |
| Charts:- Daily , Weekly | |
| Add INTR to Watchlist: View: Get Complete INTR Trend Analysis ➞ | |
 | IE Ivanhoe Electric Inc. |
| Sector: Materials | |
| SubSector: Copper | |
| MarketCap: 1200 Millions | |
| Recent Price: 10.60 Market Intelligence Score: 83 | |
| Day Percent Change: -1.85% Day Change: -0.20 | |
| Week Change: 1.34% Year-to-date Change: 4.6% | |
| IE Links: Profile News Message Board | |
| Charts:- Daily , Weekly | |
| Add IE to Watchlist: View: Get Complete IE Trend Analysis ➞ | |
 | OMAB Grupo Aeroportuario del Centro Norte, S.A.B. de C.V. |
| Sector: Transports | |
| SubSector: Air Services, Other | |
| MarketCap: 1196.38 Millions | |
| Recent Price: 75.10 Market Intelligence Score: 36 | |
| Day Percent Change: -0.27% Day Change: -0.20 | |
| Week Change: -5.61% Year-to-date Change: -11.3% | |
| OMAB Links: Profile News Message Board | |
| Charts:- Daily , Weekly | |
| Add OMAB to Watchlist: View: Get Complete OMAB Trend Analysis ➞ | |
 | IAG IAMGOLD Corporation |
| Sector: Materials | |
| SubSector: Gold | |
| MarketCap: 1158.09 Millions | |
| Recent Price: 3.66 Market Intelligence Score: 78 | |
| Day Percent Change: 0.55% Day Change: 0.02 | |
| Week Change: -2.66% Year-to-date Change: 44.7% | |
| IAG Links: Profile News Message Board | |
| Charts:- Daily , Weekly | |
| Add IAG to Watchlist: View: Get Complete IAG Trend Analysis ➞ | |
 | AG First Majestic Silver Corp. |
| Sector: Materials | |
| SubSector: Silver | |
| MarketCap: 1128.56 Millions | |
| Recent Price: 6.73 Market Intelligence Score: 51 | |
| Day Percent Change: -0.59% Day Change: -0.04 | |
| Week Change: -10.51% Year-to-date Change: 9.4% | |
| AG Links: Profile News Message Board | |
| Charts:- Daily , Weekly | |
| Add AG to Watchlist: View: Get Complete AG Trend Analysis ➞ | |
 | OR Osisko Gold Royalties Ltd |
| Sector: Materials | |
| SubSector: Gold | |
| MarketCap: 1025.99 Millions | |
| Recent Price: 16.11 Market Intelligence Score: 68 | |
| Day Percent Change: -0.31% Day Change: -0.05 | |
| Week Change: -1.95% Year-to-date Change: 12.8% | |
| OR Links: Profile News Message Board | |
| Charts:- Daily , Weekly | |
| Add OR to Watchlist: View: Get Complete OR Trend Analysis ➞ | |
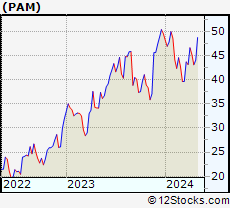 | PAM Pampa Energia S.A. |
| Sector: Utilities | |
| SubSector: Electric Utilities | |
| MarketCap: 1004.14 Millions | |
| Recent Price: 43.08 Market Intelligence Score: 40 | |
| Day Percent Change: 2.84% Day Change: 1.19 | |
| Week Change: -4.65% Year-to-date Change: -13.0% | |
| PAM Links: Profile News Message Board | |
| Charts:- Daily , Weekly | |
| Add PAM to Watchlist: View: Get Complete PAM Trend Analysis ➞ | |
 | EGO Eldorado Gold Corporation |
| Sector: Materials | |
| SubSector: Gold | |
| MarketCap: 982.519 Millions | |
| Recent Price: 15.04 Market Intelligence Score: 56 | |
| Day Percent Change: 0.94% Day Change: 0.14 | |
| Week Change: -0.66% Year-to-date Change: 16.0% | |
| EGO Links: Profile News Message Board | |
| Charts:- Daily , Weekly | |
| Add EGO to Watchlist: View: Get Complete EGO Trend Analysis ➞ | |
 | LICY Li-Cycle Holdings Corp. |
| Sector: Industrials | |
| SubSector: Waste Management | |
| MarketCap: 959 Millions | |
| Recent Price: 0.67 Market Intelligence Score: 36 | |
| Day Percent Change: -16.60% Day Change: -0.13 | |
| Week Change: -22.07% Year-to-date Change: 7.3% | |
| LICY Links: Profile News Message Board | |
| Charts:- Daily , Weekly | |
| Add LICY to Watchlist: View: Get Complete LICY Trend Analysis ➞ | |
 | CSIQ Canadian Solar Inc. |
| Sector: Technology | |
| SubSector: Semiconductor - Specialized | |
| MarketCap: 957.96 Millions | |
| Recent Price: 14.41 Market Intelligence Score: 10 | |
| Day Percent Change: -0.83% Day Change: -0.12 | |
| Week Change: -8.51% Year-to-date Change: -45.1% | |
| CSIQ Links: Profile News Message Board | |
| Charts:- Daily , Weekly | |
| Add CSIQ to Watchlist: View: Get Complete CSIQ Trend Analysis ➞ | |
 | BBAR Banco BBVA Argentina S.A. |
| Sector: Financials | |
| SubSector: Foreign Regional Banks | |
| MarketCap: 895.479 Millions | |
| Recent Price: 8.57 Market Intelligence Score: 83 | |
| Day Percent Change: 6.20% Day Change: 0.50 | |
| Week Change: -1.38% Year-to-date Change: 57.5% | |
| BBAR Links: Profile News Message Board | |
| Charts:- Daily , Weekly | |
| Add BBAR to Watchlist: View: Get Complete BBAR Trend Analysis ➞ | |
 | MEOH Methanex Corporation |
| Sector: Materials | |
| SubSector: Specialty Chemicals | |
| MarketCap: 894.357 Millions | |
| Recent Price: 47.91 Market Intelligence Score: 93 | |
| Day Percent Change: 1.81% Day Change: 0.85 | |
| Week Change: 0% Year-to-date Change: 1.2% | |
| MEOH Links: Profile News Message Board | |
| Charts:- Daily , Weekly | |
| Add MEOH to Watchlist: View: Get Complete MEOH Trend Analysis ➞ | |
| To view more stocks, click on Next / Previous arrows or select different range: 0 - 25 , 25 - 50 , 50 - 75 , 75 - 100 , 100 - 125 , 125 - 150 , 150 - 175 , 175 - 200 , 200 - 225 | ||
| Click To Change The Sort Order: By Market Cap or Company Size Performance: Year-to-date, Week and Day | |
| Select Chart Type: | ||
 Best Stocks Today 12Stocks.com |
© 2024 12Stocks.com Terms & Conditions Privacy Contact Us
All Information Provided Only For Education And Not To Be Used For Investing or Trading. See Terms & Conditions


One More Thing ... Get Best Stocks Delivered Daily!
Never Ever Miss A Move With Our Top Ten Stocks Lists
Find Best Stocks In Any Market - Bull or Bear Market
Take A Peek At Our Top Ten Stocks Lists: Daily, Weekly, Year-to-Date & Top Trends
Find Best Stocks In Any Market - Bull or Bear Market
Take A Peek At Our Top Ten Stocks Lists: Daily, Weekly, Year-to-Date & Top Trends
Latin America Stocks With Best Up Trends [0-bearish to 100-bullish]: SilverCrest Metals[100], Alamos Gold[100], Kinross Gold[93], Methanex [93], Agnico Eagle[93], Pan American[90], Crescent Point[88], IRSA Inversiones[88], Sandstorm Gold[88], Suncor Energy[88], Cenovus Energy[88]
Best Latin America Stocks Year-to-Date:
Aurora Cannabis[1256.57%], Fusion [121.04%], D-Wave Quantum[81.22%], Banco Macro[73.59%], Grupo Financiero[64.84%], Banco BBVA[57.54%], McEwen Mining[55.62%], Canopy Growth[55.38%], IAMGOLD [44.66%], OrganiGram [43.51%], Hudbay Minerals[41.12%] Best Latin America Stocks This Week:
Controladora Vuela[10.64%], SilverCrest Metals[9.57%], TransAlta [6.44%], Canada Goose[5.84%], Lululemon Athletica[4.86%], Petroleo Brasileiro[4.77%], Kinross Gold[4.48%], IMAX [4.26%], BrasilAgro -[4.16%], Agnico Eagle[3.89%], Ready Capital[3.61%] Best Latin America Stocks Daily:
Vision Marine[7.40%], Banco BBVA[6.20%], Ambipar Emergency[6.09%], Trilogy Metals[5.79%], Petroleo Brasileiro[5.71%], Cresud Sociedad[4.44%], BrasilAgro -[4.38%], SilverCrest Metals[4.36%], Kinross Gold[3.99%], SSR Mining[3.99%], Grupo Supervielle[3.77%]