
 Login Sign Up


| |||||
 |  | ||||

| 12Stocks.com Market Intelligence |
Best Industrial Stocks
| In a hurry? Industrial Stocks Lists: Performance Trends Table, Stock Charts
Sort Industrial stocks: Daily, Weekly, Year-to-Date, Market Cap & Trends. Filter Industrial stocks list by size:All Industrial Large Mid-Range Small |
| 12Stocks.com Industrial Stocks Performances & Trends Daily | |||||||||
|
|  The overall Smart Investing & Trading Score is 78 (0-bearish to 100-bullish) which puts Industrial sector in short term neutral to bullish trend. The Smart Investing & Trading Score from previous trading session is 95 and hence a deterioration of trend.
| ||||||||
Here are the Smart Investing & Trading Scores of the most requested Industrial stocks at 12Stocks.com (click stock name for detailed review):
|


| 12Stocks.com: Investing in Industrial sector with Stocks | |
|
The following table helps investors and traders sort through current performance and trends (as measured by Smart Investing & Trading Score) of various
stocks in the Industrial sector. Quick View: Move mouse or cursor over stock symbol (ticker) to view short-term Technical chart and over stock name to view long term chart. Click on  to add stock symbol to your watchlist and to add stock symbol to your watchlist and  to view watchlist. Click on any ticker or stock name for detailed market intelligence report for that stock. to view watchlist. Click on any ticker or stock name for detailed market intelligence report for that stock. |
12Stocks.com Performance of Stocks in Industrial Sector
| Ticker | Stock Name | Watchlist | Category | Recent Price | Smart Investing & Trading Score | Change % | Weekly Change% |
| AMPX | Amprius Technologies |   | Electrical Equipment & Parts | 6.44 | 93 | -0.92% | 37.61% |
| ENVX | Enovix | | Electrical Equipment & Parts | 14.07 | 90 | -0.35% | 23.53% |
| JOBY | Joby Aviation | | Airports & Air | 12.04 | 95 | -2.35% | 14.12% |
| SPCE | Virgin Galactic | | Conglomerates | 3.12 | 90 | 2.30% | 11.03% |
| PCT | PureCycle Technologies | | Pollution & Treatment Controls | 15.25 | 90 | -1.36% | 10.83% |
| ATRO | Astronics | | Aerospace/Defense | 36.11 | 95 | 16.15% | 10.67% |
| PLUG | Plug Power | | Electrical Equipment | 1.62 | 83 | -3.57% | 10.20% |
| HSHP | Himalaya Shipping | | Marine Shipping | 6.78 | 100 | 2.26% | 10.06% |
| RKLB | Rocket Lab | | Aerospace & Defense | 39.03 | 90 | -0.18% | 9.45% |
| TH | Target Hospitality | | Conglomerates | 8.01 | 88 | -1.23% | 8.98% |
| BLD | TopBuild | | Building Materials | 377.87 | 90 | -1.79% | 8.70% |
| TREX | Trex | | Building Materials | 63.89 | 100 | -0.34% | 8.40% |
| AVAV | AeroVironment | | Aerospace/Defense | 263.80 | 93 | 11.04% | 7.14% |
| BBCP | Concrete Pumping | | Building Materials | 6.88 | 95 | -1.01% | 7.00% |
| SLND | Southland | | Engineering & Construction | 4.75 | 90 | -1.25% | 5.79% |
| ASPN | Aspen Aerogels | | Building Materials | 6.83 | 68 | -2.43% | 5.73% |
| WTTR | Select Energy | | Pollution & Treatment Controls | 9.63 | 80 | -1.13% | 5.71% |
| NPWR | NET Power | | Specialty Industrial Machinery | 3.31 | 90 | -0.60% | 5.08% |
| HAYW | Hayward | | Electrical Equipment & Parts | 14.92 | 95 | -2.04% | 5.07% |
| BA | Boeing | | Aerospace/Defense | 226.84 | 95 | 0.33% | 5.06% |
| MHO | M/I Homes | | Residential | 120.99 | 93 | -0.03% | 4.81% |
| BLDR | Builders FirstSource | | Building Materials | 133.28 | 83 | -1.36% | 4.76% |
| AIR | AAR | | Aerospace/Defense | 74.84 | 100 | 0.39% | 4.73% |
| TEX | Terex | | Machinery | 52.12 | 90 | -2.40% | 4.68% |
| MLI | Mueller Industries | | Fabrication | 86.39 | 95 | 0.90% | 4.54% |
| For chart view version of above stock list: Chart View ➞ 0 - 25 , 25 - 50 , 50 - 75 , 75 - 100 , 100 - 125 , 125 - 150 , 150 - 175 , 175 - 200 , 200 - 225 , 225 - 250 | ||
 | Click To Change The Sort Order: By Market Cap or Company Size Performance: Year-to-date, Week and Day |  |
|
Get the most comprehensive stock market coverage daily at 12Stocks.com ➞ Best Stocks Today ➞ Best Stocks Weekly ➞ Best Stocks Year-to-Date ➞ Best Stocks Trends ➞  Best Stocks Today 12Stocks.com Best Nasdaq Stocks ➞ Best S&P 500 Stocks ➞ Best Tech Stocks ➞ Best Biotech Stocks ➞ |
| Detailed Overview of Industrial Stocks |
| Industrial Technical Overview, Leaders & Laggards, Top Industrial ETF Funds & Detailed Industrial Stocks List, Charts, Trends & More |
| Industrial Sector: Technical Analysis, Trends & YTD Performance | |
| Industrial sector is composed of stocks
from industrial machinery, aerospace, defense, farm/construction
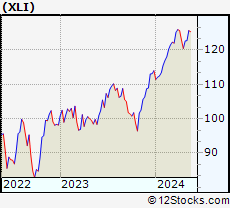
and industrial services subsectors. Industrial sector, as represented by XLI, an exchange-traded fund [ETF] that holds basket of Industrial stocks (e.g, Caterpillar, Boeing) is up by 14.34% and is currently outperforming the overall market by 8.03% year-to-date. Below is a quick view of Technical charts and trends: |
|
 XLI Weekly Chart |
|
| Long Term Trend: Very Good | |
| Medium Term Trend: Very Good | |
 XLI Daily Chart |
|
| Short Term Trend: Good | |
| Overall Trend Score: 78 | |
| YTD Performance: 14.34% | |
| **Trend Scores & Views Are Only For Educational Purposes And Not For Investing | |
| 12Stocks.com: Top Performing Industrial Sector Stocks | ||||||||||||||||||||||||||||||||||||||||||||||||
 The top performing Industrial sector stocks year to date are
Now, more recently, over last week, the top performing Industrial sector stocks on the move are


|
||||||||||||||||||||||||||||||||||||||||||||||||
| 12Stocks.com: Investing in Industrial Sector using Exchange Traded Funds | |
|
The following table shows list of key exchange traded funds (ETF) that
help investors track Industrial Index. For detailed view, check out our ETF Funds section of our website. Quick View: Move mouse or cursor over ETF symbol (ticker) to view short-term Technical chart and over ETF name to view long term chart. Click on ticker or stock name for detailed view. Click on to add stock symbol to your watchlist and to view watchlist. |
12Stocks.com List of ETFs that track Industrial Index
| Ticker | ETF Name | Watchlist | Recent Price | Smart Investing & Trading Score | Change % | Week % | Year-to-date % |
| XLI | Industrial | | 150.20 | 78 | -0.36 | 0.52 | 14.34% |
| UXI | Industrials | | 44.55 | 78 | -0.68 | 0.99 | 22.86% |
| PPA | Aerospace & Defense | | 142.80 | 85 | 0.34 | 0.73 | 24.52% |
| ITA | Aerospace & Defense | | 189.78 | 95 | 0.6 | 1.56 | 30.78% |
| ITB | Home Construction | | 98.75 | 83 | -1.48 | 2.48 | -3.83% |
| XHB | Homebuilders | | 104.75 | 83 | -1.24 | 2.1 | 0.56% |
| SIJ | Short Industrials | | 12.24 | 53 | 0.58 | -0.95 | 46.79% |
| 12Stocks.com: Charts, Trends, Fundamental Data and Performances of Industrial Stocks | |
|
We now take in-depth look at all Industrial stocks including charts, multi-period performances and overall trends (as measured by Smart Investing & Trading Score). One can sort Industrial stocks (click link to choose) by Daily, Weekly and by Year-to-Date performances. Also, one can sort by size of the company or by market capitalization. |
| Select Your Default Chart Type: | |||||
| |||||
| Click on stock symbol or name for detailed view. Click on to add stock symbol to your watchlist and to view watchlist. Quick View: Move mouse or cursor over "Daily" to quickly view daily Technical stock chart and over "Weekly" to view weekly Technical stock chart. | |||||

 | AMPX Amprius Technologies, Inc. |
| Sector: Industrials | |
| SubSector: Electrical Equipment & Parts | |
| MarketCap: 608 Millions | |
| Recent Price: 6.44 Smart Investing & Trading Score: 93 | |
| Day Percent Change: -0.92% Day Change: -0.06 | |
| Week Change: 37.61% Year-to-date Change: 130.0% | |
| AMPX Links: Profile News Message Board | |
| Charts:- Daily , Weekly | |
| Add AMPX to Watchlist: View: Get Complete AMPX Trend Analysis ➞ | |
 | ENVX Enovix Corporation |
| Sector: Industrials | |
| SubSector: Electrical Equipment & Parts | |
| MarketCap: 2740 Millions | |
| Recent Price: 14.07 Smart Investing & Trading Score: 90 | |
| Day Percent Change: -0.35% Day Change: -0.05 | |
| Week Change: 23.53% Year-to-date Change: 29.4% | |
| ENVX Links: Profile News Message Board | |
| Charts:- Daily , Weekly | |
| Add ENVX to Watchlist: View: Get Complete ENVX Trend Analysis ➞ | |
 | JOBY Joby Aviation, Inc. |
| Sector: Industrials | |
| SubSector: Airports & Air Services | |
| MarketCap: 5810 Millions | |
| Recent Price: 12.04 Smart Investing & Trading Score: 95 | |
| Day Percent Change: -2.35% Day Change: -0.29 | |
| Week Change: 14.12% Year-to-date Change: 48.1% | |
| JOBY Links: Profile News Message Board | |
| Charts:- Daily , Weekly | |
| Add JOBY to Watchlist: View: Get Complete JOBY Trend Analysis ➞ | |
 | SPCE Virgin Galactic Holdings, Inc. |
| Sector: Industrials | |
| SubSector: Conglomerates | |
| MarketCap: 2612.48 Millions | |
| Recent Price: 3.12 Smart Investing & Trading Score: 90 | |
| Day Percent Change: 2.3% Day Change: 0.07 | |
| Week Change: 11.03% Year-to-date Change: -46.9% | |
| SPCE Links: Profile News Message Board | |
| Charts:- Daily , Weekly | |
| Add SPCE to Watchlist: View: Get Complete SPCE Trend Analysis ➞ | |
 | PCT PureCycle Technologies, Inc. |
| Sector: Industrials | |
| SubSector: Pollution & Treatment Controls | |
| MarketCap: 1610 Millions | |
| Recent Price: 15.25 Smart Investing & Trading Score: 90 | |
| Day Percent Change: -1.36% Day Change: -0.21 | |
| Week Change: 10.83% Year-to-date Change: 48.8% | |
| PCT Links: Profile News Message Board | |
| Charts:- Daily , Weekly | |
| Add PCT to Watchlist: View: Get Complete PCT Trend Analysis ➞ | |
 | ATRO Astronics Corporation |
| Sector: Industrials | |
| SubSector: Aerospace/Defense Products & Services | |
| MarketCap: 287.201 Millions | |
| Recent Price: 36.11 Smart Investing & Trading Score: 95 | |
| Day Percent Change: 16.15% Day Change: 5.02 | |
| Week Change: 10.67% Year-to-date Change: 126.3% | |
| ATRO Links: Profile News Message Board | |
| Charts:- Daily , Weekly | |
| Add ATRO to Watchlist: View: Get Complete ATRO Trend Analysis ➞ | |
 | PLUG Plug Power Inc. |
| Sector: Industrials | |
| SubSector: Industrial Electrical Equipment | |
| MarketCap: 1233.09 Millions | |
| Recent Price: 1.62 Smart Investing & Trading Score: 83 | |
| Day Percent Change: -3.57% Day Change: -0.06 | |
| Week Change: 10.2% Year-to-date Change: -23.9% | |
| PLUG Links: Profile News Message Board | |
| Charts:- Daily , Weekly | |
| Add PLUG to Watchlist: View: Get Complete PLUG Trend Analysis ➞ | |
 | HSHP Himalaya Shipping Ltd. |
| Sector: Industrials | |
| SubSector: Marine Shipping | |
| MarketCap: 179 Millions | |
| Recent Price: 6.78 Smart Investing & Trading Score: 100 | |
| Day Percent Change: 2.26% Day Change: 0.15 | |
| Week Change: 10.06% Year-to-date Change: 41.1% | |
| HSHP Links: Profile News Message Board | |
| Charts:- Daily , Weekly | |
| Add HSHP to Watchlist: View: Get Complete HSHP Trend Analysis ➞ | |
 | RKLB Rocket Lab USA, Inc. |
| Sector: Industrials | |
| SubSector: Aerospace & Defense | |
| MarketCap: 2820 Millions | |
| Recent Price: 39.03 Smart Investing & Trading Score: 90 | |
| Day Percent Change: -0.18% Day Change: -0.07 | |
| Week Change: 9.45% Year-to-date Change: 53.2% | |
| RKLB Links: Profile News Message Board | |
| Charts:- Daily , Weekly | |
| Add RKLB to Watchlist: View: Get Complete RKLB Trend Analysis ➞ | |
 | TH Target Hospitality Corp. |
| Sector: Industrials | |
| SubSector: Conglomerates | |
| MarketCap: 218.048 Millions | |
| Recent Price: 8.01 Smart Investing & Trading Score: 88 | |
| Day Percent Change: -1.23% Day Change: -0.1 | |
| Week Change: 8.98% Year-to-date Change: -17.1% | |
| TH Links: Profile News Message Board | |
| Charts:- Daily , Weekly | |
| Add TH to Watchlist: View: Get Complete TH Trend Analysis ➞ | |
 | BLD TopBuild Corp. |
| Sector: Industrials | |
| SubSector: General Building Materials | |
| MarketCap: 2534.53 Millions | |
| Recent Price: 377.87 Smart Investing & Trading Score: 90 | |
| Day Percent Change: -1.79% Day Change: -6.9 | |
| Week Change: 8.7% Year-to-date Change: 21.4% | |
| BLD Links: Profile News Message Board | |
| Charts:- Daily , Weekly | |
| Add BLD to Watchlist: View: Get Complete BLD Trend Analysis ➞ | |
 | TREX Trex Company, Inc. |
| Sector: Industrials | |
| SubSector: General Building Materials | |
| MarketCap: 4369.23 Millions | |
| Recent Price: 63.89 Smart Investing & Trading Score: 100 | |
| Day Percent Change: -0.34% Day Change: -0.22 | |
| Week Change: 8.4% Year-to-date Change: -7.5% | |
| TREX Links: Profile News Message Board | |
| Charts:- Daily , Weekly | |
| Add TREX to Watchlist: View: Get Complete TREX Trend Analysis ➞ | |
 | AVAV AeroVironment, Inc. |
| Sector: Industrials | |
| SubSector: Aerospace/Defense Products & Services | |
| MarketCap: 1502.41 Millions | |
| Recent Price: 263.80 Smart Investing & Trading Score: 93 | |
| Day Percent Change: 11.04% Day Change: 26.23 | |
| Week Change: 7.14% Year-to-date Change: 71.4% | |
| AVAV Links: Profile News Message Board | |
| Charts:- Daily , Weekly | |
| Add AVAV to Watchlist: View: Get Complete AVAV Trend Analysis ➞ | |
 | BBCP Concrete Pumping Holdings, Inc. |
| Sector: Industrials | |
| SubSector: General Building Materials | |
| MarketCap: 263.653 Millions | |
| Recent Price: 6.88 Smart Investing & Trading Score: 95 | |
| Day Percent Change: -1.01% Day Change: -0.07 | |
| Week Change: 7% Year-to-date Change: 16.6% | |
| BBCP Links: Profile News Message Board | |
| Charts:- Daily , Weekly | |
| Add BBCP to Watchlist: View: Get Complete BBCP Trend Analysis ➞ | |
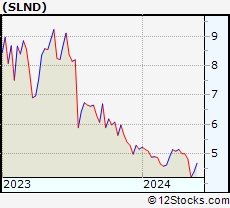 | SLND Southland Holdings, Inc. |
| Sector: Industrials | |
| SubSector: Engineering & Construction | |
| MarketCap: 388 Millions | |
| Recent Price: 4.75 Smart Investing & Trading Score: 90 | |
| Day Percent Change: -1.25% Day Change: -0.06 | |
| Week Change: 5.79% Year-to-date Change: 46.2% | |
| SLND Links: Profile News Message Board | |
| Charts:- Daily , Weekly | |
| Add SLND to Watchlist: View: Get Complete SLND Trend Analysis ➞ | |
 | ASPN Aspen Aerogels, Inc. |
| Sector: Industrials | |
| SubSector: General Building Materials | |
| MarketCap: 150.153 Millions | |
| Recent Price: 6.83 Smart Investing & Trading Score: 68 | |
| Day Percent Change: -2.43% Day Change: -0.17 | |
| Week Change: 5.73% Year-to-date Change: -42.5% | |
| ASPN Links: Profile News Message Board | |
| Charts:- Daily , Weekly | |
| Add ASPN to Watchlist: View: Get Complete ASPN Trend Analysis ➞ | |
 | WTTR Select Energy Services, Inc. |
| Sector: Industrials | |
| SubSector: Pollution & Treatment Controls | |
| MarketCap: 347.075 Millions | |
| Recent Price: 9.63 Smart Investing & Trading Score: 80 | |
| Day Percent Change: -1.13% Day Change: -0.11 | |
| Week Change: 5.71% Year-to-date Change: -26.9% | |
| WTTR Links: Profile News Message Board | |
| Charts:- Daily , Weekly | |
| Add WTTR to Watchlist: View: Get Complete WTTR Trend Analysis ➞ | |
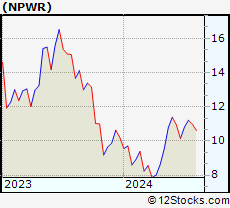 | NPWR NET Power Inc. |
| Sector: Industrials | |
| SubSector: Specialty Industrial Machinery | |
| MarketCap: 2690 Millions | |
| Recent Price: 3.31 Smart Investing & Trading Score: 90 | |
| Day Percent Change: -0.6% Day Change: -0.02 | |
| Week Change: 5.08% Year-to-date Change: -68.7% | |
| NPWR Links: Profile News Message Board | |
| Charts:- Daily , Weekly | |
| Add NPWR to Watchlist: View: Get Complete NPWR Trend Analysis ➞ | |
 | HAYW Hayward Holdings, Inc. |
| Sector: Industrials | |
| SubSector: Electrical Equipment & Parts | |
| MarketCap: 2670 Millions | |
| Recent Price: 14.92 Smart Investing & Trading Score: 95 | |
| Day Percent Change: -2.04% Day Change: -0.31 | |
| Week Change: 5.07% Year-to-date Change: -2.4% | |
| HAYW Links: Profile News Message Board | |
| Charts:- Daily , Weekly | |
| Add HAYW to Watchlist: View: Get Complete HAYW Trend Analysis ➞ | |
 | BA The Boeing Company |
| Sector: Industrials | |
| SubSector: Aerospace/Defense Products & Services | |
| MarketCap: 65336.4 Millions | |
| Recent Price: 226.84 Smart Investing & Trading Score: 95 | |
| Day Percent Change: 0.33% Day Change: 0.75 | |
| Week Change: 5.06% Year-to-date Change: 28.2% | |
| BA Links: Profile News Message Board | |
| Charts:- Daily , Weekly | |
| Add BA to Watchlist: View: Get Complete BA Trend Analysis ➞ | |
 | MHO M/I Homes, Inc. |
| Sector: Industrials | |
| SubSector: Residential Construction | |
| MarketCap: 437.106 Millions | |
| Recent Price: 120.99 Smart Investing & Trading Score: 93 | |
| Day Percent Change: -0.03% Day Change: -0.04 | |
| Week Change: 4.81% Year-to-date Change: -9.0% | |
| MHO Links: Profile News Message Board | |
| Charts:- Daily , Weekly | |
| Add MHO to Watchlist: View: Get Complete MHO Trend Analysis ➞ | |
 | BLDR Builders FirstSource, Inc. |
| Sector: Industrials | |
| SubSector: General Building Materials | |
| MarketCap: 1714.63 Millions | |
| Recent Price: 133.28 Smart Investing & Trading Score: 83 | |
| Day Percent Change: -1.36% Day Change: -1.84 | |
| Week Change: 4.76% Year-to-date Change: -6.8% | |
| BLDR Links: Profile News Message Board | |
| Charts:- Daily , Weekly | |
| Add BLDR to Watchlist: View: Get Complete BLDR Trend Analysis ➞ | |
 | AIR AAR Corp. |
| Sector: Industrials | |
| SubSector: Aerospace/Defense Products & Services | |
| MarketCap: 591.701 Millions | |
| Recent Price: 74.84 Smart Investing & Trading Score: 100 | |
| Day Percent Change: 0.39% Day Change: 0.29 | |
| Week Change: 4.73% Year-to-date Change: 22.1% | |
| AIR Links: Profile News Message Board | |
| Charts:- Daily , Weekly | |
| Add AIR to Watchlist: View: Get Complete AIR Trend Analysis ➞ | |
 | TEX Terex Corporation |
| Sector: Industrials | |
| SubSector: Farm & Construction Machinery | |
| MarketCap: 1083.07 Millions | |
| Recent Price: 52.12 Smart Investing & Trading Score: 90 | |
| Day Percent Change: -2.4% Day Change: -1.28 | |
| Week Change: 4.68% Year-to-date Change: 13.2% | |
| TEX Links: Profile News Message Board | |
| Charts:- Daily , Weekly | |
| Add TEX to Watchlist: View: Get Complete TEX Trend Analysis ➞ | |
 | MLI Mueller Industries, Inc. |
| Sector: Industrials | |
| SubSector: Metal Fabrication | |
| MarketCap: 1259.5 Millions | |
| Recent Price: 86.39 Smart Investing & Trading Score: 95 | |
| Day Percent Change: 0.9% Day Change: 0.77 | |
| Week Change: 4.54% Year-to-date Change: 9.2% | |
| MLI Links: Profile News Message Board | |
| Charts:- Daily , Weekly | |
| Add MLI to Watchlist: View: Get Complete MLI Trend Analysis ➞ | |
| For tabular summary view of above stock list: Summary View ➞ 0 - 25 , 25 - 50 , 50 - 75 , 75 - 100 , 100 - 125 , 125 - 150 , 150 - 175 , 175 - 200 , 200 - 225 , 225 - 250 | ||
| Click To Change The Sort Order: By Market Cap or Company Size Performance: Year-to-date, Week and Day | |
| Select Chart Type: | ||
|
Best Stocks Today 12Stocks.com |
© 2025 12Stocks.com Terms & Conditions Privacy Contact Us
All Information Provided Only For Education And Not To Be Used For Investing or Trading. See Terms & Conditions


One More Thing ... Get Best Stocks Delivered Daily!
Never Ever Miss A Move With Our Top Ten Stocks Lists
Find Best Stocks In Any Market - Bull or Bear Market
Take A Peek At Our Top Ten Stocks Lists: Daily, Weekly, Year-to-Date & Top Trends
Find Best Stocks In Any Market - Bull or Bear Market
Take A Peek At Our Top Ten Stocks Lists: Daily, Weekly, Year-to-Date & Top Trends
Industrial Stocks With Best Up Trends [0-bearish to 100-bullish]: Himalaya Shipping[100], AAR [100], Northrop Grumman[100], Textron [100], Danaher [100], Trex [100], Cummins [100], Astronics [95], Sterling Construction[95], Ducommun [95], Tutor Perini[95]
Best Industrial Stocks Year-to-Date:
System1 [589.08%], Amprius Technologies[130%], Astronics [126.25%], NuScale Power[109.04%], Hertz Global[106.01%], Tutor Perini[102.4%], AeroVironment [71.42%], Carpenter Technology[64.16%], Allegheny Technologies[62.26%], American Superconductor[59.03%], Argan [55.65%] Best Industrial Stocks This Week:
Amprius Technologies[37.61%], Enovix [23.53%], Joby Aviation[14.12%], Virgin Galactic[11.03%], PureCycle Technologies[10.83%], Astronics [10.67%], Plug Power[10.2%], Himalaya Shipping[10.06%], Rocket Lab[9.45%], Target Hospitality[8.98%], TopBuild [8.7%] Best Industrial Stocks Daily:
Astronics [16.15%], AeroVironment [11.04%], Redwire [6.33%], Cornerstone Building[4.43%], NuScale Power[4.05%], Sterling Construction[2.31%], Virgin Galactic[2.3%], Himalaya Shipping[2.26%], Ducommun [2.12%], Tutor Perini[1.91%], Primoris Services[1.87%]