
 Login Sign Up


| |||||
 |  | ||||

| 12Stocks.com Market Intelligence |
Best Industrial Stocks
| In a hurry? Industrial Stocks Lists: Performance Trends Table, Stock Charts
Sort Industrial stocks: Daily, Weekly, Year-to-Date, Market Cap & Trends. Filter Industrial stocks list by size:All Industrial Large Mid-Range Small |
| 12Stocks.com Industrial Stocks Performances & Trends Daily | |||||||||
|
|  The overall Smart Investing & Trading Score is 63 (0-bearish to 100-bullish) which puts Industrial sector in short term neutral to bullish trend. The Smart Investing & Trading Score from previous trading session is 56 and hence an improvement of trend.
| ||||||||
Here are the Smart Investing & Trading Scores of the most requested Industrial stocks at 12Stocks.com (click stock name for detailed review):
|


| 12Stocks.com: Investing in Industrial sector with Stocks | |
|
The following table helps investors and traders sort through current performance and trends (as measured by Smart Investing & Trading Score) of various
stocks in the Industrial sector. Quick View: Move mouse or cursor over stock symbol (ticker) to view short-term Technical chart and over stock name to view long term chart. Click on  to add stock symbol to your watchlist and to add stock symbol to your watchlist and  to view watchlist. Click on any ticker or stock name for detailed market intelligence report for that stock. to view watchlist. Click on any ticker or stock name for detailed market intelligence report for that stock. |
12Stocks.com Performance of Stocks in Industrial Sector
| Ticker | Stock Name | Watchlist | Category | Recent Price | Smart Investing & Trading Score | Change % | Weekly Change% |
| TPC | Tutor Perini |   | Heavy Construction | 13.78 | 68 | 1.92% | 3.77% |
| DHI | D.R. Horton | | Residential | 147.52 | 58 | 3.11% | 3.75% |
| PL | Planet Labs | | Aerospace & Defense | 1.81 | 30 | 4.31% | 3.71% |
| LLAP | Terran Orbital | | Aerospace & Defense | 1.35 | 53 | 3.62% | 3.62% |
| UFI | Unifi | | Textile Industrial | 5.74 | 52 | 0.70% | 3.61% |
| GFF | Griffon | | Building Materials | 68.35 | 58 | 2.75% | 3.61% |
| AVAV | AeroVironment | | Aerospace/Defense | 155.40 | 95 | 3.79% | 3.59% |
| RKLB | Rocket Lab | | Aerospace & Defense | 3.67 | 42 | 2.37% | 3.52% |
| TGI | Triumph | | Aerospace/Defense | 13.27 | 42 | 2.12% | 3.47% |
| JHX | James Hardie | | Cement | 35.41 | 32 | 2.86% | 3.43% |
| SITE | SiteOne Landscape | | Small Tools & Accessories | 161.19 | 58 | 2.67% | 3.37% |
| THR | Thermon | | Machinery | 30.74 | 32 | 2.36% | 3.36% |
| STRL | Sterling Construction | | Heavy Construction | 99.77 | 58 | 2.42% | 3.32% |
| OSIS | OSI Systems | | Electrical Equipment | 140.02 | 63 | 0.42% | 3.31% |
| TDG | TransDigm | | Aerospace/Defense | 1226.47 | 71 | 2.13% | 3.26% |
| OC | Owens Corning | | Building Materials | 165.31 | 63 | 0.53% | 3.25% |
| PRIM | Primoris Services | | Heavy Construction | 44.91 | 68 | 0.92% | 3.17% |
| GTLS | Chart Industries | | Fabrication | 152.71 | 68 | 2.08% | 3.15% |
| ITT | ITT | | Machinery | 128.85 | 58 | 2.47% | 3.12% |
| ETN | Eaton | | Machinery | 312.48 | 68 | 1.42% | 3.12% |
| NNBR | NN | | Machine Tools | 3.97 | 32 | 3.93% | 3.12% |
| GHM | Graham | | Fabrication | 28.90 | 68 | 2.90% | 3.12% |
| LII | Lennox | | Machinery | 470.97 | 58 | 2.54% | 3.02% |
| MYRG | MYR | | Contractors | 163.49 | 68 | 2.28% | 3.01% |
| BDC | Belden | | Electrical Equipment | 84.34 | 68 | 1.17% | 2.96% |
| For chart view version of above stock list: Chart View ➞ 0 - 25 , 25 - 50 , 50 - 75 , 75 - 100 , 100 - 125 , 125 - 150 , 150 - 175 , 175 - 200 , 200 - 225 , 225 - 250 , 250 - 275 | ||
 | Click To Change The Sort Order: By Market Cap or Company Size Performance: Year-to-date, Week and Day |  |
|
Get the most comprehensive stock market coverage daily at 12Stocks.com ➞ Best Stocks Today ➞ Best Stocks Weekly ➞ Best Stocks Year-to-Date ➞ Best Stocks Trends ➞  Best Stocks Today 12Stocks.com Best Nasdaq Stocks ➞ Best S&P 500 Stocks ➞ Best Tech Stocks ➞ Best Biotech Stocks ➞ |
| Detailed Overview of Industrial Stocks |
| Industrial Technical Overview, Leaders & Laggards, Top Industrial ETF Funds & Detailed Industrial Stocks List, Charts, Trends & More |
| Industrial Sector: Technical Analysis, Trends & YTD Performance | |
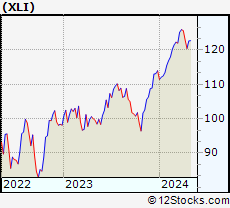
| Industrial sector is composed of stocks
from industrial machinery, aerospace, defense, farm/construction
and industrial services subsectors. Industrial sector, as represented by XLI, an exchange-traded fund [ETF] that holds basket of Industrial stocks (e.g, Caterpillar, Boeing) is up by 7.76% and is currently outperforming the overall market by 2.27% year-to-date. Below is a quick view of Technical charts and trends: |
|
 XLI Weekly Chart |
|
| Long Term Trend: Very Good | |
| Medium Term Trend: Not Good | |
 XLI Daily Chart |
|
| Short Term Trend: Very Good | |
| Overall Trend Score: 63 | |
| YTD Performance: 7.76% | |
| **Trend Scores & Views Are Only For Educational Purposes And Not For Investing | |
| 12Stocks.com: Top Performing Industrial Sector Stocks | ||||||||||||||||||||||||||||||||||||||||||||||||
 The top performing Industrial sector stocks year to date are
Now, more recently, over last week, the top performing Industrial sector stocks on the move are


|
||||||||||||||||||||||||||||||||||||||||||||||||
| 12Stocks.com: Investing in Industrial Sector using Exchange Traded Funds | |
|
The following table shows list of key exchange traded funds (ETF) that
help investors track Industrial Index. For detailed view, check out our ETF Funds section of our website. Quick View: Move mouse or cursor over ETF symbol (ticker) to view short-term Technical chart and over ETF name to view long term chart. Click on ticker or stock name for detailed view. Click on to add stock symbol to your watchlist and to view watchlist. |
12Stocks.com List of ETFs that track Industrial Index
| Ticker | ETF Name | Watchlist | Recent Price | Smart Investing & Trading Score | Change % | Week % | Year-to-date % |
| XLI | Industrial | | 122.83 | 63 | 1.19 | 1.96 | 7.76% |
| UXI | Industrials | | 32.52 | 68 | 2.04 | 3.07 | 12.94% |
| PPA | Aerospace & Defense | | 100.16 | 63 | 1.17 | 1.88 | 8.68% |
| ITA | Aerospace & Defense | | 129.27 | 70 | 0.60 | 0.99 | 2.11% |
| ITB | Home Construction | | 105.25 | 58 | 2.01 | 2.82 | 3.46% |
| XHB | Homebuilders | | 102.97 | 58 | 2.02 | 2.81 | 7.64% |
| SIJ | Short Industrials | | 9.84 | 32 | -2.38 | -3.84 | -13.23% |
| IYJ | Industrials | | 121.66 | 63 | 1.17 | 1.88 | 6.38% |
| EXI | Global Industrials | | 135.67 | 63 | 0.83 | 1.99 | 6.47% |
| VIS | Industrials | | 236.70 | 63 | 1.28 | 1.94 | 7.38% |
| PSCI | SmallCap Industrials | | 119.98 | 63 | -0.03 | 0.96 | 3.47% |
| XAR | Aerospace & Defense | | 134.94 | 65 | 1.56 | 2.05 | -0.35% |
| 12Stocks.com: Charts, Trends, Fundamental Data and Performances of Industrial Stocks | |
|
We now take in-depth look at all Industrial stocks including charts, multi-period performances and overall trends (as measured by Smart Investing & Trading Score). One can sort Industrial stocks (click link to choose) by Daily, Weekly and by Year-to-Date performances. Also, one can sort by size of the company or by market capitalization. |
| Select Your Default Chart Type: | |||||
| |||||
| Click on stock symbol or name for detailed view. Click on to add stock symbol to your watchlist and to view watchlist. Quick View: Move mouse or cursor over "Daily" to quickly view daily Technical stock chart and over "Weekly" to view weekly Technical stock chart. | |||||

 | TPC Tutor Perini Corporation |
| Sector: Industrials | |
| SubSector: Heavy Construction | |
| MarketCap: 382.595 Millions | |
| Recent Price: 13.78 Smart Investing & Trading Score: 68 | |
| Day Percent Change: 1.92% Day Change: 0.26 | |
| Week Change: 3.77% Year-to-date Change: 51.4% | |
| TPC Links: Profile News Message Board | |
| Charts:- Daily , Weekly | |
| Add TPC to Watchlist: View: Get Complete TPC Trend Analysis ➞ | |
 | DHI D.R. Horton, Inc. |
| Sector: Industrials | |
| SubSector: Residential Construction | |
| MarketCap: 13372.6 Millions | |
| Recent Price: 147.52 Smart Investing & Trading Score: 58 | |
| Day Percent Change: 3.11% Day Change: 4.45 | |
| Week Change: 3.75% Year-to-date Change: -2.9% | |
| DHI Links: Profile News Message Board | |
| Charts:- Daily , Weekly | |
| Add DHI to Watchlist: View: Get Complete DHI Trend Analysis ➞ | |
 | PL Planet Labs PBC |
| Sector: Industrials | |
| SubSector: Aerospace & Defense | |
| MarketCap: 874 Millions | |
| Recent Price: 1.81 Smart Investing & Trading Score: 30 | |
| Day Percent Change: 4.31% Day Change: 0.07 | |
| Week Change: 3.71% Year-to-date Change: -26.8% | |
| PL Links: Profile News Message Board | |
| Charts:- Daily , Weekly | |
| Add PL to Watchlist: View: Get Complete PL Trend Analysis ➞ | |
 | LLAP Terran Orbital Corporation |
| Sector: Industrials | |
| SubSector: Aerospace & Defense | |
| MarketCap: 206 Millions | |
| Recent Price: 1.35 Smart Investing & Trading Score: 53 | |
| Day Percent Change: 3.62% Day Change: 0.05 | |
| Week Change: 3.62% Year-to-date Change: 17.6% | |
| LLAP Links: Profile News Message Board | |
| Charts:- Daily , Weekly | |
| Add LLAP to Watchlist: View: Get Complete LLAP Trend Analysis ➞ | |
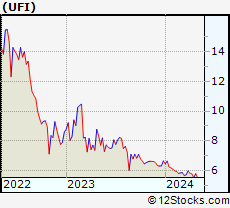 | UFI Unifi, Inc. |
| Sector: Industrials | |
| SubSector: Textile Industrial | |
| MarketCap: 165.04 Millions | |
| Recent Price: 5.74 Smart Investing & Trading Score: 52 | |
| Day Percent Change: 0.70% Day Change: 0.04 | |
| Week Change: 3.61% Year-to-date Change: -13.8% | |
| UFI Links: Profile News Message Board | |
| Charts:- Daily , Weekly | |
| Add UFI to Watchlist: View: Get Complete UFI Trend Analysis ➞ | |
 | GFF Griffon Corporation |
| Sector: Industrials | |
| SubSector: General Building Materials | |
| MarketCap: 616 Millions | |
| Recent Price: 68.35 Smart Investing & Trading Score: 58 | |
| Day Percent Change: 2.75% Day Change: 1.83 | |
| Week Change: 3.61% Year-to-date Change: 12.1% | |
| GFF Links: Profile News Message Board | |
| Charts:- Daily , Weekly | |
| Add GFF to Watchlist: View: Get Complete GFF Trend Analysis ➞ | |
 | AVAV AeroVironment, Inc. |
| Sector: Industrials | |
| SubSector: Aerospace/Defense Products & Services | |
| MarketCap: 1502.41 Millions | |
| Recent Price: 155.40 Smart Investing & Trading Score: 95 | |
| Day Percent Change: 3.79% Day Change: 5.68 | |
| Week Change: 3.59% Year-to-date Change: 23.3% | |
| AVAV Links: Profile News Message Board | |
| Charts:- Daily , Weekly | |
| Add AVAV to Watchlist: View: Get Complete AVAV Trend Analysis ➞ | |
 | RKLB Rocket Lab USA, Inc. |
| Sector: Industrials | |
| SubSector: Aerospace & Defense | |
| MarketCap: 2820 Millions | |
| Recent Price: 3.67 Smart Investing & Trading Score: 42 | |
| Day Percent Change: 2.37% Day Change: 0.08 | |
| Week Change: 3.52% Year-to-date Change: -33.3% | |
| RKLB Links: Profile News Message Board | |
| Charts:- Daily , Weekly | |
| Add RKLB to Watchlist: View: Get Complete RKLB Trend Analysis ➞ | |
 | TGI Triumph Group, Inc. |
| Sector: Industrials | |
| SubSector: Aerospace/Defense Products & Services | |
| MarketCap: 358.901 Millions | |
| Recent Price: 13.27 Smart Investing & Trading Score: 42 | |
| Day Percent Change: 2.12% Day Change: 0.28 | |
| Week Change: 3.47% Year-to-date Change: -20.0% | |
| TGI Links: Profile News Message Board | |
| Charts:- Daily , Weekly | |
| Add TGI to Watchlist: View: Get Complete TGI Trend Analysis ➞ | |
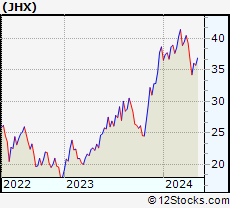 | JHX James Hardie Industries plc |
| Sector: Industrials | |
| SubSector: Cement | |
| MarketCap: 5521 Millions | |
| Recent Price: 35.41 Smart Investing & Trading Score: 32 | |
| Day Percent Change: 2.86% Day Change: 0.98 | |
| Week Change: 3.43% Year-to-date Change: -8.4% | |
| JHX Links: Profile News Message Board | |
| Charts:- Daily , Weekly | |
| Add JHX to Watchlist: View: Get Complete JHX Trend Analysis ➞ | |
 | SITE SiteOne Landscape Supply, Inc. |
| Sector: Industrials | |
| SubSector: Small Tools & Accessories | |
| MarketCap: 2733.56 Millions | |
| Recent Price: 161.19 Smart Investing & Trading Score: 58 | |
| Day Percent Change: 2.67% Day Change: 4.19 | |
| Week Change: 3.37% Year-to-date Change: -0.8% | |
| SITE Links: Profile News Message Board | |
| Charts:- Daily , Weekly | |
| Add SITE to Watchlist: View: Get Complete SITE Trend Analysis ➞ | |
 | THR Thermon Group Holdings, Inc. |
| Sector: Industrials | |
| SubSector: Diversified Machinery | |
| MarketCap: 492.816 Millions | |
| Recent Price: 30.74 Smart Investing & Trading Score: 32 | |
| Day Percent Change: 2.36% Day Change: 0.71 | |
| Week Change: 3.36% Year-to-date Change: -5.6% | |
| THR Links: Profile News Message Board | |
| Charts:- Daily , Weekly | |
| Add THR to Watchlist: View: Get Complete THR Trend Analysis ➞ | |
 | STRL Sterling Construction Company, Inc. |
| Sector: Industrials | |
| SubSector: Heavy Construction | |
| MarketCap: 237.395 Millions | |
| Recent Price: 99.77 Smart Investing & Trading Score: 58 | |
| Day Percent Change: 2.42% Day Change: 2.36 | |
| Week Change: 3.32% Year-to-date Change: 13.5% | |
| STRL Links: Profile News Message Board | |
| Charts:- Daily , Weekly | |
| Add STRL to Watchlist: View: Get Complete STRL Trend Analysis ➞ | |
 | OSIS OSI Systems, Inc. |
| Sector: Industrials | |
| SubSector: Industrial Electrical Equipment | |
| MarketCap: 1100.39 Millions | |
| Recent Price: 140.02 Smart Investing & Trading Score: 63 | |
| Day Percent Change: 0.42% Day Change: 0.58 | |
| Week Change: 3.31% Year-to-date Change: 8.5% | |
| OSIS Links: Profile News Message Board | |
| Charts:- Daily , Weekly | |
| Add OSIS to Watchlist: View: Get Complete OSIS Trend Analysis ➞ | |
 | TDG TransDigm Group Incorporated |
| Sector: Industrials | |
| SubSector: Aerospace/Defense Products & Services | |
| MarketCap: 18441 Millions | |
| Recent Price: 1226.47 Smart Investing & Trading Score: 71 | |
| Day Percent Change: 2.13% Day Change: 25.54 | |
| Week Change: 3.26% Year-to-date Change: 21.2% | |
| TDG Links: Profile News Message Board | |
| Charts:- Daily , Weekly | |
| Add TDG to Watchlist: View: Get Complete TDG Trend Analysis ➞ | |
 | OC Owens Corning |
| Sector: Industrials | |
| SubSector: General Building Materials | |
| MarketCap: 3686.73 Millions | |
| Recent Price: 165.31 Smart Investing & Trading Score: 63 | |
| Day Percent Change: 0.53% Day Change: 0.87 | |
| Week Change: 3.25% Year-to-date Change: 11.5% | |
| OC Links: Profile News Message Board | |
| Charts:- Daily , Weekly | |
| Add OC to Watchlist: View: Get Complete OC Trend Analysis ➞ | |
 | PRIM Primoris Services Corporation |
| Sector: Industrials | |
| SubSector: Heavy Construction | |
| MarketCap: 931.895 Millions | |
| Recent Price: 44.91 Smart Investing & Trading Score: 68 | |
| Day Percent Change: 0.92% Day Change: 0.41 | |
| Week Change: 3.17% Year-to-date Change: 35.2% | |
| PRIM Links: Profile News Message Board | |
| Charts:- Daily , Weekly | |
| Add PRIM to Watchlist: View: Get Complete PRIM Trend Analysis ➞ | |
 | GTLS Chart Industries, Inc. |
| Sector: Industrials | |
| SubSector: Metal Fabrication | |
| MarketCap: 751.15 Millions | |
| Recent Price: 152.71 Smart Investing & Trading Score: 68 | |
| Day Percent Change: 2.08% Day Change: 3.12 | |
| Week Change: 3.15% Year-to-date Change: 12.0% | |
| GTLS Links: Profile News Message Board | |
| Charts:- Daily , Weekly | |
| Add GTLS to Watchlist: View: Get Complete GTLS Trend Analysis ➞ | |
 | ITT ITT Inc. |
| Sector: Industrials | |
| SubSector: Diversified Machinery | |
| MarketCap: 3783.06 Millions | |
| Recent Price: 128.85 Smart Investing & Trading Score: 58 | |
| Day Percent Change: 2.47% Day Change: 3.10 | |
| Week Change: 3.12% Year-to-date Change: 8.0% | |
| ITT Links: Profile News Message Board | |
| Charts:- Daily , Weekly | |
| Add ITT to Watchlist: View: Get Complete ITT Trend Analysis ➞ | |
 | ETN Eaton Corporation plc |
| Sector: Industrials | |
| SubSector: Diversified Machinery | |
| MarketCap: 29829.4 Millions | |
| Recent Price: 312.48 Smart Investing & Trading Score: 68 | |
| Day Percent Change: 1.42% Day Change: 4.39 | |
| Week Change: 3.12% Year-to-date Change: 29.8% | |
| ETN Links: Profile News Message Board | |
| Charts:- Daily , Weekly | |
| Add ETN to Watchlist: View: Get Complete ETN Trend Analysis ➞ | |
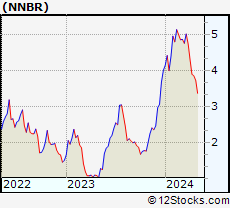 | NNBR NN, Inc. |
| Sector: Industrials | |
| SubSector: Machine Tools & Accessories | |
| MarketCap: 103.348 Millions | |
| Recent Price: 3.97 Smart Investing & Trading Score: 32 | |
| Day Percent Change: 3.93% Day Change: 0.15 | |
| Week Change: 3.12% Year-to-date Change: -0.8% | |
| NNBR Links: Profile News Message Board | |
| Charts:- Daily , Weekly | |
| Add NNBR to Watchlist: View: Get Complete NNBR Trend Analysis ➞ | |
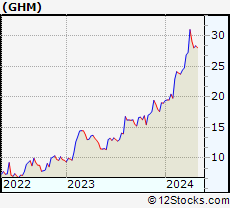 | GHM Graham Corporation |
| Sector: Industrials | |
| SubSector: Metal Fabrication | |
| MarketCap: 143.25 Millions | |
| Recent Price: 28.90 Smart Investing & Trading Score: 68 | |
| Day Percent Change: 2.90% Day Change: 0.82 | |
| Week Change: 3.12% Year-to-date Change: 52.3% | |
| GHM Links: Profile News Message Board | |
| Charts:- Daily , Weekly | |
| Add GHM to Watchlist: View: Get Complete GHM Trend Analysis ➞ | |
 | LII Lennox International Inc. |
| Sector: Industrials | |
| SubSector: Diversified Machinery | |
| MarketCap: 7720.66 Millions | |
| Recent Price: 470.97 Smart Investing & Trading Score: 58 | |
| Day Percent Change: 2.54% Day Change: 11.68 | |
| Week Change: 3.02% Year-to-date Change: 5.2% | |
| LII Links: Profile News Message Board | |
| Charts:- Daily , Weekly | |
| Add LII to Watchlist: View: Get Complete LII Trend Analysis ➞ | |
 | MYRG MYR Group Inc. |
| Sector: Industrials | |
| SubSector: General Contractors | |
| MarketCap: 405.363 Millions | |
| Recent Price: 163.49 Smart Investing & Trading Score: 68 | |
| Day Percent Change: 2.28% Day Change: 3.65 | |
| Week Change: 3.01% Year-to-date Change: 13.0% | |
| MYRG Links: Profile News Message Board | |
| Charts:- Daily , Weekly | |
| Add MYRG to Watchlist: View: Get Complete MYRG Trend Analysis ➞ | |
 | BDC Belden Inc. |
| Sector: Industrials | |
| SubSector: Industrial Electrical Equipment | |
| MarketCap: 1490.59 Millions | |
| Recent Price: 84.34 Smart Investing & Trading Score: 68 | |
| Day Percent Change: 1.17% Day Change: 0.97 | |
| Week Change: 2.96% Year-to-date Change: 9.2% | |
| BDC Links: Profile News Message Board | |
| Charts:- Daily , Weekly | |
| Add BDC to Watchlist: View: Get Complete BDC Trend Analysis ➞ | |
| For tabular summary view of above stock list: Summary View ➞ 0 - 25 , 25 - 50 , 50 - 75 , 75 - 100 , 100 - 125 , 125 - 150 , 150 - 175 , 175 - 200 , 200 - 225 , 225 - 250 , 250 - 275 | ||
| Click To Change The Sort Order: By Market Cap or Company Size Performance: Year-to-date, Week and Day | |
| Select Chart Type: | ||
|
Best Stocks Today 12Stocks.com |
© 2024 12Stocks.com Terms & Conditions Privacy Contact Us
All Information Provided Only For Education And Not To Be Used For Investing or Trading. See Terms & Conditions


One More Thing ... Get Best Stocks Delivered Daily!
Never Ever Miss A Move With Our Top Ten Stocks Lists
Find Best Stocks In Any Market - Bull or Bear Market
Take A Peek At Our Top Ten Stocks Lists: Daily, Weekly, Year-to-Date & Top Trends
Find Best Stocks In Any Market - Bull or Bear Market
Take A Peek At Our Top Ten Stocks Lists: Daily, Weekly, Year-to-Date & Top Trends
Industrial Stocks With Best Up Trends [0-bearish to 100-bullish]: Danaher [100], AZZ [100], Caesarstone [100], Mueller Industries[100], HEICO [100], Generac [100], AAR [100], Northrop Grumman[100], AeroVironment [95], Watts Water[95], Mirion Technologies[95]
Best Industrial Stocks Year-to-Date:
Intuitive Machines[119.34%], FTAI Infrastructure[83.55%], Caesarstone [73.53%], NuScale Power[63.1%], Powell Industries[61.15%], EMCOR [57.06%], Masonite [55.04%], IES [54.63%], Graham [52.32%], Tutor Perini[51.43%], ADS-TEC Energy[51.19%] Best Industrial Stocks This Week:
Caesarstone [14.06%], ZIM Integrated[12.93%], Archer Aviation[11.51%], Powell Industries[9.3%], Li-Cycle [9.22%], Vertical Aerospace[8.75%], AZZ [8.69%], Aspen Aerogels[8.66%], Joby Aviation[8.59%], Redwire [8.47%], NuScale Power[8.45%] Best Industrial Stocks Daily:
FuelCell Energy[10.86%], Xometry [7.18%], Aspen Aerogels[7.08%], Danaher [6.77%], NuScale Power[6.69%], Solid Power[6.33%], AZZ [6.27%], General Electric[5.83%], Caesarstone [5.70%], Plug Power[5.62%], Mueller Industries[5.50%]