
 Login Sign Up


| |||||
 |  | ||||

| 12Stocks.com Market Intelligence |
Best Industrial Stocks
| In a hurry? Industrial Stocks Lists: Performance Trends Table, Stock Charts
Sort Industrial stocks: Daily, Weekly, Year-to-Date, Market Cap & Trends. Filter Industrial stocks list by size:All Industrial Large Mid-Range Small |
| 12Stocks.com Industrial Stocks Performances & Trends Daily | |||||||||
|
|  The overall Smart Investing & Trading Score is 31 (0-bearish to 100-bullish) which puts Industrial sector in short term bearish to neutral trend. The Smart Investing & Trading Score from previous trading session is 26 and an improvement of trend continues.
| ||||||||
Here are the Smart Investing & Trading Scores of the most requested Industrial stocks at 12Stocks.com (click stock name for detailed review):
|


| 12Stocks.com: Investing in Industrial sector with Stocks | |
|
The following table helps investors and traders sort through current performance and trends (as measured by Smart Investing & Trading Score) of various
stocks in the Industrial sector. Quick View: Move mouse or cursor over stock symbol (ticker) to view short-term Technical chart and over stock name to view long term chart. Click on  to add stock symbol to your watchlist and to add stock symbol to your watchlist and  to view watchlist. Click on any ticker or stock name for detailed market intelligence report for that stock. to view watchlist. Click on any ticker or stock name for detailed market intelligence report for that stock. |
12Stocks.com Performance of Stocks in Industrial Sector
| Ticker | Stock Name | Watchlist | Category | Recent Price | Smart Investing & Trading Score | Change % | Weekly Change% |
| EVLV | Evolv Technologies |   | Security & Protection | 3.94 | 46 | 2.34% | -2.72% |
| AGCO | AGCO | | Machinery | 116.73 | 17 | 0.42% | -2.73% |
| SPLP | Steel Partners | | Conglomerates | 37.44 | 36 | 0.00% | -2.75% |
| ITT | ITT | | Machinery | 125.15 | 36 | 0.02% | -2.79% |
| IEX | IDEX | | Machinery | 226.10 | 36 | -0.32% | -2.82% |
| AWI | Armstrong World | | Building Materials | 113.85 | 36 | -0.73% | -2.85% |
| VMC | Vulcan Materials | | Building Materials | 255.07 | 26 | -1.24% | -2.93% |
| UFI | Unifi | | Textile Industrial | 5.62 | 10 | -0.18% | -2.94% |
| RKLB | Rocket Lab | | Aerospace & Defense | 3.62 | 42 | 1.54% | -2.95% |
| EMR | Emerson Electric | | Electrical Equipment | 109.31 | 36 | -0.46% | -2.96% |
| CLH | Clean Harbors | | Waste Mgmt | 190.90 | 26 | -0.46% | -2.98% |
| GVA | Granite Construction | | Heavy Construction | 53.68 | 41 | -0.26% | -3.00% |
| ETN | Eaton | | Machinery | 308.94 | 36 | -0.40% | -3.00% |
| CWST | Casella Waste | | Waste Mgmt | 92.37 | 36 | -0.09% | -3.01% |
| TS | Tenaris S.A | | Fabrication | 37.37 | 31 | -1.92% | -3.01% |
| OC | Owens Corning | | Building Materials | 160.52 | 26 | -1.46% | -3.01% |
| MIDD | Middleby | | Machinery | 141.01 | 23 | -0.18% | -3.03% |
| AAON | AAON | | Building Materials | 85.24 | 36 | -1.23% | -3.15% |
| JBT | John Bean | | Machinery | 89.71 | 10 | -0.52% | -3.15% |
| IR | Ingersoll Rand | | Machinery | 88.97 | 26 | -0.67% | -3.21% |
| AZZ | AZZ | | Machinery | 75.48 | 31 | -0.17% | -3.21% |
| PNR | Pentair | | Equipment | 78.48 | 26 | -0.88% | -3.23% |
| TILE | Interface | | Textile Industrial | 14.93 | 36 | 0.34% | -3.24% |
| PSN | Parsons | | Machinery | 77.80 | 41 | -0.97% | -3.25% |
| HLMN | Hillman | | Tools & Accessories | 9.52 | 48 | 1.28% | -3.25% |
| For chart view version of above stock list: Chart View ➞ 0 - 25 , 25 - 50 , 50 - 75 , 75 - 100 , 100 - 125 , 125 - 150 , 150 - 175 , 175 - 200 , 200 - 225 , 225 - 250 , 250 - 275 , 275 - 300 | ||
 | Click To Change The Sort Order: By Market Cap or Company Size Performance: Year-to-date, Week and Day |  |
|
Get the most comprehensive stock market coverage daily at 12Stocks.com ➞ Best Stocks Today ➞ Best Stocks Weekly ➞ Best Stocks Year-to-Date ➞ Best Stocks Trends ➞  Best Stocks Today 12Stocks.com Best Nasdaq Stocks ➞ Best S&P 500 Stocks ➞ Best Tech Stocks ➞ Best Biotech Stocks ➞ |
| Detailed Overview of Industrial Stocks |
| Industrial Technical Overview, Leaders & Laggards, Top Industrial ETF Funds & Detailed Industrial Stocks List, Charts, Trends & More |
| Industrial Sector: Technical Analysis, Trends & YTD Performance | |
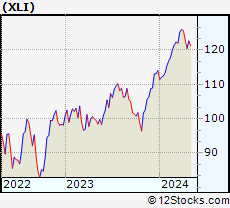
| Industrial sector is composed of stocks
from industrial machinery, aerospace, defense, farm/construction
and industrial services subsectors. Industrial sector, as represented by XLI, an exchange-traded fund [ETF] that holds basket of Industrial stocks (e.g, Caterpillar, Boeing) is up by 5.88% and is currently outperforming the overall market by 1.69% year-to-date. Below is a quick view of Technical charts and trends: |
|
 XLI Weekly Chart |
|
| Long Term Trend: Good | |
| Medium Term Trend: Not Good | |
 XLI Daily Chart |
|
| Short Term Trend: Not Good | |
| Overall Trend Score: 31 | |
| YTD Performance: 5.88% | |
| **Trend Scores & Views Are Only For Educational Purposes And Not For Investing | |
| 12Stocks.com: Top Performing Industrial Sector Stocks | ||||||||||||||||||||||||||||||||||||||||||||||||
 The top performing Industrial sector stocks year to date are
Now, more recently, over last week, the top performing Industrial sector stocks on the move are


|
||||||||||||||||||||||||||||||||||||||||||||||||
| 12Stocks.com: Investing in Industrial Sector using Exchange Traded Funds | |
|
The following table shows list of key exchange traded funds (ETF) that
help investors track Industrial Index. For detailed view, check out our ETF Funds section of our website. Quick View: Move mouse or cursor over ETF symbol (ticker) to view short-term Technical chart and over ETF name to view long term chart. Click on ticker or stock name for detailed view. Click on to add stock symbol to your watchlist and to view watchlist. |
12Stocks.com List of ETFs that track Industrial Index
| Ticker | ETF Name | Watchlist | Recent Price | Smart Investing & Trading Score | Change % | Week % | Year-to-date % |
| XLI | Industrial | | 120.69 | 31 | -0.35 | -1.8 | 5.88% |
| UXI | Industrials | | 31.66 | 31 | -0.38 | -3.67 | 9.95% |
| PPA | Aerospace & Defense | | 98.11 | 56 | -0.17 | -0.98 | 6.46% |
| ITA | Aerospace & Defense | | 127.46 | 51 | -0.04 | -0.2 | 0.68% |
| ITB | Home Construction | | 103.00 | 43 | 0.07 | -3.97 | 1.25% |
| XHB | Homebuilders | | 100.70 | 43 | -0.08 | -3.4 | 5.27% |
| SIJ | Short Industrials | | 10.23 | 64 | 0.94 | 4.22 | -9.79% |
| IYJ | Industrials | | 119.30 | 26 | -0.39 | -2 | 4.32% |
| EXI | Global Industrials | | 133.63 | 36 | -0.14 | -1.64 | 4.87% |
| VIS | Industrials | | 232.29 | 31 | -0.34 | -2.17 | 5.38% |
| PSCI | SmallCap Industrials | | 118.23 | 26 | -0.29 | -2.51 | 1.96% |
| XAR | Aerospace & Defense | | 132.10 | 51 | -0.01 | -1.23 | -2.45% |
| ARKQ | ARK Industrial Innovation | | 50.21 | 0 | -0.30 | -4.36 | -12.98% |
| 12Stocks.com: Charts, Trends, Fundamental Data and Performances of Industrial Stocks | |
|
We now take in-depth look at all Industrial stocks including charts, multi-period performances and overall trends (as measured by Smart Investing & Trading Score). One can sort Industrial stocks (click link to choose) by Daily, Weekly and by Year-to-Date performances. Also, one can sort by size of the company or by market capitalization. |
| Select Your Default Chart Type: | |||||
| |||||
| Click on stock symbol or name for detailed view. Click on to add stock symbol to your watchlist and to view watchlist. Quick View: Move mouse or cursor over "Daily" to quickly view daily Technical stock chart and over "Weekly" to view weekly Technical stock chart. | |||||

 | EVLV Evolv Technologies Holdings, Inc. |
| Sector: Industrials | |
| SubSector: Security & Protection Services | |
| MarketCap: 853 Millions | |
| Recent Price: 3.94 Smart Investing & Trading Score: 46 | |
| Day Percent Change: 2.34% Day Change: 0.09 | |
| Week Change: -2.72% Year-to-date Change: -16.5% | |
| EVLV Links: Profile News Message Board | |
| Charts:- Daily , Weekly | |
| Add EVLV to Watchlist: View: Get Complete EVLV Trend Analysis ➞ | |
 | AGCO AGCO Corporation |
| Sector: Industrials | |
| SubSector: Farm & Construction Machinery | |
| MarketCap: 3399.57 Millions | |
| Recent Price: 116.73 Smart Investing & Trading Score: 17 | |
| Day Percent Change: 0.42% Day Change: 0.49 | |
| Week Change: -2.73% Year-to-date Change: -3.9% | |
| AGCO Links: Profile News Message Board | |
| Charts:- Daily , Weekly | |
| Add AGCO to Watchlist: View: Get Complete AGCO Trend Analysis ➞ | |
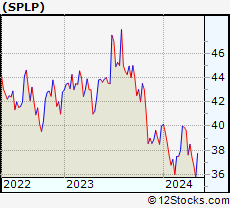 | SPLP Steel Partners Holdings L.P. |
| Sector: Industrials | |
| SubSector: Conglomerates | |
| MarketCap: 167.148 Millions | |
| Recent Price: 37.44 Smart Investing & Trading Score: 36 | |
| Day Percent Change: 0.00% Day Change: 0.00 | |
| Week Change: -2.75% Year-to-date Change: -6.4% | |
| SPLP Links: Profile News Message Board | |
| Charts:- Daily , Weekly | |
| Add SPLP to Watchlist: View: Get Complete SPLP Trend Analysis ➞ | |
 | ITT ITT Inc. |
| Sector: Industrials | |
| SubSector: Diversified Machinery | |
| MarketCap: 3783.06 Millions | |
| Recent Price: 125.15 Smart Investing & Trading Score: 36 | |
| Day Percent Change: 0.02% Day Change: 0.03 | |
| Week Change: -2.79% Year-to-date Change: 4.9% | |
| ITT Links: Profile News Message Board | |
| Charts:- Daily , Weekly | |
| Add ITT to Watchlist: View: Get Complete ITT Trend Analysis ➞ | |
 | IEX IDEX Corporation |
| Sector: Industrials | |
| SubSector: Diversified Machinery | |
| MarketCap: 9721.46 Millions | |
| Recent Price: 226.10 Smart Investing & Trading Score: 36 | |
| Day Percent Change: -0.32% Day Change: -0.73 | |
| Week Change: -2.82% Year-to-date Change: 4.1% | |
| IEX Links: Profile News Message Board | |
| Charts:- Daily , Weekly | |
| Add IEX to Watchlist: View: Get Complete IEX Trend Analysis ➞ | |
 | AWI Armstrong World Industries, Inc. |
| Sector: Industrials | |
| SubSector: General Building Materials | |
| MarketCap: 3609.53 Millions | |
| Recent Price: 113.85 Smart Investing & Trading Score: 36 | |
| Day Percent Change: -0.73% Day Change: -0.84 | |
| Week Change: -2.85% Year-to-date Change: 15.8% | |
| AWI Links: Profile News Message Board | |
| Charts:- Daily , Weekly | |
| Add AWI to Watchlist: View: Get Complete AWI Trend Analysis ➞ | |
 | VMC Vulcan Materials Company |
| Sector: Industrials | |
| SubSector: General Building Materials | |
| MarketCap: 12304.7 Millions | |
| Recent Price: 255.07 Smart Investing & Trading Score: 26 | |
| Day Percent Change: -1.24% Day Change: -3.19 | |
| Week Change: -2.93% Year-to-date Change: 12.4% | |
| VMC Links: Profile News Message Board | |
| Charts:- Daily , Weekly | |
| Add VMC to Watchlist: View: Get Complete VMC Trend Analysis ➞ | |
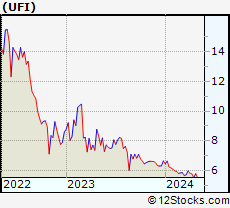 | UFI Unifi, Inc. |
| Sector: Industrials | |
| SubSector: Textile Industrial | |
| MarketCap: 165.04 Millions | |
| Recent Price: 5.62 Smart Investing & Trading Score: 10 | |
| Day Percent Change: -0.18% Day Change: -0.01 | |
| Week Change: -2.94% Year-to-date Change: -15.6% | |
| UFI Links: Profile News Message Board | |
| Charts:- Daily , Weekly | |
| Add UFI to Watchlist: View: Get Complete UFI Trend Analysis ➞ | |
 | RKLB Rocket Lab USA, Inc. |
| Sector: Industrials | |
| SubSector: Aerospace & Defense | |
| MarketCap: 2820 Millions | |
| Recent Price: 3.62 Smart Investing & Trading Score: 42 | |
| Day Percent Change: 1.54% Day Change: 0.06 | |
| Week Change: -2.95% Year-to-date Change: -34.3% | |
| RKLB Links: Profile News Message Board | |
| Charts:- Daily , Weekly | |
| Add RKLB to Watchlist: View: Get Complete RKLB Trend Analysis ➞ | |
 | EMR Emerson Electric Co. |
| Sector: Industrials | |
| SubSector: Industrial Electrical Equipment | |
| MarketCap: 30457.9 Millions | |
| Recent Price: 109.31 Smart Investing & Trading Score: 36 | |
| Day Percent Change: -0.46% Day Change: -0.50 | |
| Week Change: -2.96% Year-to-date Change: 12.3% | |
| EMR Links: Profile News Message Board | |
| Charts:- Daily , Weekly | |
| Add EMR to Watchlist: View: Get Complete EMR Trend Analysis ➞ | |
 | CLH Clean Harbors, Inc. |
| Sector: Industrials | |
| SubSector: Waste Management | |
| MarketCap: 2391.28 Millions | |
| Recent Price: 190.90 Smart Investing & Trading Score: 26 | |
| Day Percent Change: -0.46% Day Change: -0.88 | |
| Week Change: -2.98% Year-to-date Change: 9.4% | |
| CLH Links: Profile News Message Board | |
| Charts:- Daily , Weekly | |
| Add CLH to Watchlist: View: Get Complete CLH Trend Analysis ➞ | |
 | GVA Granite Construction Incorporated |
| Sector: Industrials | |
| SubSector: Heavy Construction | |
| MarketCap: 725.895 Millions | |
| Recent Price: 53.68 Smart Investing & Trading Score: 41 | |
| Day Percent Change: -0.26% Day Change: -0.14 | |
| Week Change: -3% Year-to-date Change: 5.5% | |
| GVA Links: Profile News Message Board | |
| Charts:- Daily , Weekly | |
| Add GVA to Watchlist: View: Get Complete GVA Trend Analysis ➞ | |
 | ETN Eaton Corporation plc |
| Sector: Industrials | |
| SubSector: Diversified Machinery | |
| MarketCap: 29829.4 Millions | |
| Recent Price: 308.94 Smart Investing & Trading Score: 36 | |
| Day Percent Change: -0.40% Day Change: -1.24 | |
| Week Change: -3% Year-to-date Change: 28.3% | |
| ETN Links: Profile News Message Board | |
| Charts:- Daily , Weekly | |
| Add ETN to Watchlist: View: Get Complete ETN Trend Analysis ➞ | |
 | CWST Casella Waste Systems, Inc. |
| Sector: Industrials | |
| SubSector: Waste Management | |
| MarketCap: 2093.38 Millions | |
| Recent Price: 92.37 Smart Investing & Trading Score: 36 | |
| Day Percent Change: -0.09% Day Change: -0.08 | |
| Week Change: -3.01% Year-to-date Change: 8.1% | |
| CWST Links: Profile News Message Board | |
| Charts:- Daily , Weekly | |
| Add CWST to Watchlist: View: Get Complete CWST Trend Analysis ➞ | |
 | TS Tenaris S.A. |
| Sector: Industrials | |
| SubSector: Metal Fabrication | |
| MarketCap: 7426.8 Millions | |
| Recent Price: 37.37 Smart Investing & Trading Score: 31 | |
| Day Percent Change: -1.92% Day Change: -0.73 | |
| Week Change: -3.01% Year-to-date Change: 7.5% | |
| TS Links: Profile News Message Board | |
| Charts:- Daily , Weekly | |
| Add TS to Watchlist: View: Get Complete TS Trend Analysis ➞ | |
 | OC Owens Corning |
| Sector: Industrials | |
| SubSector: General Building Materials | |
| MarketCap: 3686.73 Millions | |
| Recent Price: 160.52 Smart Investing & Trading Score: 26 | |
| Day Percent Change: -1.46% Day Change: -2.38 | |
| Week Change: -3.01% Year-to-date Change: 8.3% | |
| OC Links: Profile News Message Board | |
| Charts:- Daily , Weekly | |
| Add OC to Watchlist: View: Get Complete OC Trend Analysis ➞ | |
 | MIDD The Middleby Corporation |
| Sector: Industrials | |
| SubSector: Diversified Machinery | |
| MarketCap: 3070.36 Millions | |
| Recent Price: 141.01 Smart Investing & Trading Score: 23 | |
| Day Percent Change: -0.18% Day Change: -0.26 | |
| Week Change: -3.03% Year-to-date Change: -4.2% | |
| MIDD Links: Profile News Message Board | |
| Charts:- Daily , Weekly | |
| Add MIDD to Watchlist: View: Get Complete MIDD Trend Analysis ➞ | |
 | AAON AAON, Inc. |
| Sector: Industrials | |
| SubSector: General Building Materials | |
| MarketCap: 2533.63 Millions | |
| Recent Price: 85.24 Smart Investing & Trading Score: 36 | |
| Day Percent Change: -1.23% Day Change: -1.06 | |
| Week Change: -3.15% Year-to-date Change: 15.4% | |
| AAON Links: Profile News Message Board | |
| Charts:- Daily , Weekly | |
| Add AAON to Watchlist: View: Get Complete AAON Trend Analysis ➞ | |
 | JBT John Bean Technologies Corporation |
| Sector: Industrials | |
| SubSector: Diversified Machinery | |
| MarketCap: 2197.36 Millions | |
| Recent Price: 89.71 Smart Investing & Trading Score: 10 | |
| Day Percent Change: -0.52% Day Change: -0.47 | |
| Week Change: -3.15% Year-to-date Change: -9.8% | |
| JBT Links: Profile News Message Board | |
| Charts:- Daily , Weekly | |
| Add JBT to Watchlist: View: Get Complete JBT Trend Analysis ➞ | |
 | IR Ingersoll Rand Inc. |
| Sector: Industrials | |
| SubSector: Diversified Machinery | |
| MarketCap: 8970.56 Millions | |
| Recent Price: 88.97 Smart Investing & Trading Score: 26 | |
| Day Percent Change: -0.67% Day Change: -0.60 | |
| Week Change: -3.21% Year-to-date Change: 15.0% | |
| IR Links: Profile News Message Board | |
| Charts:- Daily , Weekly | |
| Add IR to Watchlist: View: Get Complete IR Trend Analysis ➞ | |
 | AZZ AZZ Inc. |
| Sector: Industrials | |
| SubSector: Diversified Machinery | |
| MarketCap: 743.416 Millions | |
| Recent Price: 75.48 Smart Investing & Trading Score: 31 | |
| Day Percent Change: -0.17% Day Change: -0.13 | |
| Week Change: -3.21% Year-to-date Change: 29.9% | |
| AZZ Links: Profile News Message Board | |
| Charts:- Daily , Weekly | |
| Add AZZ to Watchlist: View: Get Complete AZZ Trend Analysis ➞ | |
 | PNR Pentair plc |
| Sector: Industrials | |
| SubSector: Industrial Equipment & Components | |
| MarketCap: 4326.59 Millions | |
| Recent Price: 78.48 Smart Investing & Trading Score: 26 | |
| Day Percent Change: -0.88% Day Change: -0.70 | |
| Week Change: -3.23% Year-to-date Change: 7.9% | |
| PNR Links: Profile News Message Board | |
| Charts:- Daily , Weekly | |
| Add PNR to Watchlist: View: Get Complete PNR Trend Analysis ➞ | |
 | TILE Interface, Inc. |
| Sector: Industrials | |
| SubSector: Textile Industrial | |
| MarketCap: 478 Millions | |
| Recent Price: 14.93 Smart Investing & Trading Score: 36 | |
| Day Percent Change: 0.34% Day Change: 0.05 | |
| Week Change: -3.24% Year-to-date Change: 18.3% | |
| TILE Links: Profile News Message Board | |
| Charts:- Daily , Weekly | |
| Add TILE to Watchlist: View: Get Complete TILE Trend Analysis ➞ | |
 | PSN Parsons Corporation |
| Sector: Industrials | |
| SubSector: Diversified Machinery | |
| MarketCap: 3021.16 Millions | |
| Recent Price: 77.80 Smart Investing & Trading Score: 41 | |
| Day Percent Change: -0.97% Day Change: -0.76 | |
| Week Change: -3.25% Year-to-date Change: 24.1% | |
| PSN Links: Profile News Message Board | |
| Charts:- Daily , Weekly | |
| Add PSN to Watchlist: View: Get Complete PSN Trend Analysis ➞ | |
 | HLMN Hillman Solutions Corp. |
| Sector: Industrials | |
| SubSector: Tools & Accessories | |
| MarketCap: 1720 Millions | |
| Recent Price: 9.52 Smart Investing & Trading Score: 48 | |
| Day Percent Change: 1.28% Day Change: 0.12 | |
| Week Change: -3.25% Year-to-date Change: 3.0% | |
| HLMN Links: Profile News Message Board | |
| Charts:- Daily , Weekly | |
| Add HLMN to Watchlist: View: Get Complete HLMN Trend Analysis ➞ | |
| For tabular summary view of above stock list: Summary View ➞ 0 - 25 , 25 - 50 , 50 - 75 , 75 - 100 , 100 - 125 , 125 - 150 , 150 - 175 , 175 - 200 , 200 - 225 , 225 - 250 , 250 - 275 , 275 - 300 | ||
| Click To Change The Sort Order: By Market Cap or Company Size Performance: Year-to-date, Week and Day | |
| Select Chart Type: | ||
|
Best Stocks Today 12Stocks.com |
© 2024 12Stocks.com Terms & Conditions Privacy Contact Us
All Information Provided Only For Education And Not To Be Used For Investing or Trading. See Terms & Conditions


One More Thing ... Get Best Stocks Delivered Daily!
Never Ever Miss A Move With Our Top Ten Stocks Lists
Find Best Stocks In Any Market - Bull or Bear Market
Take A Peek At Our Top Ten Stocks Lists: Daily, Weekly, Year-to-Date & Top Trends
Find Best Stocks In Any Market - Bull or Bear Market
Take A Peek At Our Top Ten Stocks Lists: Daily, Weekly, Year-to-Date & Top Trends
Industrial Stocks With Best Up Trends [0-bearish to 100-bullish]: VCI Global[100], Argan [95], HEICO [95], Apogee Enterprises[93], Generac [93], Carpenter Technology[93], AAR [90], ADS-TEC Energy[90], Lockheed Martin[85], System1 [83], L.S. Starrett[83]
Best Industrial Stocks Year-to-Date:
Tritium DCFC[1502.54%], Intuitive Machines[111.93%], Kaman [92.03%], FTAI Infrastructure[72.11%], EMCOR [55.99%], Masonite [55.2%], NuScale Power[54.57%], ADS-TEC Energy[51.47%], TDCX [48.18%], Graham [47.5%], Tutor Perini[47.03%] Best Industrial Stocks This Week:
EHang [8.29%], Frontier [6.62%], MingZhu Logistics[6.5%], Sun Country[5.82%], NET Power[5.42%], Apogee Enterprises[5%], Mueller Water[4.75%], FTAI Infrastructure[4.12%], ADS-TEC Energy[3.85%], AAR [3.68%], TPI Composites[3.07%] Best Industrial Stocks Daily:
Montrose Environmental[12.84%], MingZhu Logistics[9.54%], Barnes [8.06%], Apogee Enterprises[7.01%], Amprius Technologies[6.07%], VCI Global[5.73%], EHang [5.66%], System1 [5.14%], BiomX [4.86%], Redwire [4.69%], Planet Labs[4.57%]