
 Login Sign Up


| |||||
 |  | ||||

| 12Stocks.com Market Intelligence |
Best Industrial Stocks
| In a hurry? Industrial Stocks Lists: Performance Trends Table, Stock Charts
Sort Industrial stocks: Daily, Weekly, Year-to-Date, Market Cap & Trends. Filter Industrial stocks list by size:All Industrial Large Mid-Range Small |
| 12Stocks.com Industrial Stocks Performances & Trends Daily | |||||||||
|
|  The overall Smart Investing & Trading Score is 41 (0-bearish to 100-bullish) which puts Industrial sector in short term neutral trend. The Smart Investing & Trading Score from previous trading session is 31 and hence an improvement of trend.
| ||||||||
Here are the Smart Investing & Trading Scores of the most requested Industrial stocks at 12Stocks.com (click stock name for detailed review):
|


| 12Stocks.com: Investing in Industrial sector with Stocks | |
|
The following table helps investors and traders sort through current performance and trends (as measured by Smart Investing & Trading Score) of various
stocks in the Industrial sector. Quick View: Move mouse or cursor over stock symbol (ticker) to view short-term Technical chart and over stock name to view long term chart. Click on  to add stock symbol to your watchlist and to add stock symbol to your watchlist and  to view watchlist. Click on any ticker or stock name for detailed market intelligence report for that stock. to view watchlist. Click on any ticker or stock name for detailed market intelligence report for that stock. |
12Stocks.com Performance of Stocks in Industrial Sector
| Ticker | Stock Name | Watchlist | Category | Recent Price | Smart Investing & Trading Score | Change % | Weekly Change% |
| TKR | Timken |   | Machine Tools | 84.19 | 43 | 0.43% | -0.72% |
| SRCL | Stericycle | | Waste Mgmt | 48.90 | 36 | 0.41% | -0.73% |
| XYL | Xylem | | Machinery | 127.16 | 68 | 0.74% | -0.74% |
| CSWI | CSW s | | Machinery | 234.23 | 63 | 0.77% | -0.76% |
| ENS | EnerSys | | Electrical Equipment | 90.20 | 25 | 0.87% | -0.78% |
| NOC | Northrop Grumman | | Aerospace/Defense | 452.50 | 51 | 0.10% | -0.79% |
| FELE | Franklin Electric | | Electrical Equipment | 100.60 | 68 | 0.41% | -0.81% |
| EPAC | Enerpac Tool | | Machinery | 34.75 | 36 | 0.00% | -0.83% |
| VCIG | VCI Global | | Consulting | 1.20 | 90 | 5.73% | -0.83% |
| GD | General Dynamics | | Aerospace/Defense | 285.27 | 76 | 0.28% | -0.90% |
| ATI | Allegheny Technologies | | Fabrication | 51.10 | 58 | 0.73% | -1.05% |
| GE | General Electric | | Machinery | 152.94 | 51 | -1.75% | -1.09% |
| CMPO | CompoSecure | | Fabrication | 6.55 | 53 | 2.26% | -1.13% |
| BWXT | BWX Technologies | | Aerospace/Defense | 93.48 | 44 | 0.61% | -1.14% |
| GFL | GFL Environmental | | Waste Mgmt | 33.02 | 0 | -0.51% | -1.14% |
| FTAIN | FTAI Aviation | | Rental & Leasing | 24.75 | 8 | -0.56% | -1.15% |
| CNM | Core & Main | | Industrial Distribution | 55.60 | 68 | 1.52% | -1.30% |
| AME | AMETEK | | Machinery | 177.27 | 26 | -0.44% | -1.36% |
| GWH | ESS Tech | | Electrical Equipment & Parts | 0.66 | 47 | -0.12% | -1.37% |
| ASTE | Astec Industries | | Machinery | 41.88 | 61 | 0.36% | -1.44% |
| TTC | Toro | | Small Tools & Accessories | 84.51 | 0 | 0.27% | -1.47% |
| TXT | Textron | | Aerospace/Defense | 92.58 | 49 | 0.40% | -1.47% |
| NVR | NVR | | Residential | 7702.26 | 56 | 0.42% | -1.48% |
| GTES | Gates | | Machinery | 17.18 | 46 | -0.52% | -1.49% |
| DHR | Danaher | | Machinery | 236.36 | 0 | -1.27% | -1.50% |
| For chart view version of above stock list: Chart View ➞ 0 - 25 , 25 - 50 , 50 - 75 , 75 - 100 , 100 - 125 , 125 - 150 , 150 - 175 , 175 - 200 , 200 - 225 , 225 - 250 , 250 - 275 , 275 - 300 | ||
 | Click To Change The Sort Order: By Market Cap or Company Size Performance: Year-to-date, Week and Day |  |
|
Get the most comprehensive stock market coverage daily at 12Stocks.com ➞ Best Stocks Today ➞ Best Stocks Weekly ➞ Best Stocks Year-to-Date ➞ Best Stocks Trends ➞  Best Stocks Today 12Stocks.com Best Nasdaq Stocks ➞ Best S&P 500 Stocks ➞ Best Tech Stocks ➞ Best Biotech Stocks ➞ |
| Detailed Overview of Industrial Stocks |
| Industrial Technical Overview, Leaders & Laggards, Top Industrial ETF Funds & Detailed Industrial Stocks List, Charts, Trends & More |
| Industrial Sector: Technical Analysis, Trends & YTD Performance | |
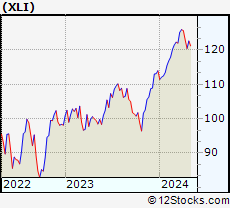
| Industrial sector is composed of stocks
from industrial machinery, aerospace, defense, farm/construction
and industrial services subsectors. Industrial sector, as represented by XLI, an exchange-traded fund [ETF] that holds basket of Industrial stocks (e.g, Caterpillar, Boeing) is up by 5.88% and is currently outperforming the overall market by 1.69% year-to-date. Below is a quick view of Technical charts and trends: |
|
 XLI Weekly Chart |
|
| Long Term Trend: Good | |
| Medium Term Trend: Not Good | |
 XLI Daily Chart |
|
| Short Term Trend: Not Good | |
| Overall Trend Score: 41 | |
| YTD Performance: 5.88% | |
| **Trend Scores & Views Are Only For Educational Purposes And Not For Investing | |
| 12Stocks.com: Top Performing Industrial Sector Stocks | ||||||||||||||||||||||||||||||||||||||||||||||||
 The top performing Industrial sector stocks year to date are
Now, more recently, over last week, the top performing Industrial sector stocks on the move are


|
||||||||||||||||||||||||||||||||||||||||||||||||
| 12Stocks.com: Investing in Industrial Sector using Exchange Traded Funds | |
|
The following table shows list of key exchange traded funds (ETF) that
help investors track Industrial Index. For detailed view, check out our ETF Funds section of our website. Quick View: Move mouse or cursor over ETF symbol (ticker) to view short-term Technical chart and over ETF name to view long term chart. Click on ticker or stock name for detailed view. Click on to add stock symbol to your watchlist and to view watchlist. |
12Stocks.com List of ETFs that track Industrial Index
| Ticker | ETF Name | Watchlist | Recent Price | Smart Investing & Trading Score | Change % | Week % | Year-to-date % |
| XLI | Industrial | | 120.69 | 41 | -0.35 | -1.8 | 5.88% |
| UXI | Industrials | | 31.66 | 41 | -0.38 | -3.67 | 9.95% |
| PPA | Aerospace & Defense | | 98.11 | 56 | -0.17 | -0.98 | 6.46% |
| ITA | Aerospace & Defense | | 127.46 | 51 | -0.04 | -0.2 | 0.68% |
| ITB | Home Construction | | 103.00 | 43 | 0.07 | -3.97 | 1.25% |
| XHB | Homebuilders | | 100.70 | 43 | -0.08 | -3.4 | 5.27% |
| SIJ | Short Industrials | | 10.22 | 64 | 0.79 | 4.07 | -9.92% |
| IYJ | Industrials | | 119.30 | 41 | -0.39 | -2 | 4.32% |
| EXI | Global Industrials | | 133.64 | 36 | -0.13 | -1.63 | 4.87% |
| VIS | Industrials | | 232.29 | 41 | -0.34 | -2.17 | 5.38% |
| PSCI | SmallCap Industrials | | 118.46 | 36 | -0.09 | -2.32 | 2.16% |
| XAR | Aerospace & Defense | | 132.10 | 51 | -0.01 | -1.23 | -2.45% |
| ARKQ | ARK Industrial Innovation | | 50.21 | 10 | -0.30 | -4.36 | -12.98% |
| 12Stocks.com: Charts, Trends, Fundamental Data and Performances of Industrial Stocks | |
|
We now take in-depth look at all Industrial stocks including charts, multi-period performances and overall trends (as measured by Smart Investing & Trading Score). One can sort Industrial stocks (click link to choose) by Daily, Weekly and by Year-to-Date performances. Also, one can sort by size of the company or by market capitalization. |
| Select Your Default Chart Type: | |||||
| |||||
| Click on stock symbol or name for detailed view. Click on to add stock symbol to your watchlist and to view watchlist. Quick View: Move mouse or cursor over "Daily" to quickly view daily Technical stock chart and over "Weekly" to view weekly Technical stock chart. | |||||

 | TKR The Timken Company |
| Sector: Industrials | |
| SubSector: Machine Tools & Accessories | |
| MarketCap: 2277.48 Millions | |
| Recent Price: 84.19 Smart Investing & Trading Score: 43 | |
| Day Percent Change: 0.43% Day Change: 0.36 | |
| Week Change: -0.72% Year-to-date Change: 5.0% | |
| TKR Links: Profile News Message Board | |
| Charts:- Daily , Weekly | |
| Add TKR to Watchlist: View: Get Complete TKR Trend Analysis ➞ | |
 | SRCL Stericycle, Inc. |
| Sector: Industrials | |
| SubSector: Waste Management | |
| MarketCap: 4285.78 Millions | |
| Recent Price: 48.90 Smart Investing & Trading Score: 36 | |
| Day Percent Change: 0.41% Day Change: 0.20 | |
| Week Change: -0.73% Year-to-date Change: -1.3% | |
| SRCL Links: Profile News Message Board | |
| Charts:- Daily , Weekly | |
| Add SRCL to Watchlist: View: Get Complete SRCL Trend Analysis ➞ | |
 | XYL Xylem Inc. |
| Sector: Industrials | |
| SubSector: Diversified Machinery | |
| MarketCap: 12195.1 Millions | |
| Recent Price: 127.16 Smart Investing & Trading Score: 68 | |
| Day Percent Change: 0.74% Day Change: 0.94 | |
| Week Change: -0.74% Year-to-date Change: 11.2% | |
| XYL Links: Profile News Message Board | |
| Charts:- Daily , Weekly | |
| Add XYL to Watchlist: View: Get Complete XYL Trend Analysis ➞ | |
 | CSWI CSW Industrials, Inc. |
| Sector: Industrials | |
| SubSector: Diversified Machinery | |
| MarketCap: 985.616 Millions | |
| Recent Price: 234.23 Smart Investing & Trading Score: 63 | |
| Day Percent Change: 0.77% Day Change: 1.80 | |
| Week Change: -0.76% Year-to-date Change: 12.9% | |
| CSWI Links: Profile News Message Board | |
| Charts:- Daily , Weekly | |
| Add CSWI to Watchlist: View: Get Complete CSWI Trend Analysis ➞ | |
 | ENS EnerSys |
| Sector: Industrials | |
| SubSector: Industrial Electrical Equipment | |
| MarketCap: 2068.79 Millions | |
| Recent Price: 90.20 Smart Investing & Trading Score: 25 | |
| Day Percent Change: 0.87% Day Change: 0.78 | |
| Week Change: -0.78% Year-to-date Change: -10.7% | |
| ENS Links: Profile News Message Board | |
| Charts:- Daily , Weekly | |
| Add ENS to Watchlist: View: Get Complete ENS Trend Analysis ➞ | |
 | NOC Northrop Grumman Corporation |
| Sector: Industrials | |
| SubSector: Aerospace/Defense - Major Diversified | |
| MarketCap: 52094.9 Millions | |
| Recent Price: 452.50 Smart Investing & Trading Score: 51 | |
| Day Percent Change: 0.10% Day Change: 0.45 | |
| Week Change: -0.79% Year-to-date Change: -3.3% | |
| NOC Links: Profile News Message Board | |
| Charts:- Daily , Weekly | |
| Add NOC to Watchlist: View: Get Complete NOC Trend Analysis ➞ | |
 | FELE Franklin Electric Co., Inc. |
| Sector: Industrials | |
| SubSector: Industrial Electrical Equipment | |
| MarketCap: 2397.89 Millions | |
| Recent Price: 100.60 Smart Investing & Trading Score: 68 | |
| Day Percent Change: 0.41% Day Change: 0.41 | |
| Week Change: -0.81% Year-to-date Change: 4.1% | |
| FELE Links: Profile News Message Board | |
| Charts:- Daily , Weekly | |
| Add FELE to Watchlist: View: Get Complete FELE Trend Analysis ➞ | |
 | EPAC Enerpac Tool Group Corp. |
| Sector: Industrials | |
| SubSector: Diversified Machinery | |
| MarketCap: 1044.16 Millions | |
| Recent Price: 34.75 Smart Investing & Trading Score: 36 | |
| Day Percent Change: 0.00% Day Change: 0.00 | |
| Week Change: -0.83% Year-to-date Change: 11.8% | |
| EPAC Links: Profile News Message Board | |
| Charts:- Daily , Weekly | |
| Add EPAC to Watchlist: View: Get Complete EPAC Trend Analysis ➞ | |
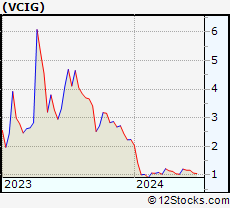 | VCIG VCI Global Limited |
| Sector: Industrials | |
| SubSector: Consulting Services | |
| MarketCap: 197 Millions | |
| Recent Price: 1.20 Smart Investing & Trading Score: 90 | |
| Day Percent Change: 5.73% Day Change: 0.06 | |
| Week Change: -0.83% Year-to-date Change: -46.4% | |
| VCIG Links: Profile News Message Board | |
| Charts:- Daily , Weekly | |
| Add VCIG to Watchlist: View: Get Complete VCIG Trend Analysis ➞ | |
 | GD General Dynamics Corporation |
| Sector: Industrials | |
| SubSector: Aerospace/Defense Products & Services | |
| MarketCap: 37063.8 Millions | |
| Recent Price: 285.27 Smart Investing & Trading Score: 76 | |
| Day Percent Change: 0.28% Day Change: 0.81 | |
| Week Change: -0.9% Year-to-date Change: 9.9% | |
| GD Links: Profile News Message Board | |
| Charts:- Daily , Weekly | |
| Add GD to Watchlist: View: Get Complete GD Trend Analysis ➞ | |
 | ATI Allegheny Technologies Incorporated |
| Sector: Industrials | |
| SubSector: Metal Fabrication | |
| MarketCap: 913.35 Millions | |
| Recent Price: 51.10 Smart Investing & Trading Score: 58 | |
| Day Percent Change: 0.73% Day Change: 0.37 | |
| Week Change: -1.05% Year-to-date Change: 12.4% | |
| ATI Links: Profile News Message Board | |
| Charts:- Daily , Weekly | |
| Add ATI to Watchlist: View: Get Complete ATI Trend Analysis ➞ | |
 | GE General Electric Company |
| Sector: Industrials | |
| SubSector: Diversified Machinery | |
| MarketCap: 64710.6 Millions | |
| Recent Price: 152.94 Smart Investing & Trading Score: 51 | |
| Day Percent Change: -1.75% Day Change: -2.73 | |
| Week Change: -1.09% Year-to-date Change: 19.8% | |
| GE Links: Profile News Message Board | |
| Charts:- Daily , Weekly | |
| Add GE to Watchlist: View: Get Complete GE Trend Analysis ➞ | |
 | CMPO CompoSecure, Inc. |
| Sector: Industrials | |
| SubSector: Metal Fabrication | |
| MarketCap: 535 Millions | |
| Recent Price: 6.55 Smart Investing & Trading Score: 53 | |
| Day Percent Change: 2.26% Day Change: 0.14 | |
| Week Change: -1.13% Year-to-date Change: 19.8% | |
| CMPO Links: Profile News Message Board | |
| Charts:- Daily , Weekly | |
| Add CMPO to Watchlist: View: Get Complete CMPO Trend Analysis ➞ | |
 | BWXT BWX Technologies, Inc. |
| Sector: Industrials | |
| SubSector: Aerospace/Defense Products & Services | |
| MarketCap: 4085.41 Millions | |
| Recent Price: 93.48 Smart Investing & Trading Score: 44 | |
| Day Percent Change: 0.61% Day Change: 0.57 | |
| Week Change: -1.14% Year-to-date Change: 21.8% | |
| BWXT Links: Profile News Message Board | |
| Charts:- Daily , Weekly | |
| Add BWXT to Watchlist: View: Get Complete BWXT Trend Analysis ➞ | |
 | GFL GFL Environmental Inc. |
| Sector: Industrials | |
| SubSector: Waste Management | |
| MarketCap: 87627 Millions | |
| Recent Price: 33.02 Smart Investing & Trading Score: 0 | |
| Day Percent Change: -0.51% Day Change: -0.17 | |
| Week Change: -1.14% Year-to-date Change: -4.3% | |
| GFL Links: Profile News Message Board | |
| Charts:- Daily , Weekly | |
| Add GFL to Watchlist: View: Get Complete GFL Trend Analysis ➞ | |
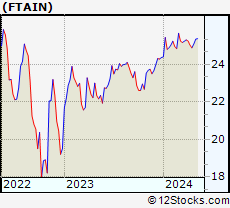 | FTAIN FTAI Aviation Ltd. |
| Sector: Industrials | |
| SubSector: Rental & Leasing Services | |
| MarketCap: 3160 Millions | |
| Recent Price: 24.75 Smart Investing & Trading Score: 8 | |
| Day Percent Change: -0.56% Day Change: -0.14 | |
| Week Change: -1.15% Year-to-date Change: 1.5% | |
| FTAIN Links: Profile News Message Board | |
| Charts:- Daily , Weekly | |
| Add FTAIN to Watchlist: View: Get Complete FTAIN Trend Analysis ➞ | |
 | CNM Core & Main, Inc. |
| Sector: Industrials | |
| SubSector: Industrial Distribution | |
| MarketCap: 7150 Millions | |
| Recent Price: 55.60 Smart Investing & Trading Score: 68 | |
| Day Percent Change: 1.52% Day Change: 0.83 | |
| Week Change: -1.3% Year-to-date Change: 37.2% | |
| CNM Links: Profile News Message Board | |
| Charts:- Daily , Weekly | |
| Add CNM to Watchlist: View: Get Complete CNM Trend Analysis ➞ | |
 | AME AMETEK, Inc. |
| Sector: Industrials | |
| SubSector: Diversified Machinery | |
| MarketCap: 16611.8 Millions | |
| Recent Price: 177.27 Smart Investing & Trading Score: 26 | |
| Day Percent Change: -0.44% Day Change: -0.78 | |
| Week Change: -1.36% Year-to-date Change: 7.5% | |
| AME Links: Profile News Message Board | |
| Charts:- Daily , Weekly | |
| Add AME to Watchlist: View: Get Complete AME Trend Analysis ➞ | |
 | GWH ESS Tech, Inc. |
| Sector: Industrials | |
| SubSector: Electrical Equipment & Parts | |
| MarketCap: 239 Millions | |
| Recent Price: 0.66 Smart Investing & Trading Score: 47 | |
| Day Percent Change: -0.12% Day Change: 0.00 | |
| Week Change: -1.37% Year-to-date Change: -42.0% | |
| GWH Links: Profile News Message Board | |
| Charts:- Daily , Weekly | |
| Add GWH to Watchlist: View: Get Complete GWH Trend Analysis ➞ | |
 | ASTE Astec Industries, Inc. |
| Sector: Industrials | |
| SubSector: Farm & Construction Machinery | |
| MarketCap: 731.607 Millions | |
| Recent Price: 41.88 Smart Investing & Trading Score: 61 | |
| Day Percent Change: 0.36% Day Change: 0.15 | |
| Week Change: -1.44% Year-to-date Change: 12.6% | |
| ASTE Links: Profile News Message Board | |
| Charts:- Daily , Weekly | |
| Add ASTE to Watchlist: View: Get Complete ASTE Trend Analysis ➞ | |
 | TTC The Toro Company |
| Sector: Industrials | |
| SubSector: Small Tools & Accessories | |
| MarketCap: 6426.96 Millions | |
| Recent Price: 84.51 Smart Investing & Trading Score: 0 | |
| Day Percent Change: 0.27% Day Change: 0.23 | |
| Week Change: -1.47% Year-to-date Change: -12.0% | |
| TTC Links: Profile News Message Board | |
| Charts:- Daily , Weekly | |
| Add TTC to Watchlist: View: Get Complete TTC Trend Analysis ➞ | |
 | TXT Textron Inc. |
| Sector: Industrials | |
| SubSector: Aerospace/Defense - Major Diversified | |
| MarketCap: 6123.09 Millions | |
| Recent Price: 92.58 Smart Investing & Trading Score: 49 | |
| Day Percent Change: 0.40% Day Change: 0.37 | |
| Week Change: -1.47% Year-to-date Change: 15.1% | |
| TXT Links: Profile News Message Board | |
| Charts:- Daily , Weekly | |
| Add TXT to Watchlist: View: Get Complete TXT Trend Analysis ➞ | |
 | NVR NVR, Inc. |
| Sector: Industrials | |
| SubSector: Residential Construction | |
| MarketCap: 9912.56 Millions | |
| Recent Price: 7702.26 Smart Investing & Trading Score: 56 | |
| Day Percent Change: 0.42% Day Change: 32.32 | |
| Week Change: -1.48% Year-to-date Change: 10.0% | |
| NVR Links: Profile News Message Board | |
| Charts:- Daily , Weekly | |
| Add NVR to Watchlist: View: Get Complete NVR Trend Analysis ➞ | |
 | GTES Gates Industrial Corporation plc |
| Sector: Industrials | |
| SubSector: Diversified Machinery | |
| MarketCap: 2152.36 Millions | |
| Recent Price: 17.18 Smart Investing & Trading Score: 46 | |
| Day Percent Change: -0.52% Day Change: -0.09 | |
| Week Change: -1.49% Year-to-date Change: 28.0% | |
| GTES Links: Profile News Message Board | |
| Charts:- Daily , Weekly | |
| Add GTES to Watchlist: View: Get Complete GTES Trend Analysis ➞ | |
 | DHR Danaher Corporation |
| Sector: Industrials | |
| SubSector: Diversified Machinery | |
| MarketCap: 93210.3 Millions | |
| Recent Price: 236.36 Smart Investing & Trading Score: 0 | |
| Day Percent Change: -1.27% Day Change: -3.03 | |
| Week Change: -1.5% Year-to-date Change: 2.2% | |
| DHR Links: Profile News Message Board | |
| Charts:- Daily , Weekly | |
| Add DHR to Watchlist: View: Get Complete DHR Trend Analysis ➞ | |
| For tabular summary view of above stock list: Summary View ➞ 0 - 25 , 25 - 50 , 50 - 75 , 75 - 100 , 100 - 125 , 125 - 150 , 150 - 175 , 175 - 200 , 200 - 225 , 225 - 250 , 250 - 275 , 275 - 300 | ||
| Click To Change The Sort Order: By Market Cap or Company Size Performance: Year-to-date, Week and Day | |
| Select Chart Type: | ||
|
Best Stocks Today 12Stocks.com |
© 2024 12Stocks.com Terms & Conditions Privacy Contact Us
All Information Provided Only For Education And Not To Be Used For Investing or Trading. See Terms & Conditions


One More Thing ... Get Best Stocks Delivered Daily!
Never Ever Miss A Move With Our Top Ten Stocks Lists
Find Best Stocks In Any Market - Bull or Bear Market
Take A Peek At Our Top Ten Stocks Lists: Daily, Weekly, Year-to-Date & Top Trends
Find Best Stocks In Any Market - Bull or Bear Market
Take A Peek At Our Top Ten Stocks Lists: Daily, Weekly, Year-to-Date & Top Trends
Industrial Stocks With Best Up Trends [0-bearish to 100-bullish]: HEICO [100], Argan [95], Apogee Enterprises[93], Generac [93], Carpenter Technology[93], Mueller Water[93], VCI Global[90], AAR [90], ADS-TEC Energy[90], Lockheed Martin[85], System1 [83]
Best Industrial Stocks Year-to-Date:
Tritium DCFC[1502.54%], Intuitive Machines[111.93%], Kaman [92.03%], FTAI Infrastructure[72.11%], EMCOR [55.99%], Masonite [55.2%], NuScale Power[54.57%], ADS-TEC Energy[51.47%], TDCX [48.18%], Graham [47.5%], Tutor Perini[47.03%] Best Industrial Stocks This Week:
EHang [8.41%], Frontier [6.62%], MingZhu Logistics[6.5%], Sun Country[5.82%], NET Power[5.42%], Apogee Enterprises[4.89%], Mueller Water[4.75%], FTAI Infrastructure[4.12%], ADS-TEC Energy[3.85%], AAR [3.68%], TPI Composites[3.07%] Best Industrial Stocks Daily:
Montrose Environmental[12.84%], MingZhu Logistics[9.54%], Barnes [8.06%], Apogee Enterprises[6.89%], Amprius Technologies[6.07%], EHang [5.78%], VCI Global[5.73%], System1 [5.14%], BiomX [4.86%], Redwire [4.69%], Planet Labs[4.57%]