
 Login Sign Up


| |||||
 |  | ||||

| 12Stocks.com Market Intelligence |
Best Consumer Services Stocks
| In a hurry? Services & Goods Stocks: Performance Trends Table, Stock Charts
Sort Consumer Services: Daily, Weekly, Year-to-Date, Market Cap & Trends. Filter Services & Goods stocks list by size: All Large Mid-Range Small |
| 12Stocks.com Consumer Services Stocks Performances & Trends Daily | |||||||||
|
|  The overall Smart Investing & Trading Score is 31 (0-bearish to 100-bullish) which puts Consumer Services sector in short term bearish to neutral trend. The Smart Investing & Trading Score from previous trading session is 58 and hence a deterioration of trend.
| ||||||||
Here are the Smart Investing & Trading Scores of the most requested Consumer Services stocks at 12Stocks.com (click stock name for detailed review):
|


| Consider signing up for our daily 12Stocks.com "Best Stocks Newsletter". You will never ever miss a big stock move again! |
| 12Stocks.com: Investing in Consumer Services sector with Stocks | |
|
The following table helps investors and traders sort through current performance and trends (as measured by Smart Investing & Trading Score) of various
stocks in the Consumer Services sector. Quick View: Move mouse or cursor over stock symbol (ticker) to view short-term Technical chart and over stock name to view long term chart. Click on  to add stock symbol to your watchlist and to add stock symbol to your watchlist and  to view watchlist. Click on any ticker or stock name for detailed market intelligence report for that stock. to view watchlist. Click on any ticker or stock name for detailed market intelligence report for that stock. |
12Stocks.com Performance of Stocks in Consumer Services Sector
| Ticker | Stock Name | Watchlist | Category | Recent Price | Smart Investing & Trading Score | Change % | Weekly Change% |
| KELYA | Kelly Services |   | Staffing | 23.61 | 63 | -2.54% | -0.40% |
| NGVC | Natural Grocers | | Grocery | 16.41 | 43 | 2.31% | -0.42% |
| ACEL | Accel Entertainment | | Gaming | 11.32 | 76 | -1.57% | -0.44% |
| SIX | Six Flags | | Entertainment | 23.34 | 25 | -2.10% | -0.47% |
| EVC | Entravision | | Broadcasting | 2.09 | 32 | 0.48% | -0.48% |
| ARCO | Arcos Dorados | | Restaurants | 10.85 | 32 | -0.78% | -0.50% |
| J | Jacobs Engineering | | Services | 143.03 | 41 | -0.66% | -0.56% |
| M | Macy s | | Department | 18.42 | 36 | -1.66% | -0.59% |
| WMK | Weis Markets | | Grocery | 64.11 | 93 | -0.37% | -0.60% |
| RH | RH | | Retail | 238.96 | 48 | -5.12% | -0.60% |
| NSP | Insperity | | Services | 107.69 | 67 | -1.68% | -0.61% |
| KFRC | Kforce | | Staffing | 63.16 | 18 | -1.44% | -0.64% |
| MBLY | Mobileye Global | | Auto Parts | 30.04 | 36 | -4.01% | -0.65% |
| GOLF | Acushnet | | Retail | 61.71 | 55 | -2.30% | -0.66% |
| KRT | Karat Packaging | | Packaging | 26.65 | 51 | -1.15% | -0.67% |
| SGA | Saga | | Broadcasting | 22.61 | 50 | -0.59% | -0.68% |
| ABG | Asbury Automotive | | Automobile | 213.63 | 66 | -3.57% | -0.69% |
| QRTEA | Qurate Retail | | Retail | 0.99 | 31 | -0.41% | -0.71% |
| ABM | ABM Industries | | Services | 44.00 | 81 | -1.19% | -0.72% |
| BLMN | Bloomin | | Restaurants | 26.84 | 51 | -0.70% | -0.74% |
| SPGI | S&P Global | | Services | 409.51 | 25 | -0.91% | -0.74% |
| ENV | Envestnet | | Services | 62.85 | 63 | 0.91% | -0.75% |
| GDEN | Golden Entertainment | | Casinos | 33.70 | 52 | -2.32% | -0.79% |
| UHG | United Homes | | Residential Construction | 6.30 | 28 | -0.87% | -0.79% |
| CBZ | CBIZ | | Services | 74.32 | 83 | -5.12% | -0.80% |
| For chart view version of above stock list: Chart View ➞ 0 - 25 , 25 - 50 , 50 - 75 , 75 - 100 , 100 - 125 , 125 - 150 , 150 - 175 , 175 - 200 , 200 - 225 , 225 - 250 , 250 - 275 , 275 - 300 , 300 - 325 , 325 - 350 , 350 - 375 , 375 - 400 , 400 - 425 , 425 - 450 , 450 - 475 | ||
 | Click To Change The Sort Order: By Market Cap or Company Size Performance: Year-to-date, Week and Day |  |
|
Get the most comprehensive stock market coverage daily at 12Stocks.com ➞ Best Stocks Today ➞ Best Stocks Weekly ➞ Best Stocks Year-to-Date ➞ Best Stocks Trends ➞  Best Stocks Today 12Stocks.com Best Nasdaq Stocks ➞ Best S&P 500 Stocks ➞ Best Tech Stocks ➞ Best Biotech Stocks ➞ |
| Detailed Overview of Consumer Services Stocks |
| Consumer Services Technical Overview, Leaders & Laggards, Top Consumer Services ETF Funds & Detailed Consumer Services Stocks List, Charts, Trends & More |
| Consumer Services Sector: Technical Analysis, Trends & YTD Performance | |
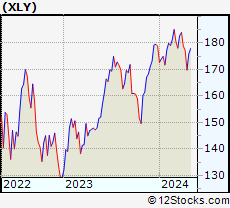
| Consumer Services sector is composed of stocks
from retail, entertainment, media/publishing, consumer goods
and services subsectors. Consumer Services sector, as represented by XLY, an exchange-traded fund [ETF] that holds basket of Consumer Services stocks (e.g, Walmart, Alibaba) is down by -3.54% and is currently underperforming the overall market by -7.79% year-to-date. Below is a quick view of Technical charts and trends: |
|
 XLY Weekly Chart |
|
| Long Term Trend: Good | |
| Medium Term Trend: Not Good | |
 XLY Daily Chart |
|
| Short Term Trend: Very Good | |
| Overall Trend Score: 31 | |
| YTD Performance: -3.54% | |
| **Trend Scores & Views Are Only For Educational Purposes And Not For Investing | |
| 12Stocks.com: Top Performing Consumer Services Sector Stocks | ||||||||||||||||||||||||||||||||||||||||||||||||
 The top performing Consumer Services sector stocks year to date are
Now, more recently, over last week, the top performing Consumer Services sector stocks on the move are


|
||||||||||||||||||||||||||||||||||||||||||||||||
| 12Stocks.com: Investing in Consumer Services Sector using Exchange Traded Funds | |
|
The following table shows list of key exchange traded funds (ETF) that
help investors track Consumer Services Index. For detailed view, check out our ETF Funds section of our website. Quick View: Move mouse or cursor over ETF symbol (ticker) to view short-term Technical chart and over ETF name to view long term chart. Click on ticker or stock name for detailed view. Click on to add stock symbol to your watchlist and to view watchlist. |
12Stocks.com List of ETFs that track Consumer Services Index
| Ticker | ETF Name | Watchlist | Recent Price | Smart Investing & Trading Score | Change % | Week % | Year-to-date % |
| XLY | Consumer Discret Sel | | 172.48 | 31 | -0.98 | 1.6 | -3.54% |
| RTH | Retail | | 199.62 | 44 | -0.09 | 0.5 | 6.05% |
| XRT | Retail | | 71.57 | 51 | -1.31 | 0.56 | -1.04% |
| UCC | Consumer Services | | 33.25 | 66 | -0.36 | 5.3 | -7.4% |
| RXI | Globl Consumer Discretionary | | 158.03 | 36 | -1.41 | 0.56 | -0.65% |
| SCC | Short Consumer Services | | 16.55 | 42 | 2.67 | -2.38 | 8% |
| UGE | Consumer Goods | | 17.31 | 90 | 0.41 | 4.11 | 9.97% |
| 12Stocks.com: Charts, Trends, Fundamental Data and Performances of Consumer Services Stocks | |
|
We now take in-depth look at all Consumer Services stocks including charts, multi-period performances and overall trends (as measured by Smart Investing & Trading Score). One can sort Consumer Services stocks (click link to choose) by Daily, Weekly and by Year-to-Date performances. Also, one can sort by size of the company or by market capitalization. |
| Select Your Default Chart Type: | |||||
| |||||
| Click on stock symbol or name for detailed view. Click on to add stock symbol to your watchlist and to view watchlist. Quick View: Move mouse or cursor over "Daily" to quickly view daily Technical stock chart and over "Weekly" to view weekly Technical stock chart. | |||||

 | KELYA Kelly Services, Inc. |
| Sector: Services & Goods | |
| SubSector: Staffing & Outsourcing Services | |
| MarketCap: 587.228 Millions | |
| Recent Price: 23.61 Smart Investing & Trading Score: 63 | |
| Day Percent Change: -2.54% Day Change: -0.62 | |
| Week Change: -0.4% Year-to-date Change: 9.2% | |
| KELYA Links: Profile News Message Board | |
| Charts:- Daily , Weekly | |
| Add KELYA to Watchlist: View: Get Complete KELYA Trend Analysis ➞ | |
 | NGVC Natural Grocers by Vitamin Cottage, Inc. |
| Sector: Services & Goods | |
| SubSector: Grocery Stores | |
| MarketCap: 185.475 Millions | |
| Recent Price: 16.41 Smart Investing & Trading Score: 43 | |
| Day Percent Change: 2.31% Day Change: 0.37 | |
| Week Change: -0.42% Year-to-date Change: 2.6% | |
| NGVC Links: Profile News Message Board | |
| Charts:- Daily , Weekly | |
| Add NGVC to Watchlist: View: Get Complete NGVC Trend Analysis ➞ | |
 | ACEL Accel Entertainment, Inc. |
| Sector: Services & Goods | |
| SubSector: Gaming Activities | |
| MarketCap: 486.589 Millions | |
| Recent Price: 11.32 Smart Investing & Trading Score: 76 | |
| Day Percent Change: -1.57% Day Change: -0.18 | |
| Week Change: -0.44% Year-to-date Change: 10.2% | |
| ACEL Links: Profile News Message Board | |
| Charts:- Daily , Weekly | |
| Add ACEL to Watchlist: View: Get Complete ACEL Trend Analysis ➞ | |
 | SIX Six Flags Entertainment Corporation |
| Sector: Services & Goods | |
| SubSector: General Entertainment | |
| MarketCap: 1282.69 Millions | |
| Recent Price: 23.34 Smart Investing & Trading Score: 25 | |
| Day Percent Change: -2.10% Day Change: -0.50 | |
| Week Change: -0.47% Year-to-date Change: -6.9% | |
| SIX Links: Profile News Message Board | |
| Charts:- Daily , Weekly | |
| Add SIX to Watchlist: View: Get Complete SIX Trend Analysis ➞ | |
 | EVC Entravision Communications Corporation |
| Sector: Services & Goods | |
| SubSector: Broadcasting - TV | |
| MarketCap: 171.763 Millions | |
| Recent Price: 2.09 Smart Investing & Trading Score: 32 | |
| Day Percent Change: 0.48% Day Change: 0.01 | |
| Week Change: -0.48% Year-to-date Change: -49.9% | |
| EVC Links: Profile News Message Board | |
| Charts:- Daily , Weekly | |
| Add EVC to Watchlist: View: Get Complete EVC Trend Analysis ➞ | |
 | ARCO Arcos Dorados Holdings Inc. |
| Sector: Services & Goods | |
| SubSector: Restaurants | |
| MarketCap: 778.87 Millions | |
| Recent Price: 10.85 Smart Investing & Trading Score: 32 | |
| Day Percent Change: -0.78% Day Change: -0.08 | |
| Week Change: -0.5% Year-to-date Change: -14.5% | |
| ARCO Links: Profile News Message Board | |
| Charts:- Daily , Weekly | |
| Add ARCO to Watchlist: View: Get Complete ARCO Trend Analysis ➞ | |
 | J Jacobs Engineering Group Inc. |
| Sector: Services & Goods | |
| SubSector: Technical Services | |
| MarketCap: 9714.8 Millions | |
| Recent Price: 143.03 Smart Investing & Trading Score: 41 | |
| Day Percent Change: -0.66% Day Change: -0.95 | |
| Week Change: -0.56% Year-to-date Change: 10.2% | |
| J Links: Profile News Message Board | |
| Charts:- Daily , Weekly | |
| Add J to Watchlist: View: Get Complete J Trend Analysis ➞ | |
 | M Macy s, Inc. |
| Sector: Services & Goods | |
| SubSector: Department Stores | |
| MarketCap: 2391.72 Millions | |
| Recent Price: 18.42 Smart Investing & Trading Score: 36 | |
| Day Percent Change: -1.66% Day Change: -0.31 | |
| Week Change: -0.59% Year-to-date Change: -8.5% | |
| M Links: Profile News Message Board | |
| Charts:- Daily , Weekly | |
| Add M to Watchlist: View: Get Complete M Trend Analysis ➞ | |
 | WMK Weis Markets, Inc. |
| Sector: Services & Goods | |
| SubSector: Grocery Stores | |
| MarketCap: 1148.75 Millions | |
| Recent Price: 64.11 Smart Investing & Trading Score: 93 | |
| Day Percent Change: -0.37% Day Change: -0.23 | |
| Week Change: -0.6% Year-to-date Change: 0.2% | |
| WMK Links: Profile News Message Board | |
| Charts:- Daily , Weekly | |
| Add WMK to Watchlist: View: Get Complete WMK Trend Analysis ➞ | |
 | RH RH |
| Sector: Services & Goods | |
| SubSector: Home Furnishing Stores | |
| MarketCap: 1828.25 Millions | |
| Recent Price: 238.96 Smart Investing & Trading Score: 48 | |
| Day Percent Change: -5.12% Day Change: -12.89 | |
| Week Change: -0.6% Year-to-date Change: -18.0% | |
| RH Links: Profile News Message Board | |
| Charts:- Daily , Weekly | |
| Add RH to Watchlist: View: Get Complete RH Trend Analysis ➞ | |
 | NSP Insperity, Inc. |
| Sector: Services & Goods | |
| SubSector: Business Services | |
| MarketCap: 1385.32 Millions | |
| Recent Price: 107.69 Smart Investing & Trading Score: 67 | |
| Day Percent Change: -1.68% Day Change: -1.83 | |
| Week Change: -0.61% Year-to-date Change: -8.1% | |
| NSP Links: Profile News Message Board | |
| Charts:- Daily , Weekly | |
| Add NSP to Watchlist: View: Get Complete NSP Trend Analysis ➞ | |
 | KFRC Kforce Inc. |
| Sector: Services & Goods | |
| SubSector: Staffing & Outsourcing Services | |
| MarketCap: 622.828 Millions | |
| Recent Price: 63.16 Smart Investing & Trading Score: 18 | |
| Day Percent Change: -1.44% Day Change: -0.92 | |
| Week Change: -0.64% Year-to-date Change: -6.5% | |
| KFRC Links: Profile News Message Board | |
| Charts:- Daily , Weekly | |
| Add KFRC to Watchlist: View: Get Complete KFRC Trend Analysis ➞ | |
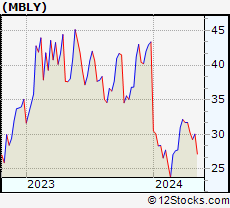 | MBLY Mobileye Global Inc. |
| Sector: Services & Goods | |
| SubSector: Auto Parts | |
| MarketCap: 31280 Millions | |
| Recent Price: 30.04 Smart Investing & Trading Score: 36 | |
| Day Percent Change: -4.01% Day Change: -1.25 | |
| Week Change: -0.65% Year-to-date Change: -30.7% | |
| MBLY Links: Profile News Message Board | |
| Charts:- Daily , Weekly | |
| Add MBLY to Watchlist: View: Get Complete MBLY Trend Analysis ➞ | |
 | GOLF Acushnet Holdings Corp. |
| Sector: Services & Goods | |
| SubSector: Sporting Goods Stores | |
| MarketCap: 1717.74 Millions | |
| Recent Price: 61.71 Smart Investing & Trading Score: 55 | |
| Day Percent Change: -2.30% Day Change: -1.45 | |
| Week Change: -0.66% Year-to-date Change: -2.3% | |
| GOLF Links: Profile News Message Board | |
| Charts:- Daily , Weekly | |
| Add GOLF to Watchlist: View: Get Complete GOLF Trend Analysis ➞ | |
 | KRT Karat Packaging Inc. |
| Sector: Services & Goods | |
| SubSector: Packaging & Containers | |
| MarketCap: 357 Millions | |
| Recent Price: 26.65 Smart Investing & Trading Score: 51 | |
| Day Percent Change: -1.15% Day Change: -0.31 | |
| Week Change: -0.67% Year-to-date Change: 7.0% | |
| KRT Links: Profile News Message Board | |
| Charts:- Daily , Weekly | |
| Add KRT to Watchlist: View: Get Complete KRT Trend Analysis ➞ | |
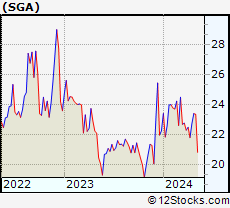 | SGA Saga Communications, Inc. |
| Sector: Services & Goods | |
| SubSector: Broadcasting - Radio | |
| MarketCap: 158.295 Millions | |
| Recent Price: 22.61 Smart Investing & Trading Score: 50 | |
| Day Percent Change: -0.59% Day Change: -0.13 | |
| Week Change: -0.68% Year-to-date Change: 1.6% | |
| SGA Links: Profile News Message Board | |
| Charts:- Daily , Weekly | |
| Add SGA to Watchlist: View: Get Complete SGA Trend Analysis ➞ | |
 | ABG Asbury Automotive Group, Inc. |
| Sector: Services & Goods | |
| SubSector: Auto Dealerships | |
| MarketCap: 1203.21 Millions | |
| Recent Price: 213.63 Smart Investing & Trading Score: 66 | |
| Day Percent Change: -3.57% Day Change: -7.91 | |
| Week Change: -0.69% Year-to-date Change: -5.0% | |
| ABG Links: Profile News Message Board | |
| Charts:- Daily , Weekly | |
| Add ABG to Watchlist: View: Get Complete ABG Trend Analysis ➞ | |
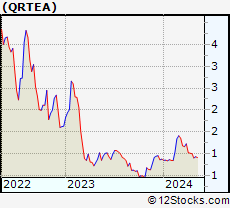 | QRTEA Qurate Retail, Inc. |
| Sector: Services & Goods | |
| SubSector: Specialty Retail, Other | |
| MarketCap: 1980.44 Millions | |
| Recent Price: 0.99 Smart Investing & Trading Score: 31 | |
| Day Percent Change: -0.41% Day Change: 0.00 | |
| Week Change: -0.71% Year-to-date Change: 13.4% | |
| QRTEA Links: Profile News Message Board | |
| Charts:- Daily , Weekly | |
| Add QRTEA to Watchlist: View: Get Complete QRTEA Trend Analysis ➞ | |
 | ABM ABM Industries Incorporated |
| Sector: Services & Goods | |
| SubSector: Business Services | |
| MarketCap: 1706.72 Millions | |
| Recent Price: 44.00 Smart Investing & Trading Score: 81 | |
| Day Percent Change: -1.19% Day Change: -0.53 | |
| Week Change: -0.72% Year-to-date Change: -1.9% | |
| ABM Links: Profile News Message Board | |
| Charts:- Daily , Weekly | |
| Add ABM to Watchlist: View: Get Complete ABM Trend Analysis ➞ | |
 | BLMN Bloomin Brands, Inc. |
| Sector: Services & Goods | |
| SubSector: Restaurants | |
| MarketCap: 503.47 Millions | |
| Recent Price: 26.84 Smart Investing & Trading Score: 51 | |
| Day Percent Change: -0.70% Day Change: -0.19 | |
| Week Change: -0.74% Year-to-date Change: -4.7% | |
| BLMN Links: Profile News Message Board | |
| Charts:- Daily , Weekly | |
| Add BLMN to Watchlist: View: Get Complete BLMN Trend Analysis ➞ | |
 | SPGI S&P Global Inc. |
| Sector: Services & Goods | |
| SubSector: Business Services | |
| MarketCap: 55247.9 Millions | |
| Recent Price: 409.51 Smart Investing & Trading Score: 25 | |
| Day Percent Change: -0.91% Day Change: -3.77 | |
| Week Change: -0.74% Year-to-date Change: -7.0% | |
| SPGI Links: Profile News Message Board | |
| Charts:- Daily , Weekly | |
| Add SPGI to Watchlist: View: Get Complete SPGI Trend Analysis ➞ | |
 | ENV Envestnet, Inc. |
| Sector: Services & Goods | |
| SubSector: Business Services | |
| MarketCap: 3114.02 Millions | |
| Recent Price: 62.85 Smart Investing & Trading Score: 63 | |
| Day Percent Change: 0.91% Day Change: 0.56 | |
| Week Change: -0.75% Year-to-date Change: 26.9% | |
| ENV Links: Profile News Message Board | |
| Charts:- Daily , Weekly | |
| Add ENV to Watchlist: View: Get Complete ENV Trend Analysis ➞ | |
 | GDEN Golden Entertainment, Inc. |
| Sector: Services & Goods | |
| SubSector: Resorts & Casinos | |
| MarketCap: 130.794 Millions | |
| Recent Price: 33.70 Smart Investing & Trading Score: 52 | |
| Day Percent Change: -2.32% Day Change: -0.80 | |
| Week Change: -0.79% Year-to-date Change: -15.6% | |
| GDEN Links: Profile News Message Board | |
| Charts:- Daily , Weekly | |
| Add GDEN to Watchlist: View: Get Complete GDEN Trend Analysis ➞ | |
 | UHG United Homes Group, Inc. |
| Sector: Services & Goods | |
| SubSector: Residential Construction | |
| MarketCap: 566 Millions | |
| Recent Price: 6.30 Smart Investing & Trading Score: 28 | |
| Day Percent Change: -0.87% Day Change: -0.06 | |
| Week Change: -0.79% Year-to-date Change: -24.9% | |
| UHG Links: Profile News Message Board | |
| Charts:- Daily , Weekly | |
| Add UHG to Watchlist: View: Get Complete UHG Trend Analysis ➞ | |
 | CBZ CBIZ, Inc. |
| Sector: Services & Goods | |
| SubSector: Business Services | |
| MarketCap: 1121.32 Millions | |
| Recent Price: 74.32 Smart Investing & Trading Score: 83 | |
| Day Percent Change: -5.12% Day Change: -4.01 | |
| Week Change: -0.8% Year-to-date Change: 18.7% | |
| CBZ Links: Profile News Message Board | |
| Charts:- Daily , Weekly | |
| Add CBZ to Watchlist: View: Get Complete CBZ Trend Analysis ➞ | |
| For tabular summary view of above stock list: Summary View ➞ 0 - 25 , 25 - 50 , 50 - 75 , 75 - 100 , 100 - 125 , 125 - 150 , 150 - 175 , 175 - 200 , 200 - 225 , 225 - 250 , 250 - 275 , 275 - 300 , 300 - 325 , 325 - 350 , 350 - 375 , 375 - 400 , 400 - 425 , 425 - 450 , 450 - 475 | ||
| Click To Change The Sort Order: By Market Cap or Company Size Performance: Year-to-date, Week and Day | |
| Select Chart Type: | ||
|
Best Stocks Today 12Stocks.com |
© 2024 12Stocks.com Terms & Conditions Privacy Contact Us
All Information Provided Only For Education And Not To Be Used For Investing or Trading. See Terms & Conditions


One More Thing ... Get Best Stocks Delivered Daily!
Never Ever Miss A Move With Our Top Ten Stocks Lists
Find Best Stocks In Any Market - Bull or Bear Market
Take A Peek At Our Top Ten Stocks Lists: Daily, Weekly, Year-to-Date & Top Trends
Find Best Stocks In Any Market - Bull or Bear Market
Take A Peek At Our Top Ten Stocks Lists: Daily, Weekly, Year-to-Date & Top Trends
Consumer Services Stocks With Best Up Trends [0-bearish to 100-bullish]: Ardagh Metal[100], Churchill Downs[100], Yatsen Holding[100], Chipotle Mexican[100], MYT Netherlands[100], Dada Nexus[100], Avnet [100], Reynolds Consumer[100], Omnicom [100], Alibaba [100], FTI Consulting[100]
Best Consumer Services Stocks Year-to-Date:
U Power[2896.65%], Vroom [1804.53%], Yatsen Holding[502.79%], Fluent [298.51%], Codere Online[133.9%], Research[107.01%], Sweetgreen [91.24%], RealReal [64.43%], Bright Scholar[59.2%], PaySign [55.54%], DXP Enterprises[50.59%] Best Consumer Services Stocks This Week:
Chicken Soup[210%], Yatsen Holding[21.99%], Hibbett Sports[21%], Golden Heaven[15.91%], K12 [15.21%], Strategic Education[15.13%], Sonic Automotive[14.21%], TAL Education[13.12%], Watsco [12.7%], Ardagh Metal[12.61%], iHeartMedia [12.37%] Best Consumer Services Stocks Daily:
Boqii Holding[15.69%], Strategic Education[12.22%], Altisource Portfolio[8.82%], Red Robin[8.77%], TransUnion [8.77%], Sonic Automotive[8.63%], MOGU [8.43%], Ardagh Metal[6.65%], Churchill Downs[6.18%], TAL Education[5.46%], Soho House[5.19%]