
 Login Sign Up


| |||||
 |  | ||||

| 12Stocks.com Market Intelligence |
Best Consumer Services Stocks
| In a hurry? Services & Goods Stocks: Performance Trends Table, Stock Charts
Sort Consumer Services: Daily, Weekly, Year-to-Date, Market Cap & Trends. Filter Services & Goods stocks list by size: All Large Mid-Range Small |
| 12Stocks.com Consumer Services Stocks Performances & Trends Daily | |||||||||
|
|  The overall Smart Investing & Trading Score is 58 (0-bearish to 100-bullish) which puts Consumer Services sector in short term neutral trend. The Smart Investing & Trading Score from previous trading session is 23 and an improvement of trend continues.
| ||||||||
Here are the Smart Investing & Trading Scores of the most requested Consumer Services stocks at 12Stocks.com (click stock name for detailed review):
|


| Consider signing up for our daily 12Stocks.com "Best Stocks Newsletter". You will never ever miss a big stock move again! |
| 12Stocks.com: Investing in Consumer Services sector with Stocks | |
|
The following table helps investors and traders sort through current performance and trends (as measured by Smart Investing & Trading Score) of various
stocks in the Consumer Services sector. Quick View: Move mouse or cursor over stock symbol (ticker) to view short-term Technical chart and over stock name to view long term chart. Click on  to add stock symbol to your watchlist and to add stock symbol to your watchlist and  to view watchlist. Click on any ticker or stock name for detailed market intelligence report for that stock. to view watchlist. Click on any ticker or stock name for detailed market intelligence report for that stock. |
12Stocks.com Performance of Stocks in Consumer Services Sector
| Ticker | Stock Name | Watchlist | Category | Recent Price | Smart Investing & Trading Score | Change % | Weekly Change% |
| OUT | Outfront Media |   | Marketing | 15.45 | 68 | 0.19% | 4.18% |
| PLNT | Planet Fitness | | Sporting | 61.09 | 52 | 1.08% | 4.11% |
| WLDN | Willdan | | Services | 27.95 | 83 | -0.18% | 4.10% |
| ZGN | Ermenegildo Zegna | | Apparel Manufacturing | 11.98 | 47 | 0.50% | 4.08% |
| CBRL | Cracker Barrel | | Restaurants | 61.07 | 59 | 0.38% | 4.04% |
| TXRH | Texas Roadhouse | | Restaurants | 156.76 | 90 | -0.07% | 4.00% |
| PK | Park Hotels | | Lodging | 16.79 | 48 | 0.36% | 3.96% |
| SCI | Service | | Services | 71.50 | 75 | 0.73% | 3.94% |
| CPRT | Copart | | Automobile | 54.93 | 58 | 1.14% | 3.88% |
| AFYA | Afya | | Education | 16.62 | 27 | 1.16% | 3.88% |
| VSEC | VSE | | Services | 78.61 | 76 | 1.12% | 3.87% |
| CAKE | Cheesecake Factory | | Restaurants | 35.30 | 100 | -0.51% | 3.82% |
| QGEN | QIAGEN N.V | | Research | 41.52 | 74 | -0.88% | 3.80% |
| AMC | AMC Entertainment | | Entertainment | 3.28 | 57 | -3.24% | 3.80% |
| IMXI | Money | | Services | 22.15 | 75 | 1.19% | 3.80% |
| YJ | Yunji | | Retail | 0.77 | 48 | 2.45% | 3.77% |
| LANV | Lanvin | | Luxury Goods | 1.65 | 74 | 3.13% | 3.77% |
| RSVR | Reservoir Media | | Entertainment | 8.30 | 100 | 0.55% | 3.75% |
| SDA | SunCar Technology | | Auto & Truck Dealerships | 7.36 | 57 | -3.10% | 3.74% |
| H | Hyatt Hotels | | Lodging | 151.83 | 70 | 1.35% | 3.73% |
| CHDN | Churchill Downs | | Gaming | 123.39 | 93 | -0.09% | 3.72% |
| IAS | Integral Ad | | Advertising | 9.45 | 30 | -1.31% | 3.68% |
| GCO | Genesco | | Apparel | 26.55 | 60 | -0.82% | 3.67% |
| HGV | Hilton Grand | | Casinos | 44.79 | 75 | 0.34% | 3.66% |
| OMC | Omnicom | | Advertising | 95.98 | 100 | 1.87% | 3.63% |
| For chart view version of above stock list: Chart View ➞ 0 - 25 , 25 - 50 , 50 - 75 , 75 - 100 , 100 - 125 , 125 - 150 , 150 - 175 , 175 - 200 , 200 - 225 , 225 - 250 , 250 - 275 , 275 - 300 , 300 - 325 , 325 - 350 , 350 - 375 , 375 - 400 , 400 - 425 , 425 - 450 , 450 - 475 | ||
 | Click To Change The Sort Order: By Market Cap or Company Size Performance: Year-to-date, Week and Day |  |
|
Get the most comprehensive stock market coverage daily at 12Stocks.com ➞ Best Stocks Today ➞ Best Stocks Weekly ➞ Best Stocks Year-to-Date ➞ Best Stocks Trends ➞  Best Stocks Today 12Stocks.com Best Nasdaq Stocks ➞ Best S&P 500 Stocks ➞ Best Tech Stocks ➞ Best Biotech Stocks ➞ |
| Detailed Overview of Consumer Services Stocks |
| Consumer Services Technical Overview, Leaders & Laggards, Top Consumer Services ETF Funds & Detailed Consumer Services Stocks List, Charts, Trends & More |
| Consumer Services Sector: Technical Analysis, Trends & YTD Performance | |
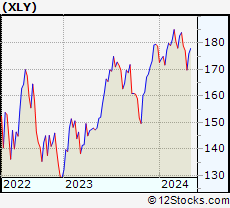
| Consumer Services sector is composed of stocks
from retail, entertainment, media/publishing, consumer goods
and services subsectors. Consumer Services sector, as represented by XLY, an exchange-traded fund [ETF] that holds basket of Consumer Services stocks (e.g, Walmart, Alibaba) is down by -2.58% and is currently underperforming the overall market by -8.24% year-to-date. Below is a quick view of Technical charts and trends: |
|
 XLY Weekly Chart |
|
| Long Term Trend: Good | |
| Medium Term Trend: Not Good | |
 XLY Daily Chart |
|
| Short Term Trend: Very Good | |
| Overall Trend Score: 58 | |
| YTD Performance: -2.58% | |
| **Trend Scores & Views Are Only For Educational Purposes And Not For Investing | |
| 12Stocks.com: Top Performing Consumer Services Sector Stocks | ||||||||||||||||||||||||||||||||||||||||||||||||
 The top performing Consumer Services sector stocks year to date are
Now, more recently, over last week, the top performing Consumer Services sector stocks on the move are


|
||||||||||||||||||||||||||||||||||||||||||||||||
| 12Stocks.com: Investing in Consumer Services Sector using Exchange Traded Funds | |
|
The following table shows list of key exchange traded funds (ETF) that
help investors track Consumer Services Index. For detailed view, check out our ETF Funds section of our website. Quick View: Move mouse or cursor over ETF symbol (ticker) to view short-term Technical chart and over ETF name to view long term chart. Click on ticker or stock name for detailed view. Click on to add stock symbol to your watchlist and to view watchlist. |
12Stocks.com List of ETFs that track Consumer Services Index
| Ticker | ETF Name | Watchlist | Recent Price | Smart Investing & Trading Score | Change % | Week % | Year-to-date % |
| XLY | Consumer Discret Sel | | 174.19 | 58 | 0.96 | 2.61 | -2.58% |
| RTH | Retail | | 199.79 | 44 | -0.35 | 0.58 | 6.14% |
| IYC | Consumer Services | | 77.83 | 43 | 0.31 | 2.05 | 2.72% |
| XRT | Retail | | 72.52 | 65 | -0.71 | 1.9 | 0.28% |
| IYK | Consumer Goods | | 67.20 | 75 | 0.99 | 2.11 | 5.16% |
| UCC | Consumer Services | | 33.37 | 73 | 2.12 | 5.68 | -7.07% |
| RETL | Retail Bull 3X | | 8.59 | 48 | -1.60 | 5.79 | -5.81% |
| RXI | Globl Consumer Discretionary | | 160.29 | 43 | 0.63 | 2 | 0.77% |
| SCC | Short Consumer Services | | 16.12 | 35 | -1.86 | -4.92 | 5.2% |
| UGE | Consumer Goods | | 17.24 | 90 | 1.23 | 3.68 | 9.52% |
| 12Stocks.com: Charts, Trends, Fundamental Data and Performances of Consumer Services Stocks | |
|
We now take in-depth look at all Consumer Services stocks including charts, multi-period performances and overall trends (as measured by Smart Investing & Trading Score). One can sort Consumer Services stocks (click link to choose) by Daily, Weekly and by Year-to-Date performances. Also, one can sort by size of the company or by market capitalization. |
| Select Your Default Chart Type: | |||||
| |||||
| Click on stock symbol or name for detailed view. Click on to add stock symbol to your watchlist and to view watchlist. Quick View: Move mouse or cursor over "Daily" to quickly view daily Technical stock chart and over "Weekly" to view weekly Technical stock chart. | |||||

 | OUT Outfront Media Inc. |
| Sector: Services & Goods | |
| SubSector: Marketing Services | |
| MarketCap: 1388.15 Millions | |
| Recent Price: 15.45 Smart Investing & Trading Score: 68 | |
| Day Percent Change: 0.19% Day Change: 0.03 | |
| Week Change: 4.18% Year-to-date Change: 10.7% | |
| OUT Links: Profile News Message Board | |
| Charts:- Daily , Weekly | |
| Add OUT to Watchlist: View: Get Complete OUT Trend Analysis ➞ | |
 | PLNT Planet Fitness, Inc. |
| Sector: Services & Goods | |
| SubSector: Sporting Activities | |
| MarketCap: 3485.94 Millions | |
| Recent Price: 61.09 Smart Investing & Trading Score: 52 | |
| Day Percent Change: 1.08% Day Change: 0.65 | |
| Week Change: 4.11% Year-to-date Change: -16.3% | |
| PLNT Links: Profile News Message Board | |
| Charts:- Daily , Weekly | |
| Add PLNT to Watchlist: View: Get Complete PLNT Trend Analysis ➞ | |
 | WLDN Willdan Group, Inc. |
| Sector: Services & Goods | |
| SubSector: Technical Services | |
| MarketCap: 235.61 Millions | |
| Recent Price: 27.95 Smart Investing & Trading Score: 83 | |
| Day Percent Change: -0.18% Day Change: -0.05 | |
| Week Change: 4.1% Year-to-date Change: 30.0% | |
| WLDN Links: Profile News Message Board | |
| Charts:- Daily , Weekly | |
| Add WLDN to Watchlist: View: Get Complete WLDN Trend Analysis ➞ | |
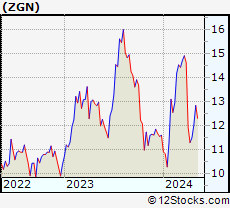 | ZGN Ermenegildo Zegna N.V. |
| Sector: Services & Goods | |
| SubSector: Apparel Manufacturing | |
| MarketCap: 3170 Millions | |
| Recent Price: 11.98 Smart Investing & Trading Score: 47 | |
| Day Percent Change: 0.50% Day Change: 0.06 | |
| Week Change: 4.08% Year-to-date Change: 3.1% | |
| ZGN Links: Profile News Message Board | |
| Charts:- Daily , Weekly | |
| Add ZGN to Watchlist: View: Get Complete ZGN Trend Analysis ➞ | |
 | CBRL Cracker Barrel Old Country Store, Inc. |
| Sector: Services & Goods | |
| SubSector: Restaurants | |
| MarketCap: 1839.6 Millions | |
| Recent Price: 61.07 Smart Investing & Trading Score: 59 | |
| Day Percent Change: 0.38% Day Change: 0.23 | |
| Week Change: 4.04% Year-to-date Change: -20.8% | |
| CBRL Links: Profile News Message Board | |
| Charts:- Daily , Weekly | |
| Add CBRL to Watchlist: View: Get Complete CBRL Trend Analysis ➞ | |
 | TXRH Texas Roadhouse, Inc. |
| Sector: Services & Goods | |
| SubSector: Restaurants | |
| MarketCap: 2569.4 Millions | |
| Recent Price: 156.76 Smart Investing & Trading Score: 90 | |
| Day Percent Change: -0.07% Day Change: -0.11 | |
| Week Change: 4% Year-to-date Change: 28.3% | |
| TXRH Links: Profile News Message Board | |
| Charts:- Daily , Weekly | |
| Add TXRH to Watchlist: View: Get Complete TXRH Trend Analysis ➞ | |
 | PK Park Hotels & Resorts Inc. |
| Sector: Services & Goods | |
| SubSector: Lodging | |
| MarketCap: 2221.06 Millions | |
| Recent Price: 16.79 Smart Investing & Trading Score: 48 | |
| Day Percent Change: 0.36% Day Change: 0.06 | |
| Week Change: 3.96% Year-to-date Change: 9.7% | |
| PK Links: Profile News Message Board | |
| Charts:- Daily , Weekly | |
| Add PK to Watchlist: View: Get Complete PK Trend Analysis ➞ | |
 | SCI Service Corporation International |
| Sector: Services & Goods | |
| SubSector: Personal Services | |
| MarketCap: 7216.05 Millions | |
| Recent Price: 71.50 Smart Investing & Trading Score: 75 | |
| Day Percent Change: 0.73% Day Change: 0.52 | |
| Week Change: 3.94% Year-to-date Change: 4.5% | |
| SCI Links: Profile News Message Board | |
| Charts:- Daily , Weekly | |
| Add SCI to Watchlist: View: Get Complete SCI Trend Analysis ➞ | |
 | CPRT Copart, Inc. |
| Sector: Services & Goods | |
| SubSector: Auto Dealerships | |
| MarketCap: 15462.1 Millions | |
| Recent Price: 54.93 Smart Investing & Trading Score: 58 | |
| Day Percent Change: 1.14% Day Change: 0.62 | |
| Week Change: 3.88% Year-to-date Change: 12.1% | |
| CPRT Links: Profile News Message Board | |
| Charts:- Daily , Weekly | |
| Add CPRT to Watchlist: View: Get Complete CPRT Trend Analysis ➞ | |
 | AFYA Afya Limited |
| Sector: Services & Goods | |
| SubSector: Education & Training Services | |
| MarketCap: 1559.26 Millions | |
| Recent Price: 16.62 Smart Investing & Trading Score: 27 | |
| Day Percent Change: 1.16% Day Change: 0.19 | |
| Week Change: 3.88% Year-to-date Change: -24.2% | |
| AFYA Links: Profile News Message Board | |
| Charts:- Daily , Weekly | |
| Add AFYA to Watchlist: View: Get Complete AFYA Trend Analysis ➞ | |
 | VSEC VSE Corporation |
| Sector: Services & Goods | |
| SubSector: Technical Services | |
| MarketCap: 183.61 Millions | |
| Recent Price: 78.61 Smart Investing & Trading Score: 76 | |
| Day Percent Change: 1.12% Day Change: 0.87 | |
| Week Change: 3.87% Year-to-date Change: 21.7% | |
| VSEC Links: Profile News Message Board | |
| Charts:- Daily , Weekly | |
| Add VSEC to Watchlist: View: Get Complete VSEC Trend Analysis ➞ | |
 | CAKE The Cheesecake Factory Incorporated |
| Sector: Services & Goods | |
| SubSector: Restaurants | |
| MarketCap: 829 Millions | |
| Recent Price: 35.30 Smart Investing & Trading Score: 100 | |
| Day Percent Change: -0.51% Day Change: -0.18 | |
| Week Change: 3.82% Year-to-date Change: 0.8% | |
| CAKE Links: Profile News Message Board | |
| Charts:- Daily , Weekly | |
| Add CAKE to Watchlist: View: Get Complete CAKE Trend Analysis ➞ | |
 | QGEN QIAGEN N.V. |
| Sector: Services & Goods | |
| SubSector: Research Services | |
| MarketCap: 8698.94 Millions | |
| Recent Price: 41.52 Smart Investing & Trading Score: 74 | |
| Day Percent Change: -0.88% Day Change: -0.37 | |
| Week Change: 3.8% Year-to-date Change: -4.4% | |
| QGEN Links: Profile News Message Board | |
| Charts:- Daily , Weekly | |
| Add QGEN to Watchlist: View: Get Complete QGEN Trend Analysis ➞ | |
 | AMC AMC Entertainment Holdings, Inc. |
| Sector: Services & Goods | |
| SubSector: Movie Production, Theaters | |
| MarketCap: 415.929 Millions | |
| Recent Price: 3.28 Smart Investing & Trading Score: 57 | |
| Day Percent Change: -3.24% Day Change: -0.11 | |
| Week Change: 3.8% Year-to-date Change: -46.4% | |
| AMC Links: Profile News Message Board | |
| Charts:- Daily , Weekly | |
| Add AMC to Watchlist: View: Get Complete AMC Trend Analysis ➞ | |
 | IMXI International Money Express, Inc. |
| Sector: Services & Goods | |
| SubSector: Business Services | |
| MarketCap: 326.582 Millions | |
| Recent Price: 22.15 Smart Investing & Trading Score: 75 | |
| Day Percent Change: 1.19% Day Change: 0.26 | |
| Week Change: 3.8% Year-to-date Change: 0.3% | |
| IMXI Links: Profile News Message Board | |
| Charts:- Daily , Weekly | |
| Add IMXI to Watchlist: View: Get Complete IMXI Trend Analysis ➞ | |
 | YJ Yunji Inc. |
| Sector: Services & Goods | |
| SubSector: Specialty Retail, Other | |
| MarketCap: 770.644 Millions | |
| Recent Price: 0.77 Smart Investing & Trading Score: 48 | |
| Day Percent Change: 2.45% Day Change: 0.02 | |
| Week Change: 3.77% Year-to-date Change: 8.8% | |
| YJ Links: Profile News Message Board | |
| Charts:- Daily , Weekly | |
| Add YJ to Watchlist: View: Get Complete YJ Trend Analysis ➞ | |
 | LANV Lanvin Group Holdings Limited |
| Sector: Services & Goods | |
| SubSector: Luxury Goods | |
| MarketCap: 712 Millions | |
| Recent Price: 1.65 Smart Investing & Trading Score: 74 | |
| Day Percent Change: 3.13% Day Change: 0.05 | |
| Week Change: 3.77% Year-to-date Change: -46.1% | |
| LANV Links: Profile News Message Board | |
| Charts:- Daily , Weekly | |
| Add LANV to Watchlist: View: Get Complete LANV Trend Analysis ➞ | |
 | RSVR Reservoir Media, Inc. |
| Sector: Services & Goods | |
| SubSector: Entertainment | |
| MarketCap: 389 Millions | |
| Recent Price: 8.30 Smart Investing & Trading Score: 100 | |
| Day Percent Change: 0.55% Day Change: 0.04 | |
| Week Change: 3.75% Year-to-date Change: 16.6% | |
| RSVR Links: Profile News Message Board | |
| Charts:- Daily , Weekly | |
| Add RSVR to Watchlist: View: Get Complete RSVR Trend Analysis ➞ | |
 | SDA SunCar Technology Group Inc. |
| Sector: Services & Goods | |
| SubSector: Auto & Truck Dealerships | |
| MarketCap: 2680 Millions | |
| Recent Price: 7.36 Smart Investing & Trading Score: 57 | |
| Day Percent Change: -3.10% Day Change: -0.23 | |
| Week Change: 3.74% Year-to-date Change: -5.3% | |
| SDA Links: Profile News Message Board | |
| Charts:- Daily , Weekly | |
| Add SDA to Watchlist: View: Get Complete SDA Trend Analysis ➞ | |
 | H Hyatt Hotels Corporation |
| Sector: Services & Goods | |
| SubSector: Lodging | |
| MarketCap: 5525.56 Millions | |
| Recent Price: 151.83 Smart Investing & Trading Score: 70 | |
| Day Percent Change: 1.35% Day Change: 2.02 | |
| Week Change: 3.73% Year-to-date Change: 16.4% | |
| H Links: Profile News Message Board | |
| Charts:- Daily , Weekly | |
| Add H to Watchlist: View: Get Complete H Trend Analysis ➞ | |
 | CHDN Churchill Downs Incorporated |
| Sector: Services & Goods | |
| SubSector: Gaming Activities | |
| MarketCap: 3693.29 Millions | |
| Recent Price: 123.39 Smart Investing & Trading Score: 93 | |
| Day Percent Change: -0.09% Day Change: -0.11 | |
| Week Change: 3.72% Year-to-date Change: -8.6% | |
| CHDN Links: Profile News Message Board | |
| Charts:- Daily , Weekly | |
| Add CHDN to Watchlist: View: Get Complete CHDN Trend Analysis ➞ | |
 | IAS Integral Ad Science Holding Corp. |
| Sector: Services & Goods | |
| SubSector: Advertising Agencies | |
| MarketCap: 2760 Millions | |
| Recent Price: 9.45 Smart Investing & Trading Score: 30 | |
| Day Percent Change: -1.31% Day Change: -0.13 | |
| Week Change: 3.68% Year-to-date Change: -35.0% | |
| IAS Links: Profile News Message Board | |
| Charts:- Daily , Weekly | |
| Add IAS to Watchlist: View: Get Complete IAS Trend Analysis ➞ | |
 | GCO Genesco Inc. |
| Sector: Services & Goods | |
| SubSector: Apparel Stores | |
| MarketCap: 187.508 Millions | |
| Recent Price: 26.55 Smart Investing & Trading Score: 60 | |
| Day Percent Change: -0.82% Day Change: -0.22 | |
| Week Change: 3.67% Year-to-date Change: -24.6% | |
| GCO Links: Profile News Message Board | |
| Charts:- Daily , Weekly | |
| Add GCO to Watchlist: View: Get Complete GCO Trend Analysis ➞ | |
 | HGV Hilton Grand Vacations Inc. |
| Sector: Services & Goods | |
| SubSector: Resorts & Casinos | |
| MarketCap: 1333.04 Millions | |
| Recent Price: 44.79 Smart Investing & Trading Score: 75 | |
| Day Percent Change: 0.34% Day Change: 0.15 | |
| Week Change: 3.66% Year-to-date Change: 11.5% | |
| HGV Links: Profile News Message Board | |
| Charts:- Daily , Weekly | |
| Add HGV to Watchlist: View: Get Complete HGV Trend Analysis ➞ | |
 | OMC Omnicom Group Inc. |
| Sector: Services & Goods | |
| SubSector: Advertising Agencies | |
| MarketCap: 11813.5 Millions | |
| Recent Price: 95.98 Smart Investing & Trading Score: 100 | |
| Day Percent Change: 1.87% Day Change: 1.76 | |
| Week Change: 3.63% Year-to-date Change: 11.0% | |
| OMC Links: Profile News Message Board | |
| Charts:- Daily , Weekly | |
| Add OMC to Watchlist: View: Get Complete OMC Trend Analysis ➞ | |
| For tabular summary view of above stock list: Summary View ➞ 0 - 25 , 25 - 50 , 50 - 75 , 75 - 100 , 100 - 125 , 125 - 150 , 150 - 175 , 175 - 200 , 200 - 225 , 225 - 250 , 250 - 275 , 275 - 300 , 300 - 325 , 325 - 350 , 350 - 375 , 375 - 400 , 400 - 425 , 425 - 450 , 450 - 475 | ||
| Click To Change The Sort Order: By Market Cap or Company Size Performance: Year-to-date, Week and Day | |
| Select Chart Type: | ||
|
Best Stocks Today 12Stocks.com |
© 2024 12Stocks.com Terms & Conditions Privacy Contact Us
All Information Provided Only For Education And Not To Be Used For Investing or Trading. See Terms & Conditions


One More Thing ... Get Best Stocks Delivered Daily!
Never Ever Miss A Move With Our Top Ten Stocks Lists
Find Best Stocks In Any Market - Bull or Bear Market
Take A Peek At Our Top Ten Stocks Lists: Daily, Weekly, Year-to-Date & Top Trends
Find Best Stocks In Any Market - Bull or Bear Market
Take A Peek At Our Top Ten Stocks Lists: Daily, Weekly, Year-to-Date & Top Trends
Consumer Services Stocks With Best Up Trends [0-bearish to 100-bullish]: Yatsen Holding[100], 1[100], Alibaba [100], MINISO [100], Omnicom [100], Avnet [100], Napco Security[100], ASGN [100], IMAX [100], Yum! Brands[100], Dillard s[100]
Best Consumer Services Stocks Year-to-Date:
U Power[3013.84%], Vroom [1807.84%], Yatsen Holding[479.55%], Fluent [301.49%], Codere Online[134.25%], Research[107.01%], Sweetgreen [92.21%], RealReal [71.64%], PaySign [60.71%], DXP Enterprises[54.04%], Bright Scholar[52%] Best Consumer Services Stocks This Week:
Chicken Soup[282.5%], Hibbett Sports[21.61%], Golden Heaven[20.85%], Yatsen Holding[17.29%], Baozun [14.66%], Jumia Technologies[14.21%], Zumiez [13.38%], Ameresco [13.24%], 1[12.87%], Pinduoduo [12.39%], K12 [11.85%] Best Consumer Services Stocks Daily:
Chicken Soup[264.29%], Golden Heaven[11.81%], K12 [8.64%], Yatsen Holding[7.89%], GameStop [7.58%], Dada Nexus[7.53%], iClick Interactive[7.35%], U Power[7.31%], 1[7.23%], Watsco [6.54%], Allego N.V[6.31%]