
 Login Sign Up


| |||||
 |  | ||||

| 12Stocks.com Market Intelligence |
Best Consumer Services Stocks
| In a hurry? Services & Goods Stocks: Performance Trends Table, Stock Charts
Sort Consumer Services: Daily, Weekly, Year-to-Date, Market Cap & Trends. Filter Services & Goods stocks list by size: All Large Mid-Range Small |
| 12Stocks.com Consumer Services Stocks Performances & Trends Daily | |||||||||
|
|  The overall Smart Investing & Trading Score is 23 (0-bearish to 100-bullish) which puts Consumer Services sector in short term bearish to neutral trend. The Smart Investing & Trading Score from previous trading session is 13 and hence an improvement of trend.
| ||||||||
Here are the Smart Investing & Trading Scores of the most requested Consumer Services stocks at 12Stocks.com (click stock name for detailed review):
|


| Consider signing up for our daily 12Stocks.com "Best Stocks Newsletter". You will never ever miss a big stock move again! |
| 12Stocks.com: Investing in Consumer Services sector with Stocks | |
|
The following table helps investors and traders sort through current performance and trends (as measured by Smart Investing & Trading Score) of various
stocks in the Consumer Services sector. Quick View: Move mouse or cursor over stock symbol (ticker) to view short-term Technical chart and over stock name to view long term chart. Click on  to add stock symbol to your watchlist and to add stock symbol to your watchlist and  to view watchlist. Click on any ticker or stock name for detailed market intelligence report for that stock. to view watchlist. Click on any ticker or stock name for detailed market intelligence report for that stock. |
12Stocks.com Performance of Stocks in Consumer Services Sector
| Ticker | Stock Name | Watchlist | Category | Recent Price | Smart Investing & Trading Score | Change % | YTD Change% |
| GCI | Gannett Co |   | Publishing | 2.56 | 100 | 2.40% | 11.30% |
| GAIA | Gaia | | Retail | 3.84 | 100 | 1.32% | 42.22% |
| GPC | Genuine Parts | | Auto Parts | 161.28 | 100 | 0.65% | 16.44% |
| IMAX | IMAX | | Entertainment | 17.15 | 100 | 0.23% | 14.18% |
| WISH | ContextLogic | | Internet Retail | 6.00 | 95 | 4.35% | 0.93% |
| BH | Biglari | | Restaurants | 198.99 | 95 | 1.23% | 20.65% |
| MYTE | MYT Netherlands | | Luxury Goods | 3.92 | 93 | 4.06% | 21.74% |
| ENV | Envestnet | | Services | 62.61 | 93 | 0.63% | 26.43% |
| FCN | FTI Consulting | | Services | 210.64 | 93 | 1.44% | 5.77% |
| BEDU | Bright Scholar | | Education | 2.10 | 90 | 11.70% | 68.00% |
| DFIN | Donnelley Financial | | Services | 62.94 | 90 | 1.99% | 0.91% |
| WINA | Winmark | | Retail | 370.09 | 90 | 1.12% | -11.37% |
| RSVR | Reservoir Media | | Entertainment | 8.00 | 88 | 2.43% | 12.29% |
| WEN | Wendy s | | Restaurants | 19.14 | 87 | 0.74% | -1.75% |
| WPP | WPP | | Advertising | 48.39 | 87 | 0.58% | 1.72% |
| EM | Smart Share | | Services | 0.65 | 86 | -0.61% | 26.21% |
| LE | Lands | | Retail | 12.82 | 83 | -0.62% | 34.10% |
| OB | Outbrain | | Internet Content & Information | 4.07 | 83 | 0.25% | -7.08% |
| WMK | Weis Markets | | Grocery | 63.48 | 80 | 1.31% | -0.75% |
| SEAT | Vivid Seats | | Internet Content & Information | 5.92 | 78 | 0.68% | -5.21% |
| MBLY | Mobileye Global | | Auto Parts | 31.08 | 78 | 0.45% | -28.33% |
| FLNT | Fluent | | Marketing | 2.60 | 76 | -4.41% | 288.06% |
| UCAR | U Power | | Auto & Truck Dealerships | 5.23 | 76 | -1.88% | NA |
| SFM | Sprouts Farmers | | Grocery | 64.40 | 76 | 2.06% | 33.86% |
| YSG | Yatsen Holding | | Specialty Retail | 3.62 | 76 | 0.98% | 394.12% |
| For chart view version of above stock list: Chart View ➞ 0 - 25 , 25 - 50 , 50 - 75 , 75 - 100 , 100 - 125 , 125 - 150 , 150 - 175 , 175 - 200 , 200 - 225 , 225 - 250 , 250 - 275 , 275 - 300 , 300 - 325 , 325 - 350 , 350 - 375 , 375 - 400 , 400 - 425 , 425 - 450 , 450 - 475 | ||
 | Click To Change The Sort Order: By Market Cap or Company Size Performance: Year-to-date, Week and Day |  |
|
Get the most comprehensive stock market coverage daily at 12Stocks.com ➞ Best Stocks Today ➞ Best Stocks Weekly ➞ Best Stocks Year-to-Date ➞ Best Stocks Trends ➞  Best Stocks Today 12Stocks.com Best Nasdaq Stocks ➞ Best S&P 500 Stocks ➞ Best Tech Stocks ➞ Best Biotech Stocks ➞ |
| Detailed Overview of Consumer Services Stocks |
| Consumer Services Technical Overview, Leaders & Laggards, Top Consumer Services ETF Funds & Detailed Consumer Services Stocks List, Charts, Trends & More |
| Consumer Services Sector: Technical Analysis, Trends & YTD Performance | |
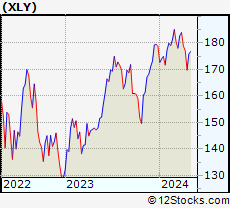
| Consumer Services sector is composed of stocks
from retail, entertainment, media/publishing, consumer goods
and services subsectors. Consumer Services sector, as represented by XLY, an exchange-traded fund [ETF] that holds basket of Consumer Services stocks (e.g, Walmart, Alibaba) is down by -4.39% and is currently underperforming the overall market by -8.47% year-to-date. Below is a quick view of Technical charts and trends: |
|
 XLY Weekly Chart |
|
| Long Term Trend: Good | |
| Medium Term Trend: Not Good | |
 XLY Daily Chart |
|
| Short Term Trend: Not Good | |
| Overall Trend Score: 23 | |
| YTD Performance: -4.39% | |
| **Trend Scores & Views Are Only For Educational Purposes And Not For Investing | |
| 12Stocks.com: Top Performing Consumer Services Sector Stocks | ||||||||||||||||||||||||||||||||||||||||||||||||
 The top performing Consumer Services sector stocks year to date are
Now, more recently, over last week, the top performing Consumer Services sector stocks on the move are


|
||||||||||||||||||||||||||||||||||||||||||||||||
| 12Stocks.com: Investing in Consumer Services Sector using Exchange Traded Funds | |
|
The following table shows list of key exchange traded funds (ETF) that
help investors track Consumer Services Index. For detailed view, check out our ETF Funds section of our website. Quick View: Move mouse or cursor over ETF symbol (ticker) to view short-term Technical chart and over ETF name to view long term chart. Click on ticker or stock name for detailed view. Click on to add stock symbol to your watchlist and to view watchlist. |
12Stocks.com List of ETFs that track Consumer Services Index
| Ticker | ETF Name | Watchlist | Recent Price | Smart Investing & Trading Score | Change % | Week % | Year-to-date % |
| XLY | Consumer Discret Sel | | 170.96 | 23 | -0.18 | -3.47 | -4.39% |
| RTH | Retail | | 198.72 | 44 | 0.05 | -1.47 | 5.57% |
| XRT | Retail | | 71.02 | 51 | 0.47 | -1.2 | -1.8% |
| UCC | Consumer Services | | 32.26 | 33 | -1.16 | -6.3 | -10.16% |
| RXI | Globl Consumer Discretionary | | 157.08 | 44 | -0.24 | -2.31 | -1.25% |
| SCC | Short Consumer Services | | 16.71 | 82 | 0.66 | 7.34 | 9.05% |
| UGE | Consumer Goods | | 16.28 | 73 | 0.13 | 0.57 | 3.43% |
| 12Stocks.com: Charts, Trends, Fundamental Data and Performances of Consumer Services Stocks | |
|
We now take in-depth look at all Consumer Services stocks including charts, multi-period performances and overall trends (as measured by Smart Investing & Trading Score). One can sort Consumer Services stocks (click link to choose) by Daily, Weekly and by Year-to-Date performances. Also, one can sort by size of the company or by market capitalization. |
| Select Your Default Chart Type: | |||||
| |||||
| Click on stock symbol or name for detailed view. Click on to add stock symbol to your watchlist and to view watchlist. Quick View: Move mouse or cursor over "Daily" to quickly view daily Technical stock chart and over "Weekly" to view weekly Technical stock chart. | |||||

 | GCI Gannett Co., Inc. |
| Sector: Services & Goods | |
| SubSector: Publishing - Newspapers | |
| MarketCap: 222.322 Millions | |
| Recent Price: 2.56 Smart Investing & Trading Score: 100 | |
| Day Percent Change: 2.40% Day Change: 0.06 | |
| Week Change: 7.56% Year-to-date Change: 11.3% | |
| GCI Links: Profile News Message Board | |
| Charts:- Daily , Weekly | |
| Add GCI to Watchlist: View: Get Complete GCI Trend Analysis ➞ | |
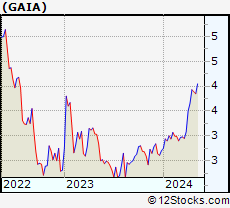 | GAIA Gaia, Inc. |
| Sector: Services & Goods | |
| SubSector: Catalog & Mail Order Houses | |
| MarketCap: 130.592 Millions | |
| Recent Price: 3.84 Smart Investing & Trading Score: 100 | |
| Day Percent Change: 1.32% Day Change: 0.05 | |
| Week Change: 5.06% Year-to-date Change: 42.2% | |
| GAIA Links: Profile News Message Board | |
| Charts:- Daily , Weekly | |
| Add GAIA to Watchlist: View: Get Complete GAIA Trend Analysis ➞ | |
 | GPC Genuine Parts Company |
| Sector: Services & Goods | |
| SubSector: Auto Parts Stores | |
| MarketCap: 8605.9 Millions | |
| Recent Price: 161.28 Smart Investing & Trading Score: 100 | |
| Day Percent Change: 0.65% Day Change: 1.05 | |
| Week Change: 10.93% Year-to-date Change: 16.4% | |
| GPC Links: Profile News Message Board | |
| Charts:- Daily , Weekly | |
| Add GPC to Watchlist: View: Get Complete GPC Trend Analysis ➞ | |
 | IMAX IMAX Corporation |
| Sector: Services & Goods | |
| SubSector: Entertainment - Diversified | |
| MarketCap: 874.237 Millions | |
| Recent Price: 17.15 Smart Investing & Trading Score: 100 | |
| Day Percent Change: 0.23% Day Change: 0.04 | |
| Week Change: 4.38% Year-to-date Change: 14.2% | |
| IMAX Links: Profile News Message Board | |
| Charts:- Daily , Weekly | |
| Add IMAX to Watchlist: View: Get Complete IMAX Trend Analysis ➞ | |
 | WISH ContextLogic Inc. |
| Sector: Services & Goods | |
| SubSector: Internet Retail | |
| MarketCap: 165 Millions | |
| Recent Price: 6.00 Smart Investing & Trading Score: 95 | |
| Day Percent Change: 4.35% Day Change: 0.25 | |
| Week Change: 20% Year-to-date Change: 0.9% | |
| WISH Links: Profile News Message Board | |
| Charts:- Daily , Weekly | |
| Add WISH to Watchlist: View: Get Complete WISH Trend Analysis ➞ | |
 | BH Biglari Holdings Inc. |
| Sector: Services & Goods | |
| SubSector: Restaurants | |
| MarketCap: 149.07 Millions | |
| Recent Price: 198.99 Smart Investing & Trading Score: 95 | |
| Day Percent Change: 1.23% Day Change: 2.42 | |
| Week Change: 4.15% Year-to-date Change: 20.7% | |
| BH Links: Profile News Message Board | |
| Charts:- Daily , Weekly | |
| Add BH to Watchlist: View: Get Complete BH Trend Analysis ➞ | |
 | MYTE MYT Netherlands Parent B.V. |
| Sector: Services & Goods | |
| SubSector: Luxury Goods | |
| MarketCap: 330 Millions | |
| Recent Price: 3.92 Smart Investing & Trading Score: 93 | |
| Day Percent Change: 4.06% Day Change: 0.15 | |
| Week Change: 7.4% Year-to-date Change: 21.7% | |
| MYTE Links: Profile News Message Board | |
| Charts:- Daily , Weekly | |
| Add MYTE to Watchlist: View: Get Complete MYTE Trend Analysis ➞ | |
 | ENV Envestnet, Inc. |
| Sector: Services & Goods | |
| SubSector: Business Services | |
| MarketCap: 3114.02 Millions | |
| Recent Price: 62.61 Smart Investing & Trading Score: 93 | |
| Day Percent Change: 0.63% Day Change: 0.39 | |
| Week Change: 9.27% Year-to-date Change: 26.4% | |
| ENV Links: Profile News Message Board | |
| Charts:- Daily , Weekly | |
| Add ENV to Watchlist: View: Get Complete ENV Trend Analysis ➞ | |
 | FCN FTI Consulting, Inc. |
| Sector: Services & Goods | |
| SubSector: Management Services | |
| MarketCap: 4485.05 Millions | |
| Recent Price: 210.64 Smart Investing & Trading Score: 93 | |
| Day Percent Change: 1.44% Day Change: 3.00 | |
| Week Change: 2.36% Year-to-date Change: 5.8% | |
| FCN Links: Profile News Message Board | |
| Charts:- Daily , Weekly | |
| Add FCN to Watchlist: View: Get Complete FCN Trend Analysis ➞ | |
 | BEDU Bright Scholar Education Holdings Limited |
| Sector: Services & Goods | |
| SubSector: Education & Training Services | |
| MarketCap: 792.406 Millions | |
| Recent Price: 2.10 Smart Investing & Trading Score: 90 | |
| Day Percent Change: 11.70% Day Change: 0.22 | |
| Week Change: 14.13% Year-to-date Change: 68.0% | |
| BEDU Links: Profile News Message Board | |
| Charts:- Daily , Weekly | |
| Add BEDU to Watchlist: View: Get Complete BEDU Trend Analysis ➞ | |
 | DFIN Donnelley Financial Solutions, Inc. |
| Sector: Services & Goods | |
| SubSector: Business Services | |
| MarketCap: 229.882 Millions | |
| Recent Price: 62.94 Smart Investing & Trading Score: 90 | |
| Day Percent Change: 1.99% Day Change: 1.23 | |
| Week Change: 1.27% Year-to-date Change: 0.9% | |
| DFIN Links: Profile News Message Board | |
| Charts:- Daily , Weekly | |
| Add DFIN to Watchlist: View: Get Complete DFIN Trend Analysis ➞ | |
 | WINA Winmark Corporation |
| Sector: Services & Goods | |
| SubSector: Specialty Retail, Other | |
| MarketCap: 520.444 Millions | |
| Recent Price: 370.09 Smart Investing & Trading Score: 90 | |
| Day Percent Change: 1.12% Day Change: 4.09 | |
| Week Change: 7.71% Year-to-date Change: -11.4% | |
| WINA Links: Profile News Message Board | |
| Charts:- Daily , Weekly | |
| Add WINA to Watchlist: View: Get Complete WINA Trend Analysis ➞ | |
 | RSVR Reservoir Media, Inc. |
| Sector: Services & Goods | |
| SubSector: Entertainment | |
| MarketCap: 389 Millions | |
| Recent Price: 8.00 Smart Investing & Trading Score: 88 | |
| Day Percent Change: 2.43% Day Change: 0.19 | |
| Week Change: 2.9% Year-to-date Change: 12.3% | |
| RSVR Links: Profile News Message Board | |
| Charts:- Daily , Weekly | |
| Add RSVR to Watchlist: View: Get Complete RSVR Trend Analysis ➞ | |
 | WEN The Wendy s Company |
| Sector: Services & Goods | |
| SubSector: Restaurants | |
| MarketCap: 2814.9 Millions | |
| Recent Price: 19.14 Smart Investing & Trading Score: 87 | |
| Day Percent Change: 0.74% Day Change: 0.14 | |
| Week Change: 2.9% Year-to-date Change: -1.8% | |
| WEN Links: Profile News Message Board | |
| Charts:- Daily , Weekly | |
| Add WEN to Watchlist: View: Get Complete WEN Trend Analysis ➞ | |
 | WPP WPP plc |
| Sector: Services & Goods | |
| SubSector: Advertising Agencies | |
| MarketCap: 7840.25 Millions | |
| Recent Price: 48.39 Smart Investing & Trading Score: 87 | |
| Day Percent Change: 0.58% Day Change: 0.28 | |
| Week Change: 1.9% Year-to-date Change: 1.7% | |
| WPP Links: Profile News Message Board | |
| Charts:- Daily , Weekly | |
| Add WPP to Watchlist: View: Get Complete WPP Trend Analysis ➞ | |
 | EM Smart Share Global Limited |
| Sector: Services & Goods | |
| SubSector: Personal Services | |
| MarketCap: 238 Millions | |
| Recent Price: 0.65 Smart Investing & Trading Score: 86 | |
| Day Percent Change: -0.61% Day Change: 0.00 | |
| Week Change: 9.26% Year-to-date Change: 26.2% | |
| EM Links: Profile News Message Board | |
| Charts:- Daily , Weekly | |
| Add EM to Watchlist: View: Get Complete EM Trend Analysis ➞ | |
 | LE Lands End, Inc. |
| Sector: Services & Goods | |
| SubSector: Catalog & Mail Order Houses | |
| MarketCap: 268.692 Millions | |
| Recent Price: 12.82 Smart Investing & Trading Score: 83 | |
| Day Percent Change: -0.62% Day Change: -0.08 | |
| Week Change: -0.39% Year-to-date Change: 34.1% | |
| LE Links: Profile News Message Board | |
| Charts:- Daily , Weekly | |
| Add LE to Watchlist: View: Get Complete LE Trend Analysis ➞ | |
 | OB Outbrain Inc. |
| Sector: Services & Goods | |
| SubSector: Internet Content & Information | |
| MarketCap: 250 Millions | |
| Recent Price: 4.07 Smart Investing & Trading Score: 83 | |
| Day Percent Change: 0.25% Day Change: 0.01 | |
| Week Change: -0.49% Year-to-date Change: -7.1% | |
| OB Links: Profile News Message Board | |
| Charts:- Daily , Weekly | |
| Add OB to Watchlist: View: Get Complete OB Trend Analysis ➞ | |
 | WMK Weis Markets, Inc. |
| Sector: Services & Goods | |
| SubSector: Grocery Stores | |
| MarketCap: 1148.75 Millions | |
| Recent Price: 63.48 Smart Investing & Trading Score: 80 | |
| Day Percent Change: 1.31% Day Change: 0.82 | |
| Week Change: 3.05% Year-to-date Change: -0.8% | |
| WMK Links: Profile News Message Board | |
| Charts:- Daily , Weekly | |
| Add WMK to Watchlist: View: Get Complete WMK Trend Analysis ➞ | |
 | SEAT Vivid Seats Inc. |
| Sector: Services & Goods | |
| SubSector: Internet Content & Information | |
| MarketCap: 1560 Millions | |
| Recent Price: 5.92 Smart Investing & Trading Score: 78 | |
| Day Percent Change: 0.68% Day Change: 0.04 | |
| Week Change: 3.95% Year-to-date Change: -5.2% | |
| SEAT Links: Profile News Message Board | |
| Charts:- Daily , Weekly | |
| Add SEAT to Watchlist: View: Get Complete SEAT Trend Analysis ➞ | |
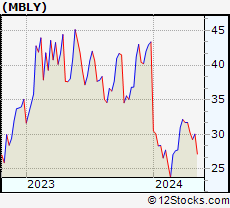 | MBLY Mobileye Global Inc. |
| Sector: Services & Goods | |
| SubSector: Auto Parts | |
| MarketCap: 31280 Millions | |
| Recent Price: 31.08 Smart Investing & Trading Score: 78 | |
| Day Percent Change: 0.45% Day Change: 0.14 | |
| Week Change: -2.02% Year-to-date Change: -28.3% | |
| MBLY Links: Profile News Message Board | |
| Charts:- Daily , Weekly | |
| Add MBLY to Watchlist: View: Get Complete MBLY Trend Analysis ➞ | |
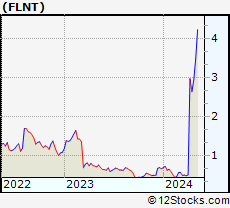 | FLNT Fluent, Inc. |
| Sector: Services & Goods | |
| SubSector: Marketing Services | |
| MarketCap: 110.015 Millions | |
| Recent Price: 2.60 Smart Investing & Trading Score: 76 | |
| Day Percent Change: -4.41% Day Change: -0.12 | |
| Week Change: -12.62% Year-to-date Change: 288.1% | |
| FLNT Links: Profile News Message Board | |
| Charts:- Daily , Weekly | |
| Add FLNT to Watchlist: View: Get Complete FLNT Trend Analysis ➞ | |
 | UCAR U Power Limited |
| Sector: Services & Goods | |
| SubSector: Auto & Truck Dealerships | |
| MarketCap: 372 Millions | |
| Recent Price: 5.23 Smart Investing & Trading Score: 76 | |
| Day Percent Change: -1.88% Day Change: -0.10 | |
| Week Change: 2.55% Year-to-date Change: 2,818.5% | |
| UCAR Links: Profile News Message Board | |
| Charts:- Daily , Weekly | |
| Add UCAR to Watchlist: View: Get Complete UCAR Trend Analysis ➞ | |
 | SFM Sprouts Farmers Market, Inc. |
| Sector: Services & Goods | |
| SubSector: Grocery Stores | |
| MarketCap: 2495.85 Millions | |
| Recent Price: 64.40 Smart Investing & Trading Score: 76 | |
| Day Percent Change: 2.06% Day Change: 1.30 | |
| Week Change: 3.04% Year-to-date Change: 33.9% | |
| SFM Links: Profile News Message Board | |
| Charts:- Daily , Weekly | |
| Add SFM to Watchlist: View: Get Complete SFM Trend Analysis ➞ | |
 | YSG Yatsen Holding Limited |
| Sector: Services & Goods | |
| SubSector: Specialty Retail | |
| MarketCap: 11827 Millions | |
| Recent Price: 3.62 Smart Investing & Trading Score: 76 | |
| Day Percent Change: 0.98% Day Change: 0.04 | |
| Week Change: 20.1% Year-to-date Change: 394.1% | |
| YSG Links: Profile News Message Board | |
| Charts:- Daily , Weekly | |
| Add YSG to Watchlist: View: Get Complete YSG Trend Analysis ➞ | |
| For tabular summary view of above stock list: Summary View ➞ 0 - 25 , 25 - 50 , 50 - 75 , 75 - 100 , 100 - 125 , 125 - 150 , 150 - 175 , 175 - 200 , 200 - 225 , 225 - 250 , 250 - 275 , 275 - 300 , 300 - 325 , 325 - 350 , 350 - 375 , 375 - 400 , 400 - 425 , 425 - 450 , 450 - 475 | ||
| Click To Change The Sort Order: By Market Cap or Company Size Performance: Year-to-date, Week and Day | |
| Select Chart Type: | ||
|
Best Stocks Today 12Stocks.com |
© 2024 12Stocks.com Terms & Conditions Privacy Contact Us
All Information Provided Only For Education And Not To Be Used For Investing or Trading. See Terms & Conditions


One More Thing ... Get Best Stocks Delivered Daily!
Never Ever Miss A Move With Our Top Ten Stocks Lists
Find Best Stocks In Any Market - Bull or Bear Market
Take A Peek At Our Top Ten Stocks Lists: Daily, Weekly, Year-to-Date & Top Trends
Find Best Stocks In Any Market - Bull or Bear Market
Take A Peek At Our Top Ten Stocks Lists: Daily, Weekly, Year-to-Date & Top Trends
Consumer Services Stocks With Best Up Trends [0-bearish to 100-bullish]: Gannett Co[100], Gaia [100], Genuine Parts[100], IMAX [100], ContextLogic [95], Biglari [95], MYT Netherlands[93], Envestnet [93], FTI Consulting[93], Bright Scholar[90], Donnelley Financial[90]
Best Consumer Services Stocks Year-to-Date:
U Power[2818.53%], Vroom [1713.36%], Yatsen Holding[394.12%], Fluent [288.06%], Codere Online[138.01%], Research[96.93%], Sweetgreen [86.02%], Bright Scholar[68%], RealReal [57.96%], PaySign [52.5%], DXP Enterprises[50.45%] Best Consumer Services Stocks This Week:
Yatsen Holding[20.1%], ContextLogic [20%], AMC Entertainment[17.36%], Secoo Holding[15.24%], Bright Scholar[14.13%], E.W. Scripps[12.5%], Genuine Parts[10.93%], Advance Auto[10.04%], Envestnet [9.27%], Smart Share[9.26%], Altisource Portfolio[8.45%] Best Consumer Services Stocks Daily:
Bright Scholar[11.70%], Vision Marine[7.40%], Lanvin [6.99%], AMC Entertainment[6.51%], Allbirds [5.72%], GreenTree Hospitality[4.56%], E.W. Scripps[4.35%], ContextLogic [4.35%], Altisource Portfolio[4.22%], MYT Netherlands[4.06%], Allego N.V[3.96%]