
 Login Sign Up


| |||||
 |  | ||||

| 12Stocks.com Market Intelligence |
Best Consumer Services Stocks
| In a hurry? Services & Goods Stocks: Performance Trends Table, Stock Charts
Sort Consumer Services: Daily, Weekly, Year-to-Date, Market Cap & Trends. Filter Services & Goods stocks list by size: All Large Mid-Range Small |
| 12Stocks.com Consumer Services Stocks Performances & Trends Daily | |||||||||
|
|  The overall Smart Investing & Trading Score is 58 (0-bearish to 100-bullish) which puts Consumer Services sector in short term neutral trend. The Smart Investing & Trading Score from previous trading session is 23 and an improvement of trend continues.
| ||||||||
Here are the Smart Investing & Trading Scores of the most requested Consumer Services stocks at 12Stocks.com (click stock name for detailed review):
|


| Consider signing up for our daily 12Stocks.com "Best Stocks Newsletter". You will never ever miss a big stock move again! |
| 12Stocks.com: Investing in Consumer Services sector with Stocks | |
|
The following table helps investors and traders sort through current performance and trends (as measured by Smart Investing & Trading Score) of various
stocks in the Consumer Services sector. Quick View: Move mouse or cursor over stock symbol (ticker) to view short-term Technical chart and over stock name to view long term chart. Click on  to add stock symbol to your watchlist and to add stock symbol to your watchlist and  to view watchlist. Click on any ticker or stock name for detailed market intelligence report for that stock. to view watchlist. Click on any ticker or stock name for detailed market intelligence report for that stock. |
12Stocks.com Performance of Stocks in Consumer Services Sector
| Ticker | Stock Name | Watchlist | Category | Recent Price | Smart Investing & Trading Score | Change % | Weekly Change% |
| MCD | McDonald s |   | Restaurants | 276.75 | 57 | -0.05% | 1.75% |
| MCO | Moody s | | Services | 381.21 | 42 | -0.25% | 1.75% |
| BATRA | Liberty Braves | | Broadcasting | 40.99 | 35 | -0.49% | 1.74% |
| PRAA | PRA | | Services | 24.79 | 75 | -0.52% | 1.72% |
| PSO | Pearson | | Publishing | 12.51 | 58 | -1.03% | 1.71% |
| OSW | OneSpaWorld | | Casinos | 12.52 | 42 | 0.72% | 1.71% |
| GTN | Gray Television | | Broadcasting | 6.02 | 52 | 1.69% | 1.69% |
| CASY | Casey s | | Grocery | 315.64 | 71 | 0.74% | 1.68% |
| IGT | Game | | Gaming | 20.54 | 49 | 0.15% | 1.68% |
| BJRI | BJ s | | Restaurants | 32.64 | 37 | 0.15% | 1.68% |
| GOLF | Acushnet | | Retail | 63.16 | 55 | -2.58% | 1.67% |
| GWW | W.W. Grainger | | Equipment | 958.32 | 58 | 0.26% | 1.66% |
| SIX | Six Flags | | Entertainment | 23.84 | 25 | -0.50% | 1.66% |
| NYT | New York | | Publishing | 43.30 | 57 | 0.19% | 1.64% |
| GAMB | Gambling.com | | Gambling | 8.84 | 25 | -0.45% | 1.61% |
| TRI | Thomson Reuters | | Publishing | 152.63 | 76 | -0.63% | 1.60% |
| FYBR | Frontier | | Telecom Services | 22.05 | 22 | -3.61% | 1.59% |
| LQDT | Liquidity Services | | Retail | 17.32 | 25 | -0.06% | 1.58% |
| BAH | Booz Allen | | Services | 144.39 | 65 | -1.08% | 1.58% |
| RERE | ATRenew | | Internet Retail | 1.61 | 46 | 1.58% | 1.58% |
| EBAY | eBay | | Retail | 51.18 | 68 | -0.14% | 1.57% |
| FWONK | Formula One | | Broadcasting | 69.15 | 93 | -0.76% | 1.57% |
| RRGB | Red Robin | | Restaurants | 6.50 | 57 | -1.52% | 1.56% |
| GDEN | Golden Entertainment | | Casinos | 34.50 | 52 | -1.03% | 1.56% |
| FOX | Twenty-First Century | | Entertainment | 29.31 | 74 | 0.45% | 1.52% |
| For chart view version of above stock list: Chart View ➞ 0 - 25 , 25 - 50 , 50 - 75 , 75 - 100 , 100 - 125 , 125 - 150 , 150 - 175 , 175 - 200 , 200 - 225 , 225 - 250 , 250 - 275 , 275 - 300 , 300 - 325 , 325 - 350 , 350 - 375 , 375 - 400 , 400 - 425 , 425 - 450 , 450 - 475 | ||
 | Click To Change The Sort Order: By Market Cap or Company Size Performance: Year-to-date, Week and Day |  |
|
Get the most comprehensive stock market coverage daily at 12Stocks.com ➞ Best Stocks Today ➞ Best Stocks Weekly ➞ Best Stocks Year-to-Date ➞ Best Stocks Trends ➞  Best Stocks Today 12Stocks.com Best Nasdaq Stocks ➞ Best S&P 500 Stocks ➞ Best Tech Stocks ➞ Best Biotech Stocks ➞ |
| Detailed Overview of Consumer Services Stocks |
| Consumer Services Technical Overview, Leaders & Laggards, Top Consumer Services ETF Funds & Detailed Consumer Services Stocks List, Charts, Trends & More |
| Consumer Services Sector: Technical Analysis, Trends & YTD Performance | |
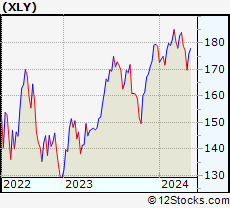
| Consumer Services sector is composed of stocks
from retail, entertainment, media/publishing, consumer goods
and services subsectors. Consumer Services sector, as represented by XLY, an exchange-traded fund [ETF] that holds basket of Consumer Services stocks (e.g, Walmart, Alibaba) is down by -2.58% and is currently underperforming the overall market by -8.24% year-to-date. Below is a quick view of Technical charts and trends: |
|
 XLY Weekly Chart |
|
| Long Term Trend: Good | |
| Medium Term Trend: Not Good | |
 XLY Daily Chart |
|
| Short Term Trend: Very Good | |
| Overall Trend Score: 58 | |
| YTD Performance: -2.58% | |
| **Trend Scores & Views Are Only For Educational Purposes And Not For Investing | |
| 12Stocks.com: Top Performing Consumer Services Sector Stocks | ||||||||||||||||||||||||||||||||||||||||||||||||
 The top performing Consumer Services sector stocks year to date are
Now, more recently, over last week, the top performing Consumer Services sector stocks on the move are


|
||||||||||||||||||||||||||||||||||||||||||||||||
| 12Stocks.com: Investing in Consumer Services Sector using Exchange Traded Funds | |
|
The following table shows list of key exchange traded funds (ETF) that
help investors track Consumer Services Index. For detailed view, check out our ETF Funds section of our website. Quick View: Move mouse or cursor over ETF symbol (ticker) to view short-term Technical chart and over ETF name to view long term chart. Click on ticker or stock name for detailed view. Click on to add stock symbol to your watchlist and to view watchlist. |
12Stocks.com List of ETFs that track Consumer Services Index
| Ticker | ETF Name | Watchlist | Recent Price | Smart Investing & Trading Score | Change % | Week % | Year-to-date % |
| XLY | Consumer Discret Sel | | 174.19 | 58 | 0.96 | 2.61 | -2.58% |
| RTH | Retail | | 199.79 | 44 | -0.35 | 0.58 | 6.14% |
| IYC | Consumer Services | | 77.83 | 43 | 0.31 | 2.05 | 2.72% |
| XRT | Retail | | 72.52 | 65 | -0.71 | 1.9 | 0.28% |
| IYK | Consumer Goods | | 67.20 | 75 | 0.99 | 2.11 | 5.16% |
| UCC | Consumer Services | | 33.37 | 73 | 2.12 | 5.68 | -7.07% |
| RETL | Retail Bull 3X | | 8.59 | 48 | -1.60 | 5.79 | -5.81% |
| RXI | Globl Consumer Discretionary | | 160.29 | 43 | 0.63 | 2 | 0.77% |
| SCC | Short Consumer Services | | 16.12 | 35 | -1.86 | -4.92 | 5.2% |
| UGE | Consumer Goods | | 17.24 | 90 | 1.23 | 3.68 | 9.52% |
| 12Stocks.com: Charts, Trends, Fundamental Data and Performances of Consumer Services Stocks | |
|
We now take in-depth look at all Consumer Services stocks including charts, multi-period performances and overall trends (as measured by Smart Investing & Trading Score). One can sort Consumer Services stocks (click link to choose) by Daily, Weekly and by Year-to-Date performances. Also, one can sort by size of the company or by market capitalization. |
| Select Your Default Chart Type: | |||||
| |||||
| Click on stock symbol or name for detailed view. Click on to add stock symbol to your watchlist and to view watchlist. Quick View: Move mouse or cursor over "Daily" to quickly view daily Technical stock chart and over "Weekly" to view weekly Technical stock chart. | |||||

 | MCD McDonald s Corporation |
| Sector: Services & Goods | |
| SubSector: Restaurants | |
| MarketCap: 122481 Millions | |
| Recent Price: 276.75 Smart Investing & Trading Score: 57 | |
| Day Percent Change: -0.05% Day Change: -0.13 | |
| Week Change: 1.75% Year-to-date Change: -6.7% | |
| MCD Links: Profile News Message Board | |
| Charts:- Daily , Weekly | |
| Add MCD to Watchlist: View: Get Complete MCD Trend Analysis ➞ | |
 | MCO Moody s Corporation |
| Sector: Services & Goods | |
| SubSector: Business Services | |
| MarketCap: 35998.5 Millions | |
| Recent Price: 381.21 Smart Investing & Trading Score: 42 | |
| Day Percent Change: -0.25% Day Change: -0.96 | |
| Week Change: 1.75% Year-to-date Change: -2.4% | |
| MCO Links: Profile News Message Board | |
| Charts:- Daily , Weekly | |
| Add MCO to Watchlist: View: Get Complete MCO Trend Analysis ➞ | |
 | BATRA The Liberty Braves Group |
| Sector: Services & Goods | |
| SubSector: Broadcasting - TV | |
| MarketCap: 18873.5 Millions | |
| Recent Price: 40.99 Smart Investing & Trading Score: 35 | |
| Day Percent Change: -0.49% Day Change: -0.20 | |
| Week Change: 1.74% Year-to-date Change: -4.2% | |
| BATRA Links: Profile News Message Board | |
| Charts:- Daily , Weekly | |
| Add BATRA to Watchlist: View: Get Complete BATRA Trend Analysis ➞ | |
 | PRAA PRA Group, Inc. |
| Sector: Services & Goods | |
| SubSector: Business Services | |
| MarketCap: 1290.32 Millions | |
| Recent Price: 24.79 Smart Investing & Trading Score: 75 | |
| Day Percent Change: -0.52% Day Change: -0.13 | |
| Week Change: 1.72% Year-to-date Change: -5.4% | |
| PRAA Links: Profile News Message Board | |
| Charts:- Daily , Weekly | |
| Add PRAA to Watchlist: View: Get Complete PRAA Trend Analysis ➞ | |
 | PSO Pearson plc |
| Sector: Services & Goods | |
| SubSector: Publishing - Books | |
| MarketCap: 4595.42 Millions | |
| Recent Price: 12.51 Smart Investing & Trading Score: 58 | |
| Day Percent Change: -1.03% Day Change: -0.13 | |
| Week Change: 1.71% Year-to-date Change: 1.8% | |
| PSO Links: Profile News Message Board | |
| Charts:- Daily , Weekly | |
| Add PSO to Watchlist: View: Get Complete PSO Trend Analysis ➞ | |
 | OSW OneSpaWorld Holdings Limited |
| Sector: Services & Goods | |
| SubSector: Resorts & Casinos | |
| MarketCap: 228.394 Millions | |
| Recent Price: 12.52 Smart Investing & Trading Score: 42 | |
| Day Percent Change: 0.72% Day Change: 0.09 | |
| Week Change: 1.71% Year-to-date Change: -11.2% | |
| OSW Links: Profile News Message Board | |
| Charts:- Daily , Weekly | |
| Add OSW to Watchlist: View: Get Complete OSW Trend Analysis ➞ | |
 | GTN Gray Television, Inc. |
| Sector: Services & Goods | |
| SubSector: Broadcasting - TV | |
| MarketCap: 1144.63 Millions | |
| Recent Price: 6.02 Smart Investing & Trading Score: 52 | |
| Day Percent Change: 1.69% Day Change: 0.10 | |
| Week Change: 1.69% Year-to-date Change: -32.8% | |
| GTN Links: Profile News Message Board | |
| Charts:- Daily , Weekly | |
| Add GTN to Watchlist: View: Get Complete GTN Trend Analysis ➞ | |
 | CASY Casey s General Stores, Inc. |
| Sector: Services & Goods | |
| SubSector: Grocery Stores | |
| MarketCap: 5787.95 Millions | |
| Recent Price: 315.64 Smart Investing & Trading Score: 71 | |
| Day Percent Change: 0.74% Day Change: 2.32 | |
| Week Change: 1.68% Year-to-date Change: 14.9% | |
| CASY Links: Profile News Message Board | |
| Charts:- Daily , Weekly | |
| Add CASY to Watchlist: View: Get Complete CASY Trend Analysis ➞ | |
 | IGT International Game Technology PLC |
| Sector: Services & Goods | |
| SubSector: Gaming Activities | |
| MarketCap: 1030.89 Millions | |
| Recent Price: 20.54 Smart Investing & Trading Score: 49 | |
| Day Percent Change: 0.15% Day Change: 0.03 | |
| Week Change: 1.68% Year-to-date Change: -25.1% | |
| IGT Links: Profile News Message Board | |
| Charts:- Daily , Weekly | |
| Add IGT to Watchlist: View: Get Complete IGT Trend Analysis ➞ | |
 | BJRI BJ s Restaurants, Inc. |
| Sector: Services & Goods | |
| SubSector: Restaurants | |
| MarketCap: 183.67 Millions | |
| Recent Price: 32.64 Smart Investing & Trading Score: 37 | |
| Day Percent Change: 0.15% Day Change: 0.05 | |
| Week Change: 1.68% Year-to-date Change: -9.4% | |
| BJRI Links: Profile News Message Board | |
| Charts:- Daily , Weekly | |
| Add BJRI to Watchlist: View: Get Complete BJRI Trend Analysis ➞ | |
 | GOLF Acushnet Holdings Corp. |
| Sector: Services & Goods | |
| SubSector: Sporting Goods Stores | |
| MarketCap: 1717.74 Millions | |
| Recent Price: 63.16 Smart Investing & Trading Score: 55 | |
| Day Percent Change: -2.58% Day Change: -1.67 | |
| Week Change: 1.67% Year-to-date Change: 0.0% | |
| GOLF Links: Profile News Message Board | |
| Charts:- Daily , Weekly | |
| Add GOLF to Watchlist: View: Get Complete GOLF Trend Analysis ➞ | |
 | GWW W.W. Grainger, Inc. |
| Sector: Services & Goods | |
| SubSector: Industrial Equipment Wholesale | |
| MarketCap: 12794.8 Millions | |
| Recent Price: 958.32 Smart Investing & Trading Score: 58 | |
| Day Percent Change: 0.26% Day Change: 2.53 | |
| Week Change: 1.66% Year-to-date Change: 15.6% | |
| GWW Links: Profile News Message Board | |
| Charts:- Daily , Weekly | |
| Add GWW to Watchlist: View: Get Complete GWW Trend Analysis ➞ | |
 | SIX Six Flags Entertainment Corporation |
| Sector: Services & Goods | |
| SubSector: General Entertainment | |
| MarketCap: 1282.69 Millions | |
| Recent Price: 23.84 Smart Investing & Trading Score: 25 | |
| Day Percent Change: -0.50% Day Change: -0.12 | |
| Week Change: 1.66% Year-to-date Change: -4.9% | |
| SIX Links: Profile News Message Board | |
| Charts:- Daily , Weekly | |
| Add SIX to Watchlist: View: Get Complete SIX Trend Analysis ➞ | |
 | NYT The New York Times Company |
| Sector: Services & Goods | |
| SubSector: Publishing - Newspapers | |
| MarketCap: 5188.22 Millions | |
| Recent Price: 43.30 Smart Investing & Trading Score: 57 | |
| Day Percent Change: 0.19% Day Change: 0.08 | |
| Week Change: 1.64% Year-to-date Change: -11.6% | |
| NYT Links: Profile News Message Board | |
| Charts:- Daily , Weekly | |
| Add NYT to Watchlist: View: Get Complete NYT Trend Analysis ➞ | |
 | GAMB Gambling.com Group Limited |
| Sector: Services & Goods | |
| SubSector: Gambling | |
| MarketCap: 376 Millions | |
| Recent Price: 8.84 Smart Investing & Trading Score: 25 | |
| Day Percent Change: -0.45% Day Change: -0.04 | |
| Week Change: 1.61% Year-to-date Change: -9.4% | |
| GAMB Links: Profile News Message Board | |
| Charts:- Daily , Weekly | |
| Add GAMB to Watchlist: View: Get Complete GAMB Trend Analysis ➞ | |
 | TRI Thomson Reuters Corporation |
| Sector: Services & Goods | |
| SubSector: Publishing - Periodicals | |
| MarketCap: 30959.4 Millions | |
| Recent Price: 152.63 Smart Investing & Trading Score: 76 | |
| Day Percent Change: -0.63% Day Change: -0.96 | |
| Week Change: 1.6% Year-to-date Change: 4.4% | |
| TRI Links: Profile News Message Board | |
| Charts:- Daily , Weekly | |
| Add TRI to Watchlist: View: Get Complete TRI Trend Analysis ➞ | |
 | FYBR Frontier Communications Parent, Inc. |
| Sector: Services & Goods | |
| SubSector: Telecom Services | |
| MarketCap: 4460 Millions | |
| Recent Price: 22.05 Smart Investing & Trading Score: 22 | |
| Day Percent Change: -3.61% Day Change: -0.82 | |
| Week Change: 1.59% Year-to-date Change: -12.6% | |
| FYBR Links: Profile News Message Board | |
| Charts:- Daily , Weekly | |
| Add FYBR to Watchlist: View: Get Complete FYBR Trend Analysis ➞ | |
 | LQDT Liquidity Services, Inc. |
| Sector: Services & Goods | |
| SubSector: Catalog & Mail Order Houses | |
| MarketCap: 144.492 Millions | |
| Recent Price: 17.32 Smart Investing & Trading Score: 25 | |
| Day Percent Change: -0.06% Day Change: -0.01 | |
| Week Change: 1.58% Year-to-date Change: 0.6% | |
| LQDT Links: Profile News Message Board | |
| Charts:- Daily , Weekly | |
| Add LQDT to Watchlist: View: Get Complete LQDT Trend Analysis ➞ | |
 | BAH Booz Allen Hamilton Holding Corporation |
| Sector: Services & Goods | |
| SubSector: Management Services | |
| MarketCap: 9037.35 Millions | |
| Recent Price: 144.39 Smart Investing & Trading Score: 65 | |
| Day Percent Change: -1.08% Day Change: -1.57 | |
| Week Change: 1.58% Year-to-date Change: 12.9% | |
| BAH Links: Profile News Message Board | |
| Charts:- Daily , Weekly | |
| Add BAH to Watchlist: View: Get Complete BAH Trend Analysis ➞ | |
 | RERE ATRenew Inc. |
| Sector: Services & Goods | |
| SubSector: Internet Retail | |
| MarketCap: 672 Millions | |
| Recent Price: 1.61 Smart Investing & Trading Score: 46 | |
| Day Percent Change: 1.58% Day Change: 0.02 | |
| Week Change: 1.58% Year-to-date Change: -15.1% | |
| RERE Links: Profile News Message Board | |
| Charts:- Daily , Weekly | |
| Add RERE to Watchlist: View: Get Complete RERE Trend Analysis ➞ | |
 | EBAY eBay Inc. |
| Sector: Services & Goods | |
| SubSector: Specialty Retail, Other | |
| MarketCap: 23152.3 Millions | |
| Recent Price: 51.18 Smart Investing & Trading Score: 68 | |
| Day Percent Change: -0.14% Day Change: -0.07 | |
| Week Change: 1.57% Year-to-date Change: 17.3% | |
| EBAY Links: Profile News Message Board | |
| Charts:- Daily , Weekly | |
| Add EBAY to Watchlist: View: Get Complete EBAY Trend Analysis ➞ | |
 | FWONK Formula One Group |
| Sector: Services & Goods | |
| SubSector: Broadcasting - TV | |
| MarketCap: 4677.53 Millions | |
| Recent Price: 69.15 Smart Investing & Trading Score: 93 | |
| Day Percent Change: -0.76% Day Change: -0.53 | |
| Week Change: 1.57% Year-to-date Change: 9.5% | |
| FWONK Links: Profile News Message Board | |
| Charts:- Daily , Weekly | |
| Add FWONK to Watchlist: View: Get Complete FWONK Trend Analysis ➞ | |
 | RRGB Red Robin Gourmet Burgers, Inc. |
| Sector: Services & Goods | |
| SubSector: Restaurants | |
| MarketCap: 121.57 Millions | |
| Recent Price: 6.50 Smart Investing & Trading Score: 57 | |
| Day Percent Change: -1.52% Day Change: -0.10 | |
| Week Change: 1.56% Year-to-date Change: -47.9% | |
| RRGB Links: Profile News Message Board | |
| Charts:- Daily , Weekly | |
| Add RRGB to Watchlist: View: Get Complete RRGB Trend Analysis ➞ | |
 | GDEN Golden Entertainment, Inc. |
| Sector: Services & Goods | |
| SubSector: Resorts & Casinos | |
| MarketCap: 130.794 Millions | |
| Recent Price: 34.50 Smart Investing & Trading Score: 52 | |
| Day Percent Change: -1.03% Day Change: -0.36 | |
| Week Change: 1.56% Year-to-date Change: -13.6% | |
| GDEN Links: Profile News Message Board | |
| Charts:- Daily , Weekly | |
| Add GDEN to Watchlist: View: Get Complete GDEN Trend Analysis ➞ | |
 | FOX Twenty-First Century Fox, Inc. |
| Sector: Services & Goods | |
| SubSector: Entertainment - Diversified | |
| MarketCap: 24211.2 Millions | |
| Recent Price: 29.31 Smart Investing & Trading Score: 74 | |
| Day Percent Change: 0.45% Day Change: 0.13 | |
| Week Change: 1.52% Year-to-date Change: 6.0% | |
| FOX Links: Profile News Message Board | |
| Charts:- Daily , Weekly | |
| Add FOX to Watchlist: View: Get Complete FOX Trend Analysis ➞ | |
| For tabular summary view of above stock list: Summary View ➞ 0 - 25 , 25 - 50 , 50 - 75 , 75 - 100 , 100 - 125 , 125 - 150 , 150 - 175 , 175 - 200 , 200 - 225 , 225 - 250 , 250 - 275 , 275 - 300 , 300 - 325 , 325 - 350 , 350 - 375 , 375 - 400 , 400 - 425 , 425 - 450 , 450 - 475 | ||
| Click To Change The Sort Order: By Market Cap or Company Size Performance: Year-to-date, Week and Day | |
| Select Chart Type: | ||
|
Best Stocks Today 12Stocks.com |
© 2024 12Stocks.com Terms & Conditions Privacy Contact Us
All Information Provided Only For Education And Not To Be Used For Investing or Trading. See Terms & Conditions


One More Thing ... Get Best Stocks Delivered Daily!
Never Ever Miss A Move With Our Top Ten Stocks Lists
Find Best Stocks In Any Market - Bull or Bear Market
Take A Peek At Our Top Ten Stocks Lists: Daily, Weekly, Year-to-Date & Top Trends
Find Best Stocks In Any Market - Bull or Bear Market
Take A Peek At Our Top Ten Stocks Lists: Daily, Weekly, Year-to-Date & Top Trends
Consumer Services Stocks With Best Up Trends [0-bearish to 100-bullish]: Yatsen Holding[100], 1[100], Alibaba [100], MINISO [100], Omnicom [100], Avnet [100], Napco Security[100], ASGN [100], IMAX [100], Yum! Brands[100], Dillard s[100]
Best Consumer Services Stocks Year-to-Date:
U Power[3013.84%], Vroom [1807.84%], Yatsen Holding[479.55%], Fluent [301.49%], Codere Online[134.25%], Research[107.01%], Sweetgreen [92.21%], RealReal [71.64%], PaySign [60.71%], DXP Enterprises[54.04%], Bright Scholar[52%] Best Consumer Services Stocks This Week:
Chicken Soup[282.5%], Hibbett Sports[21.61%], Golden Heaven[20.85%], Yatsen Holding[17.29%], Baozun [14.66%], Jumia Technologies[14.21%], Zumiez [13.38%], Ameresco [13.24%], 1[12.87%], Pinduoduo [12.39%], K12 [11.85%] Best Consumer Services Stocks Daily:
Chicken Soup[264.29%], Golden Heaven[11.81%], K12 [8.64%], Yatsen Holding[7.89%], GameStop [7.58%], Dada Nexus[7.53%], iClick Interactive[7.35%], U Power[7.31%], 1[7.23%], Watsco [6.54%], Allego N.V[6.31%]