
 Login Sign Up


| |||||
 |  | ||||

| 12Stocks.com Market Intelligence |
Stock Charts, Performance & Trend Analysis for SGHC
Super Group (SGHC) Limited
|
| |||||||||||||||||||||||||||||||||||||||||||||||||||||||||||
|
Stocks Similar To Super
| ||||||||||||||||||||||||||||||||||||||||||||||||||||||||||
The table below shows stocks similar to Super Group (SGHC) Limited, i.e, from same subsector or sector along with year-to-date (104.4% YTD), weekly (0.3%) & daily performaces for comparison. Usually, stocks from similar sector tend to move together but companies that have innovative products, services or good management tend to outperform. Compare 12Stocks.com Smart Investing & Trading Scores to see which stocks in this sector are trending better currently. Click on ticker or stock name for detailed view (place cursor on ticker or stock name to view charts quickly). Click on  to add stock symbol to your watchlist and to add stock symbol to your watchlist and  to view watchlist. to view watchlist. | ||||||||||
| ||||||||||
| Ticker | Stock Name | Watchlist | Category | Recent Price | Smart Investing & Trading Score [0 to 100] | Change % | Weekly Change% | YTD Change% | ||
| MAR | Marriott |   | Leisure | 265.14 | 30 | -0.51 | 0.2 | -2.93% | ||
| HLT | Hilton Worldwide | | Leisure | 271.25 | 10 | -1.27 | -0.4 | 10.79% | ||
| LVS | Las Vegas | | Leisure | 53.09 | 30 | -0.77 | -1.1 | 8.23% | ||
| CTRP | Ctrip.com | | Leisure | 27.62 | 100 | 1.21 | 18.1 | 0.00% | ||
| IHG | Intercontinental Hotels | | Leisure | 119.50 | 20 | -1.26 | -3.0 | -2.46% | ||
| H | Hyatt Hotels | | Leisure | 140.38 | 20 | -2.13 | -3.2 | -9.99% | ||
| WYNN | Wynn Resorts | | Leisure | 122.85 | 40 | 1.15 | 1.6 | 47.38% | ||
| HTHT | H World | | Leisure | 36.83 | 40 | -0.89 | -2.0 | 16.72% | ||
| HAS | Hasbro Inc | | Leisure | 76.00 | 20 | -3.04 | -4.7 | 37.55% | ||
| MGM | MGM Resorts | | Leisure | 35.64 | 60 | 3.15 | -2.8 | 5.88% | ||
| PLNT | Planet Fitness | | Leisure | 100.56 | 0 | -1.19 | -3.8 | 0.97% | ||
| WYN | Wyndham Worldwide | | Leisure | 135.77 | 60 | -0.04 | 13.8 | 0.00% | ||
| MPEL | Melco Crown | | Leisure | 830.00 | 20 | 1.72 | 0.0 | 0.00% | ||
| CHDN | Churchill Downs | | Leisure | 95.98 | 10 | -0.35 | -6.3 | -27.06% | ||
| BYD | Boyd Gaming | | Leisure | 83.47 | 10 | -1.43 | -3.5 | 16.80% | ||
| WH | Wyndham Hotels | | Leisure | 84.12 | 20 | -1.97 | -2.6 | -14.90% | ||
| RRR | Red Rock | | Leisure | 61.08 | 60 | -0.42 | -1.9 | 41.01% | ||
| LTH | Life Time | | Leisure | 28.26 | 10 | 0.86 | 3.3 | 27.98% | ||
| SGHC | Super | | Leisure | 12.69 | 70 | 0.40 | 0.3 | 104.40% | ||
| MAT | Mattel Inc | | Leisure | 17.42 | 10 | -1.80 | -7.4 | -1.75% | ||
| MTN | Vail Resorts | | Leisure | 147.01 | 20 | 2.57 | -6.9 | -13.71% | ||
| CZR | Caesars Entertainment | | Leisure | 25.90 | 40 | 3.23 | -1.7 | -20.53% | ||
| CHH | Choice Hotels | | Leisure | 109.78 | 0 | -2.69 | -6.0 | -22.17% | ||
| TSG | Stars | | Leisure | 44.13 | 40 | 0.64 | -6.1 | 0.00% | ||
| GOLF | Acushnet | | Leisure | 74.72 | 50 | 0.04 | -2.4 | 4.58% | ||
| AMZN | Amazon.com Inc | | Retail | 231.43 | 70 | 1.44 | -0.4 | 5.09% | ||
| TSLA | Tesla Inc | | Auto | 410.20 | 100 | 3.60 | 16.9 | 8.15% | ||
| HD | Home Depot | | Retail | 422.71 | 80 | 0.00 | 0.9 | 10.19% | ||
| BABA | Alibaba | | Retail | 158.04 | 100 | 1.92 | 16.6 | 87.52% | ||
| TM | Toyota Motor | | Auto | 197.28 | 70 | 0.59 | -1.2 | 4.16% | ||
| MCD | McDonalds Corp | | Restaurants | 302.07 | 20 | -1.09 | -3.9 | 4.45% | ||
| BKNG | Booking | | Services | 5559.83 | 50 | 1.86 | 1.0 | 13.31% | ||
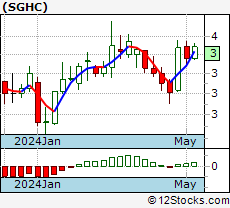
Technical Levels: For the trading inclined, the following are the key levels of resistance (ceiling) and support (floor) for SGHC. Ceiling and floor levels are stock prices at which the stock trend gets resistance or support respectively. Stocks & their trends tend to pause at these levels and hence traders have an eye on them. Long term levels are more important. Stocks that have broken thru their resistance or support levels convincingly tend to have stronger trends (confirm with charts above visually). |
| Key Technical Levels for SGHC | |||
| Short Term | Weekly | Long Term | |
| Resistance (Ceiling) | 11.55 | 11.81 | 12.18 |
| Support (Floor) | 11.21 | 10.63 | 10.56 |
| RELATIVE PERFORMANCE OF Super Group (SGHC) Limited Vs THE MARKET | ||||
| Relative performance of Super Group (SGHC) Limited Compared to Overall Market | ||||
| How is SGHC faring versus the market [S&P 500] ? Is it lagging or leading ? How is its relative performance ? | ||||
| Symbol | Day Change | Week Change | Year-to-Date Change | |
| SPY | 0.487188% | 1.98404% | 13.4008% | |
| SGHC | 0.39557% | 0.316206% | 104.4% | |
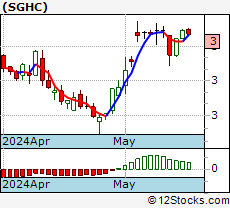
 SGHC Chart | 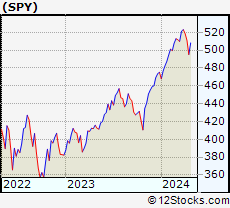 S&P 500 (Market) Chart | |||
| Year to date returns, SGHC is outperforming the market by 90.9992% | |
| This week, SGHC is underperforming the market by -1.667834% | |
| Performance of Super Group (SGHC) Limited vs Services & Goods ETF | RELATIVE PERFORMANCE OF Super Group (SGHC) Limited Vs Services & Goods Sector | |||
| Let us compare apples to apples and compare performance of SGHC with its sector ETF (contains basket of stocks of same sector) XRT [Retail SPDR] ? | ||||
| Symbol | Day Change | Week Change | Year-to-Date Change | |
| XRT | 1.41302 % | 0.240412 % | 10.918 % | |
| SGHC | 0.39557% | 0.316206% | 104.4% | |
SGHC Chart | 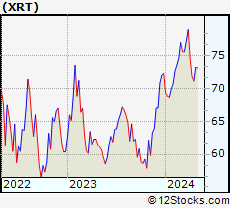 Services & Goods Chart | |||
| Year to date, SGHC is outperforming Services & Goods sector by 93.482% | ||||
| This week, SGHC is outperforming Services & Goods sector by 0.075794% | ||||
List Of ETF Funds Related To Super Group (SGHC) Limited
| The table below shows ETFs (Exchange Traded Funds) similar to Super Group (SGHC) Limited, i.e, from same sector along with year-to-date (YTD), weekly & daily performaces for comparison. Usually, ETFs and associated stocks from similar sector tend to move together but companies that have innovative products, services or good management tend to outperform. Move mouse or cursor over ETF symbol to view short-term technical chart and over ETF name to view long term chart. Click on to add ETF symbol to your watchlist and to view watchlist. | |||||||
| Ticker | Stock Name | Watchlist | Category | Recent Price | Change % | Weekly Change% | YTD Change% |
| UCC | ProShares Ultra Consumer Svcs | | Services & Goods | 54.31 | 1.6493 | 4.60525 | 8.48158% |
| UGE | ProShares Ultra Consumer Goods | | Services & Goods | 17.55 | -2.42326 | -3.7175 | -1.16837% |
| XLY | Consumer Discretionary SPDR | | Services & Goods | 240.70 | 0.867452 | 2.37761 | 9.2482% |
| XHB | SPDR Homebuilders | | Services & Goods | 115.46 | -0.602617 | -3.26743 | 12.1156% |
| RTH | Retail HOLDRs | | Services & Goods | 252.07 | -0.286797 | 0.294038 | 12.7363% |
| SCC | ProShares UltraShort Consumer Svcs | | Services & Goods | 14.57 | -1.58288 | -4.5179 | -21.5841% |
| SZK | ProShares UltraShort Consumer Goods | | Services & Goods | 12.55 | 2.47127 | 3.7859 | -1.16423% |
| XRT | Retail SPDR | | Services & Goods | 87.56 | 1.41302 | 0.240412 | 10.918% |
| ITB | iShares U.S. Home Construction | | Services & Goods | 112.16 | -1.33709 | -3.89032 | 11.4589% |
| RCD | Rydex EW Consumer Discretionary | | Services & Goods | 23.99 | 0.125209 | 1.09566 | 0.102648% |
| VCR | Vanguard Consumer Discretionary VIPERs | | Services & Goods | 399.17 | 0.879476 | 1.77715 | 7.86658% |
| PKB | PowerShares Construction | | Services & Goods | 93.57 | 0.600796 | 1.39387 | 24.0743% |
| PEJ | PowerShares Leisure | | Services & Goods | 62.19 | 0.452269 | 4.53858 | 18.7156% |
| PBS | PowerShares Media | | Services & Goods | 40.46 | 1.68384 | 5.86219 | 0% |
| IYC | iShares US Consumer Services | | Services & Goods | 105.85 | 0.617871 | 1.21438 | 11.192% |
|
Get the most comprehensive stock market coverage daily at 12Stocks.com ➞ Best Stocks Today ➞ Best Stocks Weekly ➞ Best Stocks Year-to-Date ➞ Best Stocks Trends ➞  Best Stocks Today 12Stocks.com Best Nasdaq Stocks ➞ Best S&P 500 Stocks ➞ Best Tech Stocks ➞ Best Biotech Stocks ➞ |
© 2025 12Stocks.com Terms & Conditions Privacy Contact Us
All Information Provided Only For Education And Not To Be Used For Investing or Trading. See Terms & Conditions


One More Thing ... Get Best Stocks Delivered Daily!
Never Ever Miss A Move With Our Top Ten Stocks Lists
Get Best Performing Stocks, Daily Market Trends & Insight
Take A Peek At Our Top Ten Stocks Lists: Daily, Weekly, Year-to-Date & Top Trends
Get Best Performing Stocks, Daily Market Trends & Insight
Take A Peek At Our Top Ten Stocks Lists: Daily, Weekly, Year-to-Date & Top Trends
Dow Stocks With Best Current Trends [0-bearish to 100-bullish]: Goldman Sachs[100], Chase[100], S&P[90], Intel Corp[80], Microsoft [80], Caterpillar Inc[80], [80], Walmart Inc[80], Home Depot[80], Amazon.com Inc[70] Best S&P 500 Stocks Year-to-Date Update:
Seagate [147.69%], Western Digital[119.354%], Newmont Corp[109.048%], Warner Bros.[85.73%], Oracle Corp[83.4955%], Micron [81.0754%], NRG Energy[81.0359%], Amphenol Corp[73.5407%], CVS Health[71.8234%], GE Aerospace[70.6709%] Best Nasdaq 100 Stocks Weekly Update:
Splunk [38.7643%], Micron [20.1028%], Tesla Inc[16.9185%], Lam Research[15.7941%], ASML Holding[10.9505%], Constellation Energy[9.56297%], KLA Corp[9.26096%], Broadcom Inc[8.71928%], QQQ[8.07014%], Alphabet Inc[7.06809%] Today's Stock Market In A Nutshell:Oil [1.3%], Gold [1%], Europe [0.8%], Emerging Markets [0.7%], China [0.7%], US Large Cap [0.5%], US Small Cap [0.4%], Euro [0.3%], Bonds [0.2%], India [0.1%], US Mid Cap [-0%], US Dollar [-0.3%],