
 Login Sign Up


| |||||
 |  | ||||

| 12Stocks.com Market Intelligence |
Best Consumer Services Stocks
| In a hurry? Services & Goods Stocks: Performance Trends Table, Stock Charts
Sort Consumer Services: Daily, Weekly, Year-to-Date, Market Cap & Trends. Filter Services & Goods stocks list by size: All Large Mid-Range Small |
| 12Stocks.com Consumer Services Stocks Performances & Trends Daily | |||||||||
|
|  The overall Smart Investing & Trading Score is 31 (0-bearish to 100-bullish) which puts Consumer Services sector in short term bearish to neutral trend. The Smart Investing & Trading Score from previous trading session is 58 and hence a deterioration of trend.
| ||||||||
Here are the Smart Investing & Trading Scores of the most requested Consumer Services stocks at 12Stocks.com (click stock name for detailed review):
|


| Consider signing up for our daily 12Stocks.com "Best Stocks Newsletter". You will never ever miss a big stock move again! |
| 12Stocks.com: Investing in Consumer Services sector with Stocks | |
|
The following table helps investors and traders sort through current performance and trends (as measured by Smart Investing & Trading Score) of various
stocks in the Consumer Services sector. Quick View: Move mouse or cursor over stock symbol (ticker) to view short-term Technical chart and over stock name to view long term chart. Click on  to add stock symbol to your watchlist and to add stock symbol to your watchlist and  to view watchlist. Click on any ticker or stock name for detailed market intelligence report for that stock. to view watchlist. Click on any ticker or stock name for detailed market intelligence report for that stock. |
12Stocks.com Performance of Stocks in Consumer Services Sector
| Ticker | Stock Name | Watchlist | Category | Recent Price | Smart Investing & Trading Score | Change % | YTD Change% |
| AEO | American Eagle |   | Apparel | 22.82 | 51 | 0.86 | 7.87% |
| CASY | Casey s | | Grocery | 318.28 | 71 | 0.84 | 15.85% |
| PRDO | Perdoceo Education | | Education | 18.57 | 77 | 0.84 | 5.78% |
| SSP | E.W. Scripps | | Broadcasting | 3.84 | 74 | 0.79 | -52.00% |
| BAH | Booz Allen | | Services | 145.53 | 65 | 0.79 | 13.78% |
| DPZ | Domino s | | Restaurants | 491.52 | 68 | 0.78 | 19.24% |
| DADA | Dada Nexus | | Internet Retail | 2.02 | 100 | 0.75 | -39.31% |
| DESP | Despegar.com | | Lodging | 12.68 | 90 | 0.71 | 34.04% |
| LAD | Lithia Motors | | Automobile | 250.07 | 0 | 0.70 | -24.06% |
| APEI | American Public | | Education | 13.30 | 68 | 0.61 | 37.82% |
| VIPS | Vipshop | | Retail | 15.90 | 38 | 0.60 | -10.44% |
| BJ | BJ s | | Retail | 76.23 | 53 | 0.59 | 14.36% |
| VLGEA | Village Super | | Grocery | 27.83 | 48 | 0.58 | 6.10% |
| EAT | Brinker | | Restaurants | 47.85 | 88 | 0.56 | 10.83% |
| TTEK | Tetra Tech | | Services | 190.31 | 68 | 0.54 | 14.01% |
| MMYT | MakeMyTrip | | Entertainment | 65.88 | 56 | 0.51 | 40.22% |
| EVC | Entravision | | Broadcasting | 2.09 | 32 | 0.48 | -49.88% |
| BKR | Baker Hughes | | Services | 32.78 | 53 | 0.43 | -4.10% |
| ARW | Arrow Electronics | | Retail | 128.12 | 93 | 0.42 | 4.80% |
| DHX | DHI | | Staffing | 2.49 | 68 | 0.40 | -3.86% |
| CHH | Choice Hotels | | Lodging | 119.52 | 35 | 0.38 | 5.49% |
| CCO | Clear Channel | | Marketing | 1.45 | 10 | 0.35 | -20.60% |
| LVS | Las Vegas | | Casinos | 45.98 | 18 | 0.32 | -6.55% |
| GLP | Global Partners | | Basic Materials Wholesale | 46.83 | 82 | 0.32 | 10.68% |
| NVEE | NV5 Global | | Services | 92.71 | 42 | 0.30 | -16.57% |
| For chart view version of above stock list: Chart View ➞ 0 - 25 , 25 - 50 , 50 - 75 , 75 - 100 , 100 - 125 , 125 - 150 , 150 - 175 , 175 - 200 , 200 - 225 , 225 - 250 , 250 - 275 , 275 - 300 , 300 - 325 , 325 - 350 , 350 - 375 , 375 - 400 , 400 - 425 , 425 - 450 , 450 - 475 | ||
 | Click To Change The Sort Order: By Market Cap or Company Size Performance: Year-to-date, Week and Day |  |
|
Get the most comprehensive stock market coverage daily at 12Stocks.com ➞ Best Stocks Today ➞ Best Stocks Weekly ➞ Best Stocks Year-to-Date ➞ Best Stocks Trends ➞  Best Stocks Today 12Stocks.com Best Nasdaq Stocks ➞ Best S&P 500 Stocks ➞ Best Tech Stocks ➞ Best Biotech Stocks ➞ |
| Detailed Overview of Consumer Services Stocks |
| Consumer Services Technical Overview, Leaders & Laggards, Top Consumer Services ETF Funds & Detailed Consumer Services Stocks List, Charts, Trends & More |
| Consumer Services Sector: Technical Analysis, Trends & YTD Performance | |
| Consumer Services sector is composed of stocks
from retail, entertainment, media/publishing, consumer goods
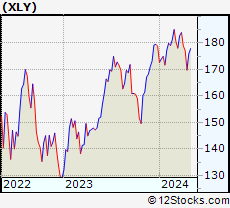
and services subsectors. Consumer Services sector, as represented by XLY, an exchange-traded fund [ETF] that holds basket of Consumer Services stocks (e.g, Walmart, Alibaba) is down by -3.54% and is currently underperforming the overall market by -7.79% year-to-date. Below is a quick view of Technical charts and trends: |
|
 XLY Weekly Chart |
|
| Long Term Trend: Good | |
| Medium Term Trend: Not Good | |
 XLY Daily Chart |
|
| Short Term Trend: Very Good | |
| Overall Trend Score: 31 | |
| YTD Performance: -3.54% | |
| **Trend Scores & Views Are Only For Educational Purposes And Not For Investing | |
| 12Stocks.com: Top Performing Consumer Services Sector Stocks | ||||||||||||||||||||||||||||||||||||||||||||||||
 The top performing Consumer Services sector stocks year to date are
Now, more recently, over last week, the top performing Consumer Services sector stocks on the move are


|
||||||||||||||||||||||||||||||||||||||||||||||||
| 12Stocks.com: Investing in Consumer Services Sector using Exchange Traded Funds | |
|
The following table shows list of key exchange traded funds (ETF) that
help investors track Consumer Services Index. For detailed view, check out our ETF Funds section of our website. Quick View: Move mouse or cursor over ETF symbol (ticker) to view short-term Technical chart and over ETF name to view long term chart. Click on ticker or stock name for detailed view. Click on to add stock symbol to your watchlist and to view watchlist. |
12Stocks.com List of ETFs that track Consumer Services Index
| Ticker | ETF Name | Watchlist | Recent Price | Smart Investing & Trading Score | Change % | Week % | Year-to-date % |
| XLY | Consumer Discret Sel | | 172.48 | 31 | -0.98 | 1.6 | -3.54% |
| RTH | Retail | | 199.62 | 44 | -0.09 | 0.5 | 6.05% |
| XRT | Retail | | 71.57 | 51 | -1.31 | 0.56 | -1.04% |
| UCC | Consumer Services | | 33.25 | 66 | -0.36 | 5.3 | -7.4% |
| RXI | Globl Consumer Discretionary | | 158.03 | 36 | -1.41 | 0.56 | -0.65% |
| SCC | Short Consumer Services | | 16.55 | 42 | 2.67 | -2.38 | 8% |
| UGE | Consumer Goods | | 17.31 | 90 | 0.41 | 4.11 | 9.97% |
| 12Stocks.com: Charts, Trends, Fundamental Data and Performances of Consumer Services Stocks | |
|
We now take in-depth look at all Consumer Services stocks including charts, multi-period performances and overall trends (as measured by Smart Investing & Trading Score). One can sort Consumer Services stocks (click link to choose) by Daily, Weekly and by Year-to-Date performances. Also, one can sort by size of the company or by market capitalization. |
| Select Your Default Chart Type: | |||||
| |||||
| Click on stock symbol or name for detailed view. Click on to add stock symbol to your watchlist and to view watchlist. Quick View: Move mouse or cursor over "Daily" to quickly view daily Technical stock chart and over "Weekly" to view weekly Technical stock chart. | |||||

 | AEO American Eagle Outfitters, Inc. |
| Sector: Services & Goods | |
| SubSector: Apparel Stores | |
| MarketCap: 1577.08 Millions | |
| Recent Price: 22.82 Smart Investing & Trading Score: 51 | |
| Day Percent Change: 0.86% Day Change: 0.20 | |
| Week Change: 1.99% Year-to-date Change: 7.9% | |
| AEO Links: Profile News Message Board | |
| Charts:- Daily , Weekly | |
| Add AEO to Watchlist: View: Get Complete AEO Trend Analysis ➞ | |
 | CASY Casey s General Stores, Inc. |
| Sector: Services & Goods | |
| SubSector: Grocery Stores | |
| MarketCap: 5787.95 Millions | |
| Recent Price: 318.28 Smart Investing & Trading Score: 71 | |
| Day Percent Change: 0.84% Day Change: 2.64 | |
| Week Change: 2.54% Year-to-date Change: 15.9% | |
| CASY Links: Profile News Message Board | |
| Charts:- Daily , Weekly | |
| Add CASY to Watchlist: View: Get Complete CASY Trend Analysis ➞ | |
 | PRDO Perdoceo Education Corporation |
| Sector: Services & Goods | |
| SubSector: Education & Training Services | |
| MarketCap: 631.006 Millions | |
| Recent Price: 18.57 Smart Investing & Trading Score: 77 | |
| Day Percent Change: 0.84% Day Change: 0.15 | |
| Week Change: 7.25% Year-to-date Change: 5.8% | |
| PRDO Links: Profile News Message Board | |
| Charts:- Daily , Weekly | |
| Add PRDO to Watchlist: View: Get Complete PRDO Trend Analysis ➞ | |
 | SSP The E.W. Scripps Company |
| Sector: Services & Goods | |
| SubSector: Broadcasting - TV | |
| MarketCap: 766.163 Millions | |
| Recent Price: 3.84 Smart Investing & Trading Score: 74 | |
| Day Percent Change: 0.79% Day Change: 0.03 | |
| Week Change: 6.82% Year-to-date Change: -52.0% | |
| SSP Links: Profile News Message Board | |
| Charts:- Daily , Weekly | |
| Add SSP to Watchlist: View: Get Complete SSP Trend Analysis ➞ | |
 | BAH Booz Allen Hamilton Holding Corporation |
| Sector: Services & Goods | |
| SubSector: Management Services | |
| MarketCap: 9037.35 Millions | |
| Recent Price: 145.53 Smart Investing & Trading Score: 65 | |
| Day Percent Change: 0.79% Day Change: 1.14 | |
| Week Change: 2.38% Year-to-date Change: 13.8% | |
| BAH Links: Profile News Message Board | |
| Charts:- Daily , Weekly | |
| Add BAH to Watchlist: View: Get Complete BAH Trend Analysis ➞ | |
 | DPZ Domino s Pizza, Inc. |
| Sector: Services & Goods | |
| SubSector: Restaurants | |
| MarketCap: 12166 Millions | |
| Recent Price: 491.52 Smart Investing & Trading Score: 68 | |
| Day Percent Change: 0.78% Day Change: 3.81 | |
| Week Change: 3.8% Year-to-date Change: 19.2% | |
| DPZ Links: Profile News Message Board | |
| Charts:- Daily , Weekly | |
| Add DPZ to Watchlist: View: Get Complete DPZ Trend Analysis ➞ | |
 | DADA Dada Nexus Limited |
| Sector: Services & Goods | |
| SubSector: Internet Retail | |
| MarketCap: 98527 Millions | |
| Recent Price: 2.02 Smart Investing & Trading Score: 100 | |
| Day Percent Change: 0.75% Day Change: 0.02 | |
| Week Change: 6.9% Year-to-date Change: -39.3% | |
| DADA Links: Profile News Message Board | |
| Charts:- Daily , Weekly | |
| Add DADA to Watchlist: View: Get Complete DADA Trend Analysis ➞ | |
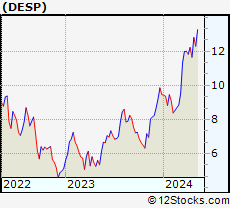 | DESP Despegar.com, Corp. |
| Sector: Services & Goods | |
| SubSector: Lodging | |
| MarketCap: 547.536 Millions | |
| Recent Price: 12.68 Smart Investing & Trading Score: 90 | |
| Day Percent Change: 0.71% Day Change: 0.09 | |
| Week Change: 8.84% Year-to-date Change: 34.0% | |
| DESP Links: Profile News Message Board | |
| Charts:- Daily , Weekly | |
| Add DESP to Watchlist: View: Get Complete DESP Trend Analysis ➞ | |
 | LAD Lithia Motors, Inc. |
| Sector: Services & Goods | |
| SubSector: Auto Dealerships | |
| MarketCap: 1727.21 Millions | |
| Recent Price: 250.07 Smart Investing & Trading Score: 0 | |
| Day Percent Change: 0.70% Day Change: 1.73 | |
| Week Change: -4.19% Year-to-date Change: -24.1% | |
| LAD Links: Profile News Message Board | |
| Charts:- Daily , Weekly | |
| Add LAD to Watchlist: View: Get Complete LAD Trend Analysis ➞ | |
 | APEI American Public Education, Inc. |
| Sector: Services & Goods | |
| SubSector: Education & Training Services | |
| MarketCap: 361.306 Millions | |
| Recent Price: 13.30 Smart Investing & Trading Score: 68 | |
| Day Percent Change: 0.61% Day Change: 0.08 | |
| Week Change: 5.47% Year-to-date Change: 37.8% | |
| APEI Links: Profile News Message Board | |
| Charts:- Daily , Weekly | |
| Add APEI to Watchlist: View: Get Complete APEI Trend Analysis ➞ | |
 | VIPS Vipshop Holdings Limited |
| Sector: Services & Goods | |
| SubSector: Catalog & Mail Order Houses | |
| MarketCap: 10496.2 Millions | |
| Recent Price: 15.90 Smart Investing & Trading Score: 38 | |
| Day Percent Change: 0.60% Day Change: 0.09 | |
| Week Change: 4.91% Year-to-date Change: -10.4% | |
| VIPS Links: Profile News Message Board | |
| Charts:- Daily , Weekly | |
| Add VIPS to Watchlist: View: Get Complete VIPS Trend Analysis ➞ | |
 | BJ BJ s Wholesale Club Holdings, Inc. |
| Sector: Services & Goods | |
| SubSector: Discount, Variety Stores | |
| MarketCap: 3346.02 Millions | |
| Recent Price: 76.23 Smart Investing & Trading Score: 53 | |
| Day Percent Change: 0.59% Day Change: 0.45 | |
| Week Change: 3.38% Year-to-date Change: 14.4% | |
| BJ Links: Profile News Message Board | |
| Charts:- Daily , Weekly | |
| Add BJ to Watchlist: View: Get Complete BJ Trend Analysis ➞ | |
 | VLGEA Village Super Market, Inc. |
| Sector: Services & Goods | |
| SubSector: Grocery Stores | |
| MarketCap: 222.375 Millions | |
| Recent Price: 27.83 Smart Investing & Trading Score: 48 | |
| Day Percent Change: 0.58% Day Change: 0.16 | |
| Week Change: 1.02% Year-to-date Change: 6.1% | |
| VLGEA Links: Profile News Message Board | |
| Charts:- Daily , Weekly | |
| Add VLGEA to Watchlist: View: Get Complete VLGEA Trend Analysis ➞ | |
 | EAT Brinker International, Inc. |
| Sector: Services & Goods | |
| SubSector: Restaurants | |
| MarketCap: 435.97 Millions | |
| Recent Price: 47.85 Smart Investing & Trading Score: 88 | |
| Day Percent Change: 0.56% Day Change: 0.26 | |
| Week Change: 5.8% Year-to-date Change: 10.8% | |
| EAT Links: Profile News Message Board | |
| Charts:- Daily , Weekly | |
| Add EAT to Watchlist: View: Get Complete EAT Trend Analysis ➞ | |
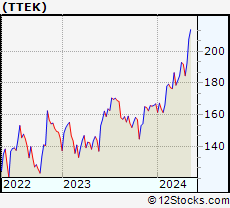 | TTEK Tetra Tech, Inc. |
| Sector: Services & Goods | |
| SubSector: Technical Services | |
| MarketCap: 3985.5 Millions | |
| Recent Price: 190.31 Smart Investing & Trading Score: 68 | |
| Day Percent Change: 0.54% Day Change: 1.02 | |
| Week Change: 3.05% Year-to-date Change: 14.0% | |
| TTEK Links: Profile News Message Board | |
| Charts:- Daily , Weekly | |
| Add TTEK to Watchlist: View: Get Complete TTEK Trend Analysis ➞ | |
 | MMYT MakeMyTrip Limited |
| Sector: Services & Goods | |
| SubSector: General Entertainment | |
| MarketCap: 1429.59 Millions | |
| Recent Price: 65.88 Smart Investing & Trading Score: 56 | |
| Day Percent Change: 0.51% Day Change: 0.33 | |
| Week Change: 8.17% Year-to-date Change: 40.2% | |
| MMYT Links: Profile News Message Board | |
| Charts:- Daily , Weekly | |
| Add MMYT to Watchlist: View: Get Complete MMYT Trend Analysis ➞ | |
 | EVC Entravision Communications Corporation |
| Sector: Services & Goods | |
| SubSector: Broadcasting - TV | |
| MarketCap: 171.763 Millions | |
| Recent Price: 2.09 Smart Investing & Trading Score: 32 | |
| Day Percent Change: 0.48% Day Change: 0.01 | |
| Week Change: -0.48% Year-to-date Change: -49.9% | |
| EVC Links: Profile News Message Board | |
| Charts:- Daily , Weekly | |
| Add EVC to Watchlist: View: Get Complete EVC Trend Analysis ➞ | |
 | BKR Baker Hughes Company |
| Sector: Services & Goods | |
| SubSector: Technical Services | |
| MarketCap: 1330 Millions | |
| Recent Price: 32.78 Smart Investing & Trading Score: 53 | |
| Day Percent Change: 0.43% Day Change: 0.14 | |
| Week Change: 0.58% Year-to-date Change: -4.1% | |
| BKR Links: Profile News Message Board | |
| Charts:- Daily , Weekly | |
| Add BKR to Watchlist: View: Get Complete BKR Trend Analysis ➞ | |
 | ARW Arrow Electronics, Inc. |
| Sector: Services & Goods | |
| SubSector: Electronics Wholesale | |
| MarketCap: 4155.03 Millions | |
| Recent Price: 128.12 Smart Investing & Trading Score: 93 | |
| Day Percent Change: 0.42% Day Change: 0.54 | |
| Week Change: 5.27% Year-to-date Change: 4.8% | |
| ARW Links: Profile News Message Board | |
| Charts:- Daily , Weekly | |
| Add ARW to Watchlist: View: Get Complete ARW Trend Analysis ➞ | |
 | DHX DHI Group, Inc. |
| Sector: Services & Goods | |
| SubSector: Staffing & Outsourcing Services | |
| MarketCap: 144.728 Millions | |
| Recent Price: 2.49 Smart Investing & Trading Score: 68 | |
| Day Percent Change: 0.40% Day Change: 0.01 | |
| Week Change: 0.4% Year-to-date Change: -3.9% | |
| DHX Links: Profile News Message Board | |
| Charts:- Daily , Weekly | |
| Add DHX to Watchlist: View: Get Complete DHX Trend Analysis ➞ | |
 | CHH Choice Hotels International, Inc. |
| Sector: Services & Goods | |
| SubSector: Lodging | |
| MarketCap: 3427.56 Millions | |
| Recent Price: 119.52 Smart Investing & Trading Score: 35 | |
| Day Percent Change: 0.38% Day Change: 0.45 | |
| Week Change: 2.72% Year-to-date Change: 5.5% | |
| CHH Links: Profile News Message Board | |
| Charts:- Daily , Weekly | |
| Add CHH to Watchlist: View: Get Complete CHH Trend Analysis ➞ | |
 | CCO Clear Channel Outdoor Holdings, Inc. |
| Sector: Services & Goods | |
| SubSector: Marketing Services | |
| MarketCap: 312.715 Millions | |
| Recent Price: 1.45 Smart Investing & Trading Score: 10 | |
| Day Percent Change: 0.35% Day Change: 0.01 | |
| Week Change: -3.02% Year-to-date Change: -20.6% | |
| CCO Links: Profile News Message Board | |
| Charts:- Daily , Weekly | |
| Add CCO to Watchlist: View: Get Complete CCO Trend Analysis ➞ | |
 | LVS Las Vegas Sands Corp. |
| Sector: Services & Goods | |
| SubSector: Resorts & Casinos | |
| MarketCap: 36431.6 Millions | |
| Recent Price: 45.98 Smart Investing & Trading Score: 18 | |
| Day Percent Change: 0.32% Day Change: 0.14 | |
| Week Change: 1.15% Year-to-date Change: -6.6% | |
| LVS Links: Profile News Message Board | |
| Charts:- Daily , Weekly | |
| Add LVS to Watchlist: View: Get Complete LVS Trend Analysis ➞ | |
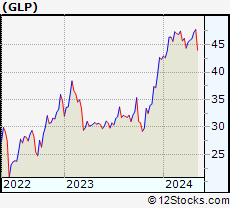 | GLP Global Partners LP |
| Sector: Services & Goods | |
| SubSector: Basic Materials Wholesale | |
| MarketCap: 416.73 Millions | |
| Recent Price: 46.83 Smart Investing & Trading Score: 82 | |
| Day Percent Change: 0.32% Day Change: 0.15 | |
| Week Change: 1.58% Year-to-date Change: 10.7% | |
| GLP Links: Profile News Message Board | |
| Charts:- Daily , Weekly | |
| Add GLP to Watchlist: View: Get Complete GLP Trend Analysis ➞ | |
 | NVEE NV5 Global, Inc. |
| Sector: Services & Goods | |
| SubSector: Technical Services | |
| MarketCap: 484.91 Millions | |
| Recent Price: 92.71 Smart Investing & Trading Score: 42 | |
| Day Percent Change: 0.30% Day Change: 0.28 | |
| Week Change: 2.97% Year-to-date Change: -16.6% | |
| NVEE Links: Profile News Message Board | |
| Charts:- Daily , Weekly | |
| Add NVEE to Watchlist: View: Get Complete NVEE Trend Analysis ➞ | |
| For tabular summary view of above stock list: Summary View ➞ 0 - 25 , 25 - 50 , 50 - 75 , 75 - 100 , 100 - 125 , 125 - 150 , 150 - 175 , 175 - 200 , 200 - 225 , 225 - 250 , 250 - 275 , 275 - 300 , 300 - 325 , 325 - 350 , 350 - 375 , 375 - 400 , 400 - 425 , 425 - 450 , 450 - 475 | ||
| Click To Change The Sort Order: By Market Cap or Company Size Performance: Year-to-date, Week and Day | |
| Select Chart Type: | ||
|
Best Stocks Today 12Stocks.com |
© 2024 12Stocks.com Terms & Conditions Privacy Contact Us
All Information Provided Only For Education And Not To Be Used For Investing or Trading. See Terms & Conditions


One More Thing ... Get Best Stocks Delivered Daily!
Never Ever Miss A Move With Our Top Ten Stocks Lists
Find Best Stocks In Any Market - Bull or Bear Market
Take A Peek At Our Top Ten Stocks Lists: Daily, Weekly, Year-to-Date & Top Trends
Find Best Stocks In Any Market - Bull or Bear Market
Take A Peek At Our Top Ten Stocks Lists: Daily, Weekly, Year-to-Date & Top Trends
Consumer Services Stocks With Best Up Trends [0-bearish to 100-bullish]: Ardagh Metal[100], Churchill Downs[100], Yatsen Holding[100], Chipotle Mexican[100], MYT Netherlands[100], Dada Nexus[100], Avnet [100], Reynolds Consumer[100], Omnicom [100], Alibaba [100], FTI Consulting[100]
Best Consumer Services Stocks Year-to-Date:
U Power[2896.65%], Vroom [1804.53%], Yatsen Holding[502.79%], Fluent [298.51%], Codere Online[133.9%], Research[107.01%], Sweetgreen [91.24%], RealReal [64.43%], Bright Scholar[59.2%], PaySign [55.54%], DXP Enterprises[50.59%] Best Consumer Services Stocks This Week:
Chicken Soup[210%], Yatsen Holding[21.99%], Hibbett Sports[21%], Golden Heaven[15.91%], K12 [15.21%], Strategic Education[15.13%], Sonic Automotive[14.21%], TAL Education[13.12%], Watsco [12.7%], Ardagh Metal[12.61%], iHeartMedia [12.37%] Best Consumer Services Stocks Daily:
Boqii Holding[15.69%], Strategic Education[12.22%], Altisource Portfolio[8.82%], Red Robin[8.77%], TransUnion [8.77%], Sonic Automotive[8.63%], MOGU [8.43%], Ardagh Metal[6.65%], Churchill Downs[6.18%], TAL Education[5.46%], Soho House[5.19%]