
 Login Sign Up


| |||||
 |  | ||||

| 12Stocks.com Market Intelligence |
Best Consumer Services Stocks
| In a hurry? Services & Goods Stocks: Performance Trends Table, Stock Charts
Sort Consumer Services: Daily, Weekly, Year-to-Date, Market Cap & Trends. Filter Services & Goods stocks list by size: All Large Mid-Range Small |
| 12Stocks.com Consumer Services Stocks Performances & Trends Daily | |||||||||
|
|  The overall Smart Investing & Trading Score is 58 (0-bearish to 100-bullish) which puts Consumer Services sector in short term neutral trend. The Smart Investing & Trading Score from previous trading session is 23 and hence an improvement of trend.
| ||||||||
Here are the Smart Investing & Trading Scores of the most requested Consumer Services stocks at 12Stocks.com (click stock name for detailed review):
|


| Consider signing up for our daily 12Stocks.com "Best Stocks Newsletter". You will never ever miss a big stock move again! |
| 12Stocks.com: Investing in Consumer Services sector with Stocks | |
|
The following table helps investors and traders sort through current performance and trends (as measured by Smart Investing & Trading Score) of various
stocks in the Consumer Services sector. Quick View: Move mouse or cursor over stock symbol (ticker) to view short-term Technical chart and over stock name to view long term chart. Click on  to add stock symbol to your watchlist and to add stock symbol to your watchlist and  to view watchlist. Click on any ticker or stock name for detailed market intelligence report for that stock. to view watchlist. Click on any ticker or stock name for detailed market intelligence report for that stock. |
12Stocks.com Performance of Stocks in Consumer Services Sector
| Ticker | Stock Name | Watchlist | Category | Recent Price | Smart Investing & Trading Score | Change % | YTD Change% |
| GWW | W.W. Grainger |   | Equipment | 955.79 | 58 | 1.46% | 15.34% |
| DPZ | Domino s | | Restaurants | 481.16 | 61 | 2.10% | 16.72% |
| YSG | Yatsen Holding | | Specialty Retail | 3.93 | 95 | 3.42% | 437.18% |
| OMC | Omnicom | | Advertising | 94.22 | 95 | 0.48% | 8.91% |
| CCL | Carnival | | Casinos | 14.79 | 49 | 3.57% | -20.23% |
| TRU | TransUnion | | Services | 69.49 | 45 | 2.81% | 1.14% |
| EDR | Endeavor | | Entertainment | 26.35 | 43 | -0.26% | 11.04% |
| CUK | Carnival | | Entertainment | 13.42 | 49 | 3.71% | -20.40% |
| ONON | On Holding | | Footwear & Accessories | 32.56 | 58 | 1.97% | 19.35% |
| VIPS | Vipshop | | Retail | 15.79 | 45 | 1.22% | -11.09% |
| TW | Tradeweb Markets | | Services | 101.83 | 59 | 0.21% | 12.05% |
| BURL | Burlington Stores | | Retail | 180.75 | 32 | 1.75% | -7.06% |
| J | Jacobs Engineering | | Services | 144.63 | 63 | 0.36% | 11.43% |
| TSCO | Tractor Supply | | Retail | 255.96 | 90 | 1.02% | 19.03% |
| QSR | Restaurant Brands | | Restaurants | 74.35 | 57 | 1.43% | -4.84% |
| ULTA | Ulta Beauty | | Retail | 419.27 | 17 | 0.31% | -14.43% |
| HTHT | Huazhu | | Lodging | 38.65 | 80 | 2.38% | 15.58% |
| BAH | Booz Allen | | Services | 145.96 | 73 | 2.06% | 14.11% |
| MGA | Magna | | Auto Parts | 49.77 | 42 | 0.93% | -15.76% |
| QGEN | QIAGEN N.V | | Research | 41.89 | 74 | 1.63% | -3.55% |
| GPC | Genuine Parts | | Auto Parts | 163.38 | 100 | 0.18% | 17.96% |
| ALLE | Allegion | | Security | 126.97 | 58 | 1.24% | 0.22% |
| LYV | Live Nation | | Entertainment | 90.09 | 51 | 1.85% | -3.75% |
| KMX | CarMax | | Automobile | 69.69 | 32 | 2.67% | -9.19% |
| EXPE | Expedia | | Lodging | 135.02 | 64 | 2.61% | -11.05% |
| For chart view version of above stock list: Chart View ➞ 0 - 25 , 25 - 50 , 50 - 75 , 75 - 100 , 100 - 125 , 125 - 150 , 150 - 175 , 175 - 200 , 200 - 225 , 225 - 250 , 250 - 275 , 275 - 300 , 300 - 325 , 325 - 350 , 350 - 375 , 375 - 400 , 400 - 425 , 425 - 450 , 450 - 475 | ||
 | Click To Change The Sort Order: By Market Cap or Company Size Performance: Year-to-date, Week and Day |  |
|
Get the most comprehensive stock market coverage daily at 12Stocks.com ➞ Best Stocks Today ➞ Best Stocks Weekly ➞ Best Stocks Year-to-Date ➞ Best Stocks Trends ➞  Best Stocks Today 12Stocks.com Best Nasdaq Stocks ➞ Best S&P 500 Stocks ➞ Best Tech Stocks ➞ Best Biotech Stocks ➞ |
| Detailed Overview of Consumer Services Stocks |
| Consumer Services Technical Overview, Leaders & Laggards, Top Consumer Services ETF Funds & Detailed Consumer Services Stocks List, Charts, Trends & More |
| Consumer Services Sector: Technical Analysis, Trends & YTD Performance | |
| Consumer Services sector is composed of stocks
from retail, entertainment, media/publishing, consumer goods
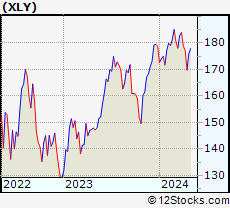
and services subsectors. Consumer Services sector, as represented by XLY, an exchange-traded fund [ETF] that holds basket of Consumer Services stocks (e.g, Walmart, Alibaba) is down by -3.51% and is currently underperforming the overall market by -9.15% year-to-date. Below is a quick view of Technical charts and trends: |
|
 XLY Weekly Chart |
|
| Long Term Trend: Good | |
| Medium Term Trend: Not Good | |
 XLY Daily Chart |
|
| Short Term Trend: Very Good | |
| Overall Trend Score: 58 | |
| YTD Performance: -3.51% | |
| **Trend Scores & Views Are Only For Educational Purposes And Not For Investing | |
| 12Stocks.com: Top Performing Consumer Services Sector Stocks | ||||||||||||||||||||||||||||||||||||||||||||||||
 The top performing Consumer Services sector stocks year to date are
Now, more recently, over last week, the top performing Consumer Services sector stocks on the move are


|
||||||||||||||||||||||||||||||||||||||||||||||||
| 12Stocks.com: Investing in Consumer Services Sector using Exchange Traded Funds | |
|
The following table shows list of key exchange traded funds (ETF) that
help investors track Consumer Services Index. For detailed view, check out our ETF Funds section of our website. Quick View: Move mouse or cursor over ETF symbol (ticker) to view short-term Technical chart and over ETF name to view long term chart. Click on ticker or stock name for detailed view. Click on to add stock symbol to your watchlist and to view watchlist. |
12Stocks.com List of ETFs that track Consumer Services Index
| Ticker | ETF Name | Watchlist | Recent Price | Smart Investing & Trading Score | Change % | Week % | Year-to-date % |
| XLY | Consumer Discret Sel | | 172.54 | 58 | 1.19 | 1.64 | -3.51% |
| RTH | Retail | | 200.49 | 58 | 0.15 | 0.94 | 6.51% |
| IYC | Consumer Services | | 77.59 | 51 | 1.27 | 1.73 | 2.4% |
| XRT | Retail | | 73.04 | 70 | 2.20 | 2.63 | 1% |
| IYK | Consumer Goods | | 66.54 | 100 | 0.18 | 1.11 | 4.13% |
| UCC | Consumer Services | | 32.68 | 45 | 1.64 | 3.49 | -8.99% |
| RETL | Retail Bull 3X | | 8.73 | 70 | 5.95 | 7.51 | -4.28% |
| RXI | Globl Consumer Discretionary | | 159.29 | 58 | 1.23 | 1.36 | 0.14% |
| SCC | Short Consumer Services | | 16.43 | 42 | -2.23 | -3.12 | 7.19% |
| UGE | Consumer Goods | | 17.03 | 80 | 0.29 | 2.42 | 8.19% |
| 12Stocks.com: Charts, Trends, Fundamental Data and Performances of Consumer Services Stocks | |
|
We now take in-depth look at all Consumer Services stocks including charts, multi-period performances and overall trends (as measured by Smart Investing & Trading Score). One can sort Consumer Services stocks (click link to choose) by Daily, Weekly and by Year-to-Date performances. Also, one can sort by size of the company or by market capitalization. |
| Select Your Default Chart Type: | |||||
| |||||
| Click on stock symbol or name for detailed view. Click on to add stock symbol to your watchlist and to view watchlist. Quick View: Move mouse or cursor over "Daily" to quickly view daily Technical stock chart and over "Weekly" to view weekly Technical stock chart. | |||||

 | GWW W.W. Grainger, Inc. |
| Sector: Services & Goods | |
| SubSector: Industrial Equipment Wholesale | |
| MarketCap: 12794.8 Millions | |
| Recent Price: 955.79 Smart Investing & Trading Score: 58 | |
| Day Percent Change: 1.46% Day Change: 13.72 | |
| Week Change: 1.39% Year-to-date Change: 15.3% | |
| GWW Links: Profile News Message Board | |
| Charts:- Daily , Weekly | |
| Add GWW to Watchlist: View: Get Complete GWW Trend Analysis ➞ | |
 | DPZ Domino s Pizza, Inc. |
| Sector: Services & Goods | |
| SubSector: Restaurants | |
| MarketCap: 12166 Millions | |
| Recent Price: 481.16 Smart Investing & Trading Score: 61 | |
| Day Percent Change: 2.10% Day Change: 9.88 | |
| Week Change: 1.61% Year-to-date Change: 16.7% | |
| DPZ Links: Profile News Message Board | |
| Charts:- Daily , Weekly | |
| Add DPZ to Watchlist: View: Get Complete DPZ Trend Analysis ➞ | |
 | YSG Yatsen Holding Limited |
| Sector: Services & Goods | |
| SubSector: Specialty Retail | |
| MarketCap: 11827 Millions | |
| Recent Price: 3.93 Smart Investing & Trading Score: 95 | |
| Day Percent Change: 3.42% Day Change: 0.13 | |
| Week Change: 8.71% Year-to-date Change: 437.2% | |
| YSG Links: Profile News Message Board | |
| Charts:- Daily , Weekly | |
| Add YSG to Watchlist: View: Get Complete YSG Trend Analysis ➞ | |
 | OMC Omnicom Group Inc. |
| Sector: Services & Goods | |
| SubSector: Advertising Agencies | |
| MarketCap: 11813.5 Millions | |
| Recent Price: 94.22 Smart Investing & Trading Score: 95 | |
| Day Percent Change: 0.48% Day Change: 0.45 | |
| Week Change: 1.73% Year-to-date Change: 8.9% | |
| OMC Links: Profile News Message Board | |
| Charts:- Daily , Weekly | |
| Add OMC to Watchlist: View: Get Complete OMC Trend Analysis ➞ | |
 | CCL Carnival Corporation & Plc |
| Sector: Services & Goods | |
| SubSector: Resorts & Casinos | |
| MarketCap: 11725.4 Millions | |
| Recent Price: 14.79 Smart Investing & Trading Score: 49 | |
| Day Percent Change: 3.57% Day Change: 0.51 | |
| Week Change: 4.75% Year-to-date Change: -20.2% | |
| CCL Links: Profile News Message Board | |
| Charts:- Daily , Weekly | |
| Add CCL to Watchlist: View: Get Complete CCL Trend Analysis ➞ | |
 | TRU TransUnion |
| Sector: Services & Goods | |
| SubSector: Business Services | |
| MarketCap: 11457.2 Millions | |
| Recent Price: 69.49 Smart Investing & Trading Score: 45 | |
| Day Percent Change: 2.81% Day Change: 1.90 | |
| Week Change: 4.18% Year-to-date Change: 1.1% | |
| TRU Links: Profile News Message Board | |
| Charts:- Daily , Weekly | |
| Add TRU to Watchlist: View: Get Complete TRU Trend Analysis ➞ | |
 | EDR Endeavor Group Holdings, Inc. |
| Sector: Services & Goods | |
| SubSector: Entertainment | |
| MarketCap: 11310 Millions | |
| Recent Price: 26.35 Smart Investing & Trading Score: 43 | |
| Day Percent Change: -0.26% Day Change: -0.07 | |
| Week Change: -0.57% Year-to-date Change: 11.0% | |
| EDR Links: Profile News Message Board | |
| Charts:- Daily , Weekly | |
| Add EDR to Watchlist: View: Get Complete EDR Trend Analysis ➞ | |
 | CUK Carnival Corporation & Plc |
| Sector: Services & Goods | |
| SubSector: General Entertainment | |
| MarketCap: 10703.9 Millions | |
| Recent Price: 13.42 Smart Investing & Trading Score: 49 | |
| Day Percent Change: 3.71% Day Change: 0.48 | |
| Week Change: 5.42% Year-to-date Change: -20.4% | |
| CUK Links: Profile News Message Board | |
| Charts:- Daily , Weekly | |
| Add CUK to Watchlist: View: Get Complete CUK Trend Analysis ➞ | |
 | ONON On Holding AG |
| Sector: Services & Goods | |
| SubSector: Footwear & Accessories | |
| MarketCap: 10600 Millions | |
| Recent Price: 32.56 Smart Investing & Trading Score: 58 | |
| Day Percent Change: 1.97% Day Change: 0.63 | |
| Week Change: 3.1% Year-to-date Change: 19.4% | |
| ONON Links: Profile News Message Board | |
| Charts:- Daily , Weekly | |
| Add ONON to Watchlist: View: Get Complete ONON Trend Analysis ➞ | |
 | VIPS Vipshop Holdings Limited |
| Sector: Services & Goods | |
| SubSector: Catalog & Mail Order Houses | |
| MarketCap: 10496.2 Millions | |
| Recent Price: 15.79 Smart Investing & Trading Score: 45 | |
| Day Percent Change: 1.22% Day Change: 0.19 | |
| Week Change: 4.16% Year-to-date Change: -11.1% | |
| VIPS Links: Profile News Message Board | |
| Charts:- Daily , Weekly | |
| Add VIPS to Watchlist: View: Get Complete VIPS Trend Analysis ➞ | |
 | TW Tradeweb Markets Inc. |
| Sector: Services & Goods | |
| SubSector: Management Services | |
| MarketCap: 9913.35 Millions | |
| Recent Price: 101.83 Smart Investing & Trading Score: 59 | |
| Day Percent Change: 0.21% Day Change: 0.21 | |
| Week Change: 0.79% Year-to-date Change: 12.1% | |
| TW Links: Profile News Message Board | |
| Charts:- Daily , Weekly | |
| Add TW to Watchlist: View: Get Complete TW Trend Analysis ➞ | |
 | BURL Burlington Stores, Inc. |
| Sector: Services & Goods | |
| SubSector: Discount, Variety Stores | |
| MarketCap: 9801.42 Millions | |
| Recent Price: 180.75 Smart Investing & Trading Score: 32 | |
| Day Percent Change: 1.75% Day Change: 3.11 | |
| Week Change: 1.22% Year-to-date Change: -7.1% | |
| BURL Links: Profile News Message Board | |
| Charts:- Daily , Weekly | |
| Add BURL to Watchlist: View: Get Complete BURL Trend Analysis ➞ | |
 | J Jacobs Engineering Group Inc. |
| Sector: Services & Goods | |
| SubSector: Technical Services | |
| MarketCap: 9714.8 Millions | |
| Recent Price: 144.63 Smart Investing & Trading Score: 63 | |
| Day Percent Change: 0.36% Day Change: 0.52 | |
| Week Change: 0.56% Year-to-date Change: 11.4% | |
| J Links: Profile News Message Board | |
| Charts:- Daily , Weekly | |
| Add J to Watchlist: View: Get Complete J Trend Analysis ➞ | |
 | TSCO Tractor Supply Company |
| Sector: Services & Goods | |
| SubSector: Specialty Retail, Other | |
| MarketCap: 9692.94 Millions | |
| Recent Price: 255.96 Smart Investing & Trading Score: 90 | |
| Day Percent Change: 1.02% Day Change: 2.58 | |
| Week Change: 1.25% Year-to-date Change: 19.0% | |
| TSCO Links: Profile News Message Board | |
| Charts:- Daily , Weekly | |
| Add TSCO to Watchlist: View: Get Complete TSCO Trend Analysis ➞ | |
 | QSR Restaurant Brands International Inc. |
| Sector: Services & Goods | |
| SubSector: Restaurants | |
| MarketCap: 9551 Millions | |
| Recent Price: 74.35 Smart Investing & Trading Score: 57 | |
| Day Percent Change: 1.43% Day Change: 1.05 | |
| Week Change: 4.1% Year-to-date Change: -4.8% | |
| QSR Links: Profile News Message Board | |
| Charts:- Daily , Weekly | |
| Add QSR to Watchlist: View: Get Complete QSR Trend Analysis ➞ | |
 | ULTA Ulta Beauty, Inc. |
| Sector: Services & Goods | |
| SubSector: Specialty Retail, Other | |
| MarketCap: 9429.94 Millions | |
| Recent Price: 419.27 Smart Investing & Trading Score: 17 | |
| Day Percent Change: 0.31% Day Change: 1.29 | |
| Week Change: 1.4% Year-to-date Change: -14.4% | |
| ULTA Links: Profile News Message Board | |
| Charts:- Daily , Weekly | |
| Add ULTA to Watchlist: View: Get Complete ULTA Trend Analysis ➞ | |
 | HTHT Huazhu Group Limited |
| Sector: Services & Goods | |
| SubSector: Lodging | |
| MarketCap: 9164.46 Millions | |
| Recent Price: 38.65 Smart Investing & Trading Score: 80 | |
| Day Percent Change: 2.38% Day Change: 0.90 | |
| Week Change: 4.77% Year-to-date Change: 15.6% | |
| HTHT Links: Profile News Message Board | |
| Charts:- Daily , Weekly | |
| Add HTHT to Watchlist: View: Get Complete HTHT Trend Analysis ➞ | |
 | BAH Booz Allen Hamilton Holding Corporation |
| Sector: Services & Goods | |
| SubSector: Management Services | |
| MarketCap: 9037.35 Millions | |
| Recent Price: 145.96 Smart Investing & Trading Score: 73 | |
| Day Percent Change: 2.06% Day Change: 2.95 | |
| Week Change: 2.69% Year-to-date Change: 14.1% | |
| BAH Links: Profile News Message Board | |
| Charts:- Daily , Weekly | |
| Add BAH to Watchlist: View: Get Complete BAH Trend Analysis ➞ | |
 | MGA Magna International Inc. |
| Sector: Services & Goods | |
| SubSector: Auto Parts Wholesale | |
| MarketCap: 8967.3 Millions | |
| Recent Price: 49.77 Smart Investing & Trading Score: 42 | |
| Day Percent Change: 0.93% Day Change: 0.46 | |
| Week Change: 2.96% Year-to-date Change: -15.8% | |
| MGA Links: Profile News Message Board | |
| Charts:- Daily , Weekly | |
| Add MGA to Watchlist: View: Get Complete MGA Trend Analysis ➞ | |
 | QGEN QIAGEN N.V. |
| Sector: Services & Goods | |
| SubSector: Research Services | |
| MarketCap: 8698.94 Millions | |
| Recent Price: 41.89 Smart Investing & Trading Score: 74 | |
| Day Percent Change: 1.63% Day Change: 0.67 | |
| Week Change: 4.72% Year-to-date Change: -3.6% | |
| QGEN Links: Profile News Message Board | |
| Charts:- Daily , Weekly | |
| Add QGEN to Watchlist: View: Get Complete QGEN Trend Analysis ➞ | |
 | GPC Genuine Parts Company |
| Sector: Services & Goods | |
| SubSector: Auto Parts Stores | |
| MarketCap: 8605.9 Millions | |
| Recent Price: 163.38 Smart Investing & Trading Score: 100 | |
| Day Percent Change: 0.18% Day Change: 0.29 | |
| Week Change: 0.61% Year-to-date Change: 18.0% | |
| GPC Links: Profile News Message Board | |
| Charts:- Daily , Weekly | |
| Add GPC to Watchlist: View: Get Complete GPC Trend Analysis ➞ | |
 | ALLE Allegion plc |
| Sector: Services & Goods | |
| SubSector: Security & Protection Services | |
| MarketCap: 8515.93 Millions | |
| Recent Price: 126.97 Smart Investing & Trading Score: 58 | |
| Day Percent Change: 1.24% Day Change: 1.55 | |
| Week Change: 1.41% Year-to-date Change: 0.2% | |
| ALLE Links: Profile News Message Board | |
| Charts:- Daily , Weekly | |
| Add ALLE to Watchlist: View: Get Complete ALLE Trend Analysis ➞ | |
 | LYV Live Nation Entertainment, Inc. |
| Sector: Services & Goods | |
| SubSector: Entertainment - Diversified | |
| MarketCap: 8457.17 Millions | |
| Recent Price: 90.09 Smart Investing & Trading Score: 51 | |
| Day Percent Change: 1.85% Day Change: 1.64 | |
| Week Change: 0.14% Year-to-date Change: -3.8% | |
| LYV Links: Profile News Message Board | |
| Charts:- Daily , Weekly | |
| Add LYV to Watchlist: View: Get Complete LYV Trend Analysis ➞ | |
 | KMX CarMax, Inc. |
| Sector: Services & Goods | |
| SubSector: Auto Dealerships | |
| MarketCap: 8121.71 Millions | |
| Recent Price: 69.69 Smart Investing & Trading Score: 32 | |
| Day Percent Change: 2.67% Day Change: 1.81 | |
| Week Change: 1.98% Year-to-date Change: -9.2% | |
| KMX Links: Profile News Message Board | |
| Charts:- Daily , Weekly | |
| Add KMX to Watchlist: View: Get Complete KMX Trend Analysis ➞ | |
 | EXPE Expedia Group, Inc. |
| Sector: Services & Goods | |
| SubSector: Lodging | |
| MarketCap: 8052.96 Millions | |
| Recent Price: 135.02 Smart Investing & Trading Score: 64 | |
| Day Percent Change: 2.61% Day Change: 3.43 | |
| Week Change: 4.67% Year-to-date Change: -11.1% | |
| EXPE Links: Profile News Message Board | |
| Charts:- Daily , Weekly | |
| Add EXPE to Watchlist: View: Get Complete EXPE Trend Analysis ➞ | |
| For tabular summary view of above stock list: Summary View ➞ 0 - 25 , 25 - 50 , 50 - 75 , 75 - 100 , 100 - 125 , 125 - 150 , 150 - 175 , 175 - 200 , 200 - 225 , 225 - 250 , 250 - 275 , 275 - 300 , 300 - 325 , 325 - 350 , 350 - 375 , 375 - 400 , 400 - 425 , 425 - 450 , 450 - 475 | ||
| Click To Change The Sort Order: By Market Cap or Company Size Performance: Year-to-date, Week and Day | |
| Select Chart Type: | ||
|
Best Stocks Today 12Stocks.com |
© 2024 12Stocks.com Terms & Conditions Privacy Contact Us
All Information Provided Only For Education And Not To Be Used For Investing or Trading. See Terms & Conditions


One More Thing ... Get Best Stocks Delivered Daily!
Never Ever Miss A Move With Our Top Ten Stocks Lists
Find Best Stocks In Any Market - Bull or Bear Market
Take A Peek At Our Top Ten Stocks Lists: Daily, Weekly, Year-to-Date & Top Trends
Find Best Stocks In Any Market - Bull or Bear Market
Take A Peek At Our Top Ten Stocks Lists: Daily, Weekly, Year-to-Date & Top Trends
Consumer Services Stocks With Best Up Trends [0-bearish to 100-bullish]: Hibbett Sports[100], Gannett Co[100], MYT Netherlands[100], Dillard s[100], Napco Security[100], Lands [100], MINISO [100], Brinker [100], Boot Barn[100], Cheesecake Factory[100], Deluxe [100]
Best Consumer Services Stocks Year-to-Date:
U Power[2801.79%], Vroom [1827.73%], Yatsen Holding[437.18%], Fluent [289.55%], Codere Online[134.25%], Research[101.58%], Sweetgreen [96.9%], RealReal [71.64%], Bright Scholar[64.8%], Spotify Technology[61.41%], PaySign [59.64%] Best Consumer Services Stocks This Week:
Hibbett Sports[21.1%], Noodles & [17.65%], Jumia Technologies[17.51%], Allbirds [15.68%], DoubleDown Interactive[15.06%], Pinduoduo [12.8%], MYT Netherlands[12.01%], China Online[11.9%], iHeartMedia [11.58%], Zumiez [11.4%], Ameresco [11.12%] Best Consumer Services Stocks Daily:
Hibbett Sports[18.84%], SES AI[12.17%], Golden Heaven[11.75%], Spotify Technology[11.41%], Jumia Technologies[11.30%], Sweetgreen [9.50%], Designer Brands[9.49%], Ameresco [9.43%], China Online[9.37%], iHeartMedia [9.00%], Noodles & [8.95%]