
 Login Sign Up


| |||||
 |  | ||||

| 12Stocks.com Market Intelligence |
Best Consumer Services Stocks
| In a hurry? Services & Goods Stocks: Performance Trends Table, Stock Charts
Sort Consumer Services: Daily, Weekly, Year-to-Date, Market Cap & Trends. Filter Services & Goods stocks list by size: All Large Mid-Range Small |
| 12Stocks.com Consumer Services Stocks Performances & Trends Daily | |||||||||
|
|  The overall Smart Investing & Trading Score is 23 (0-bearish to 100-bullish) which puts Consumer Services sector in short term bearish to neutral trend. The Smart Investing & Trading Score from previous trading session is 13 and hence an improvement of trend.
| ||||||||
Here are the Smart Investing & Trading Scores of the most requested Consumer Services stocks at 12Stocks.com (click stock name for detailed review):
|


| Consider signing up for our daily 12Stocks.com "Best Stocks Newsletter". You will never ever miss a big stock move again! |
| 12Stocks.com: Investing in Consumer Services sector with Stocks | |
|
The following table helps investors and traders sort through current performance and trends (as measured by Smart Investing & Trading Score) of various
stocks in the Consumer Services sector. Quick View: Move mouse or cursor over stock symbol (ticker) to view short-term Technical chart and over stock name to view long term chart. Click on  to add stock symbol to your watchlist and to add stock symbol to your watchlist and  to view watchlist. Click on any ticker or stock name for detailed market intelligence report for that stock. to view watchlist. Click on any ticker or stock name for detailed market intelligence report for that stock. |
12Stocks.com Performance of Stocks in Consumer Services Sector
| Ticker | Stock Name | Watchlist | Category | Recent Price | Smart Investing & Trading Score | Change % | YTD Change% |
| NEWT | Newtek Business |   | Services | 11.06 | 52 | 1.47% | -19.86% |
| DXPE | DXP Enterprises | | Equipment | 50.05 | 46 | -0.83% | 48.52% |
| FC | Franklin Covey | | Education | 39.91 | 74 | 1.09% | -8.32% |
| EM | Smart Share | | Services | 0.65 | 71 | 0.78% | 25.24% |
| WLDN | Willdan | | Services | 27.17 | 75 | 1.19% | 26.37% |
| HZO | MarineMax | | Retail | 27.67 | 32 | -1.28% | -28.87% |
| RGS | Regis | | Services | 5.45 | 20 | 0.68% | -42.33% |
| BARK | BARK | | Specialty Retail | 1.10 | 58 | 2.80% | 37.47% |
| GDHG | Golden Heaven | | Leisure | 0.23 | 25 | -3.28% | -68.86% |
| DFIN | Donnelley Financial | | Services | 63.92 | 90 | 2.73% | 2.49% |
| OSW | OneSpaWorld | | Casinos | 12.35 | 32 | 0.32% | -12.41% |
| HYZN | Hyzon Motors | | Auto Manufacturers | 0.57 | 10 | -4.60% | -36.03% |
| VLGEA | Village Super | | Grocery | 27.20 | 56 | -1.27% | 3.70% |
| GCI | Gannett Co | | Publishing | 2.54 | 90 | -2.31% | 10.43% |
| PKOH | Park-Ohio | | Equipment | 23.55 | 32 | -1.46% | -12.65% |
| PAYS | PaySign | | Services | 4.28 | 51 | -1.83% | 52.86% |
| NATH | Nathan s | | Restaurants | 64.87 | 25 | -0.11% | -16.84% |
| CRAI | CRA | | Services | 147.25 | 83 | 1.10% | 48.96% |
| SECO | Secoo Holding | | Retail | 0.43 | 64 | 2.60% | -23.91% |
| TITN | Titan Machinery | | Equipment | 23.01 | 52 | -0.99% | -20.33% |
| EVI | EVI Industries | | Consumer Services | 21.82 | 25 | -0.73% | -8.05% |
| QUAD | Quad/Graphics | | Services | 4.62 | 25 | -0.22% | -14.76% |
| JMIA | Jumia Technologies | | Retail | 4.16 | 63 | 5.58% | 17.85% |
| RUSHB | Rush Enterprises | | Automobile | 46.00 | 42 | -1.12% | -13.17% |
| CSSEP | Chicken Soup | | Broadcasting | 0.39 | 20 | -1.85% | -91.26% |
| For chart view version of above stock list: Chart View ➞ 0 - 25 , 25 - 50 , 50 - 75 , 75 - 100 , 100 - 125 , 125 - 150 , 150 - 175 , 175 - 200 , 200 - 225 , 225 - 250 , 250 - 275 , 275 - 300 , 300 - 325 , 325 - 350 , 350 - 375 , 375 - 400 , 400 - 425 , 425 - 450 , 450 - 475 | ||
 | Click To Change The Sort Order: By Market Cap or Company Size Performance: Year-to-date, Week and Day |  |
|
Get the most comprehensive stock market coverage daily at 12Stocks.com ➞ Best Stocks Today ➞ Best Stocks Weekly ➞ Best Stocks Year-to-Date ➞ Best Stocks Trends ➞  Best Stocks Today 12Stocks.com Best Nasdaq Stocks ➞ Best S&P 500 Stocks ➞ Best Tech Stocks ➞ Best Biotech Stocks ➞ |
| Detailed Overview of Consumer Services Stocks |
| Consumer Services Technical Overview, Leaders & Laggards, Top Consumer Services ETF Funds & Detailed Consumer Services Stocks List, Charts, Trends & More |
| Consumer Services Sector: Technical Analysis, Trends & YTD Performance | |
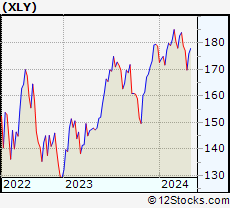
| Consumer Services sector is composed of stocks
from retail, entertainment, media/publishing, consumer goods
and services subsectors. Consumer Services sector, as represented by XLY, an exchange-traded fund [ETF] that holds basket of Consumer Services stocks (e.g, Walmart, Alibaba) is down by -4.64% and is currently underperforming the overall market by -9.03% year-to-date. Below is a quick view of Technical charts and trends: |
|
 XLY Weekly Chart |
|
| Long Term Trend: Not Good | |
| Medium Term Trend: Not Good | |
 XLY Daily Chart |
|
| Short Term Trend: Deteriorating | |
| Overall Trend Score: 23 | |
| YTD Performance: -4.64% | |
| **Trend Scores & Views Are Only For Educational Purposes And Not For Investing | |
| 12Stocks.com: Top Performing Consumer Services Sector Stocks | ||||||||||||||||||||||||||||||||||||||||||||||||
 The top performing Consumer Services sector stocks year to date are
Now, more recently, over last week, the top performing Consumer Services sector stocks on the move are


|
||||||||||||||||||||||||||||||||||||||||||||||||
| 12Stocks.com: Investing in Consumer Services Sector using Exchange Traded Funds | |
|
The following table shows list of key exchange traded funds (ETF) that
help investors track Consumer Services Index. For detailed view, check out our ETF Funds section of our website. Quick View: Move mouse or cursor over ETF symbol (ticker) to view short-term Technical chart and over ETF name to view long term chart. Click on ticker or stock name for detailed view. Click on to add stock symbol to your watchlist and to view watchlist. |
12Stocks.com List of ETFs that track Consumer Services Index
| Ticker | ETF Name | Watchlist | Recent Price | Smart Investing & Trading Score | Change % | Week % | Year-to-date % |
| XLY | Consumer Discret Sel | | 170.51 | 23 | 0.44 | 0.44 | -4.64% |
| RTH | Retail | | 200.18 | 51 | 0.78 | 0.78 | 6.35% |
| IYC | Consumer Services | | 76.62 | 43 | 0.46 | 0.46 | 1.12% |
| XRT | Retail | | 71.47 | 58 | 0.42 | 0.42 | -1.18% |
| IYK | Consumer Goods | | 66.42 | 100 | 0.93 | 0.93 | 3.94% |
| UCC | Consumer Services | | 32.15 | 25 | 1.82 | 1.82 | -10.46% |
| RETL | Retail Bull 3X | | 8.24 | 63 | 1.48 | 1.48 | -9.65% |
| RXI | Globl Consumer Discretionary | | 157.35 | 51 | 0.13 | 0.13 | -1.08% |
| SCC | Short Consumer Services | | 16.80 | 70 | -0.91 | -0.91 | 9.63% |
| UGE | Consumer Goods | | 16.98 | 80 | 2.12 | 2.12 | 7.87% |
| 12Stocks.com: Charts, Trends, Fundamental Data and Performances of Consumer Services Stocks | |
|
We now take in-depth look at all Consumer Services stocks including charts, multi-period performances and overall trends (as measured by Smart Investing & Trading Score). One can sort Consumer Services stocks (click link to choose) by Daily, Weekly and by Year-to-Date performances. Also, one can sort by size of the company or by market capitalization. |
| Select Your Default Chart Type: | |||||
| |||||
| Click on stock symbol or name for detailed view. Click on to add stock symbol to your watchlist and to view watchlist. Quick View: Move mouse or cursor over "Daily" to quickly view daily Technical stock chart and over "Weekly" to view weekly Technical stock chart. | |||||

 | NEWT Newtek Business Services Corp. |
| Sector: Services & Goods | |
| SubSector: Business Services | |
| MarketCap: 243.982 Millions | |
| Recent Price: 11.06 Smart Investing & Trading Score: 52 | |
| Day Percent Change: 1.47% Day Change: 0.16 | |
| Week Change: 1.47% Year-to-date Change: -19.9% | |
| NEWT Links: Profile News Message Board | |
| Charts:- Daily , Weekly | |
| Add NEWT to Watchlist: View: Get Complete NEWT Trend Analysis ➞ | |
 | DXPE DXP Enterprises, Inc. |
| Sector: Services & Goods | |
| SubSector: Industrial Equipment Wholesale | |
| MarketCap: 243.758 Millions | |
| Recent Price: 50.05 Smart Investing & Trading Score: 46 | |
| Day Percent Change: -0.83% Day Change: -0.42 | |
| Week Change: -0.83% Year-to-date Change: 48.5% | |
| DXPE Links: Profile News Message Board | |
| Charts:- Daily , Weekly | |
| Add DXPE to Watchlist: View: Get Complete DXPE Trend Analysis ➞ | |
 | FC Franklin Covey Co. |
| Sector: Services & Goods | |
| SubSector: Education & Training Services | |
| MarketCap: 243.306 Millions | |
| Recent Price: 39.91 Smart Investing & Trading Score: 74 | |
| Day Percent Change: 1.09% Day Change: 0.43 | |
| Week Change: 1.09% Year-to-date Change: -8.3% | |
| FC Links: Profile News Message Board | |
| Charts:- Daily , Weekly | |
| Add FC to Watchlist: View: Get Complete FC Trend Analysis ➞ | |
 | EM Smart Share Global Limited |
| Sector: Services & Goods | |
| SubSector: Personal Services | |
| MarketCap: 238 Millions | |
| Recent Price: 0.65 Smart Investing & Trading Score: 71 | |
| Day Percent Change: 0.78% Day Change: 0.01 | |
| Week Change: 0.78% Year-to-date Change: 25.2% | |
| EM Links: Profile News Message Board | |
| Charts:- Daily , Weekly | |
| Add EM to Watchlist: View: Get Complete EM Trend Analysis ➞ | |
 | WLDN Willdan Group, Inc. |
| Sector: Services & Goods | |
| SubSector: Technical Services | |
| MarketCap: 235.61 Millions | |
| Recent Price: 27.17 Smart Investing & Trading Score: 75 | |
| Day Percent Change: 1.19% Day Change: 0.32 | |
| Week Change: 1.19% Year-to-date Change: 26.4% | |
| WLDN Links: Profile News Message Board | |
| Charts:- Daily , Weekly | |
| Add WLDN to Watchlist: View: Get Complete WLDN Trend Analysis ➞ | |
 | HZO MarineMax, Inc. |
| Sector: Services & Goods | |
| SubSector: Specialty Retail, Other | |
| MarketCap: 234.744 Millions | |
| Recent Price: 27.67 Smart Investing & Trading Score: 32 | |
| Day Percent Change: -1.28% Day Change: -0.36 | |
| Week Change: -1.28% Year-to-date Change: -28.9% | |
| HZO Links: Profile News Message Board | |
| Charts:- Daily , Weekly | |
| Add HZO to Watchlist: View: Get Complete HZO Trend Analysis ➞ | |
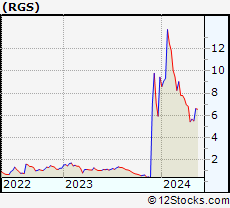 | RGS Regis Corporation |
| Sector: Services & Goods | |
| SubSector: Personal Services | |
| MarketCap: 234.625 Millions | |
| Recent Price: 5.45 Smart Investing & Trading Score: 20 | |
| Day Percent Change: 0.68% Day Change: 0.04 | |
| Week Change: 0.68% Year-to-date Change: -42.3% | |
| RGS Links: Profile News Message Board | |
| Charts:- Daily , Weekly | |
| Add RGS to Watchlist: View: Get Complete RGS Trend Analysis ➞ | |
 | BARK BARK, Inc. |
| Sector: Services & Goods | |
| SubSector: Specialty Retail | |
| MarketCap: 234 Millions | |
| Recent Price: 1.10 Smart Investing & Trading Score: 58 | |
| Day Percent Change: 2.80% Day Change: 0.03 | |
| Week Change: 2.8% Year-to-date Change: 37.5% | |
| BARK Links: Profile News Message Board | |
| Charts:- Daily , Weekly | |
| Add BARK to Watchlist: View: Get Complete BARK Trend Analysis ➞ | |
 | GDHG Golden Heaven Group Holdings Ltd. |
| Sector: Services & Goods | |
| SubSector: Leisure | |
| MarketCap: 230 Millions | |
| Recent Price: 0.23 Smart Investing & Trading Score: 25 | |
| Day Percent Change: -3.28% Day Change: -0.01 | |
| Week Change: -3.28% Year-to-date Change: -68.9% | |
| GDHG Links: Profile News Message Board | |
| Charts:- Daily , Weekly | |
| Add GDHG to Watchlist: View: Get Complete GDHG Trend Analysis ➞ | |
 | DFIN Donnelley Financial Solutions, Inc. |
| Sector: Services & Goods | |
| SubSector: Business Services | |
| MarketCap: 229.882 Millions | |
| Recent Price: 63.92 Smart Investing & Trading Score: 90 | |
| Day Percent Change: 2.73% Day Change: 1.70 | |
| Week Change: 2.73% Year-to-date Change: 2.5% | |
| DFIN Links: Profile News Message Board | |
| Charts:- Daily , Weekly | |
| Add DFIN to Watchlist: View: Get Complete DFIN Trend Analysis ➞ | |
 | OSW OneSpaWorld Holdings Limited |
| Sector: Services & Goods | |
| SubSector: Resorts & Casinos | |
| MarketCap: 228.394 Millions | |
| Recent Price: 12.35 Smart Investing & Trading Score: 32 | |
| Day Percent Change: 0.32% Day Change: 0.04 | |
| Week Change: 0.32% Year-to-date Change: -12.4% | |
| OSW Links: Profile News Message Board | |
| Charts:- Daily , Weekly | |
| Add OSW to Watchlist: View: Get Complete OSW Trend Analysis ➞ | |
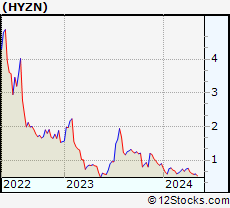 | HYZN Hyzon Motors Inc. |
| Sector: Services & Goods | |
| SubSector: Auto Manufacturers | |
| MarketCap: 223 Millions | |
| Recent Price: 0.57 Smart Investing & Trading Score: 10 | |
| Day Percent Change: -4.60% Day Change: -0.03 | |
| Week Change: -4.6% Year-to-date Change: -36.0% | |
| HYZN Links: Profile News Message Board | |
| Charts:- Daily , Weekly | |
| Add HYZN to Watchlist: View: Get Complete HYZN Trend Analysis ➞ | |
 | VLGEA Village Super Market, Inc. |
| Sector: Services & Goods | |
| SubSector: Grocery Stores | |
| MarketCap: 222.375 Millions | |
| Recent Price: 27.20 Smart Investing & Trading Score: 56 | |
| Day Percent Change: -1.27% Day Change: -0.35 | |
| Week Change: -1.27% Year-to-date Change: 3.7% | |
| VLGEA Links: Profile News Message Board | |
| Charts:- Daily , Weekly | |
| Add VLGEA to Watchlist: View: Get Complete VLGEA Trend Analysis ➞ | |
 | GCI Gannett Co., Inc. |
| Sector: Services & Goods | |
| SubSector: Publishing - Newspapers | |
| MarketCap: 222.322 Millions | |
| Recent Price: 2.54 Smart Investing & Trading Score: 90 | |
| Day Percent Change: -2.31% Day Change: -0.06 | |
| Week Change: -2.31% Year-to-date Change: 10.4% | |
| GCI Links: Profile News Message Board | |
| Charts:- Daily , Weekly | |
| Add GCI to Watchlist: View: Get Complete GCI Trend Analysis ➞ | |
 | PKOH Park-Ohio Holdings Corp. |
| Sector: Services & Goods | |
| SubSector: Industrial Equipment Wholesale | |
| MarketCap: 214.358 Millions | |
| Recent Price: 23.55 Smart Investing & Trading Score: 32 | |
| Day Percent Change: -1.46% Day Change: -0.35 | |
| Week Change: -1.46% Year-to-date Change: -12.7% | |
| PKOH Links: Profile News Message Board | |
| Charts:- Daily , Weekly | |
| Add PKOH to Watchlist: View: Get Complete PKOH Trend Analysis ➞ | |
 | PAYS PaySign, Inc. |
| Sector: Services & Goods | |
| SubSector: Business Services | |
| MarketCap: 213.882 Millions | |
| Recent Price: 4.28 Smart Investing & Trading Score: 51 | |
| Day Percent Change: -1.83% Day Change: -0.08 | |
| Week Change: -1.83% Year-to-date Change: 52.9% | |
| PAYS Links: Profile News Message Board | |
| Charts:- Daily , Weekly | |
| Add PAYS to Watchlist: View: Get Complete PAYS Trend Analysis ➞ | |
 | NATH Nathan s Famous, Inc. |
| Sector: Services & Goods | |
| SubSector: Restaurants | |
| MarketCap: 211.77 Millions | |
| Recent Price: 64.87 Smart Investing & Trading Score: 25 | |
| Day Percent Change: -0.11% Day Change: -0.07 | |
| Week Change: -0.11% Year-to-date Change: -16.8% | |
| NATH Links: Profile News Message Board | |
| Charts:- Daily , Weekly | |
| Add NATH to Watchlist: View: Get Complete NATH Trend Analysis ➞ | |
 | CRAI CRA International, Inc. |
| Sector: Services & Goods | |
| SubSector: Management Services | |
| MarketCap: 209.645 Millions | |
| Recent Price: 147.25 Smart Investing & Trading Score: 83 | |
| Day Percent Change: 1.10% Day Change: 1.60 | |
| Week Change: 1.1% Year-to-date Change: 49.0% | |
| CRAI Links: Profile News Message Board | |
| Charts:- Daily , Weekly | |
| Add CRAI to Watchlist: View: Get Complete CRAI Trend Analysis ➞ | |
 | SECO Secoo Holding Limited |
| Sector: Services & Goods | |
| SubSector: Specialty Retail, Other | |
| MarketCap: 209.144 Millions | |
| Recent Price: 0.43 Smart Investing & Trading Score: 64 | |
| Day Percent Change: 2.60% Day Change: 0.01 | |
| Week Change: 2.6% Year-to-date Change: -23.9% | |
| SECO Links: Profile News Message Board | |
| Charts:- Daily , Weekly | |
| Add SECO to Watchlist: View: Get Complete SECO Trend Analysis ➞ | |
 | TITN Titan Machinery Inc. |
| Sector: Services & Goods | |
| SubSector: Industrial Equipment Wholesale | |
| MarketCap: 208.958 Millions | |
| Recent Price: 23.01 Smart Investing & Trading Score: 52 | |
| Day Percent Change: -0.99% Day Change: -0.23 | |
| Week Change: -0.99% Year-to-date Change: -20.3% | |
| TITN Links: Profile News Message Board | |
| Charts:- Daily , Weekly | |
| Add TITN to Watchlist: View: Get Complete TITN Trend Analysis ➞ | |
 | EVI EVI Industries, Inc. |
| Sector: Services & Goods | |
| SubSector: Consumer Services | |
| MarketCap: 207.448 Millions | |
| Recent Price: 21.82 Smart Investing & Trading Score: 25 | |
| Day Percent Change: -0.73% Day Change: -0.16 | |
| Week Change: -0.73% Year-to-date Change: -8.1% | |
| EVI Links: Profile News Message Board | |
| Charts:- Daily , Weekly | |
| Add EVI to Watchlist: View: Get Complete EVI Trend Analysis ➞ | |
 | QUAD Quad/Graphics, Inc. |
| Sector: Services & Goods | |
| SubSector: Business Services | |
| MarketCap: 205.182 Millions | |
| Recent Price: 4.62 Smart Investing & Trading Score: 25 | |
| Day Percent Change: -0.22% Day Change: -0.01 | |
| Week Change: -0.22% Year-to-date Change: -14.8% | |
| QUAD Links: Profile News Message Board | |
| Charts:- Daily , Weekly | |
| Add QUAD to Watchlist: View: Get Complete QUAD Trend Analysis ➞ | |
 | JMIA Jumia Technologies AG |
| Sector: Services & Goods | |
| SubSector: Specialty Retail, Other | |
| MarketCap: 203.644 Millions | |
| Recent Price: 4.16 Smart Investing & Trading Score: 63 | |
| Day Percent Change: 5.58% Day Change: 0.22 | |
| Week Change: 5.58% Year-to-date Change: 17.9% | |
| JMIA Links: Profile News Message Board | |
| Charts:- Daily , Weekly | |
| Add JMIA to Watchlist: View: Get Complete JMIA Trend Analysis ➞ | |
 | RUSHB Rush Enterprises, Inc. |
| Sector: Services & Goods | |
| SubSector: Auto Dealerships | |
| MarketCap: 203.221 Millions | |
| Recent Price: 46.00 Smart Investing & Trading Score: 42 | |
| Day Percent Change: -1.12% Day Change: -0.52 | |
| Week Change: -1.12% Year-to-date Change: -13.2% | |
| RUSHB Links: Profile News Message Board | |
| Charts:- Daily , Weekly | |
| Add RUSHB to Watchlist: View: Get Complete RUSHB Trend Analysis ➞ | |
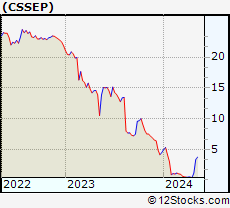 | CSSEP Chicken Soup for the Soul Entertainment, Inc. |
| Sector: Services & Goods | |
| SubSector: Broadcasting - TV | |
| MarketCap: 195.763 Millions | |
| Recent Price: 0.39 Smart Investing & Trading Score: 20 | |
| Day Percent Change: -1.85% Day Change: -0.01 | |
| Week Change: -1.85% Year-to-date Change: -91.3% | |
| CSSEP Links: Profile News Message Board | |
| Charts:- Daily , Weekly | |
| Add CSSEP to Watchlist: View: Get Complete CSSEP Trend Analysis ➞ | |
| For tabular summary view of above stock list: Summary View ➞ 0 - 25 , 25 - 50 , 50 - 75 , 75 - 100 , 100 - 125 , 125 - 150 , 150 - 175 , 175 - 200 , 200 - 225 , 225 - 250 , 250 - 275 , 275 - 300 , 300 - 325 , 325 - 350 , 350 - 375 , 375 - 400 , 400 - 425 , 425 - 450 , 450 - 475 | ||
| Click To Change The Sort Order: By Market Cap or Company Size Performance: Year-to-date, Week and Day | |
| Select Chart Type: | ||
|
Best Stocks Today 12Stocks.com |
© 2024 12Stocks.com Terms & Conditions Privacy Contact Us
All Information Provided Only For Education And Not To Be Used For Investing or Trading. See Terms & Conditions


One More Thing ... Get Best Stocks Delivered Daily!
Never Ever Miss A Move With Our Top Ten Stocks Lists
Find Best Stocks In Any Market - Bull or Bear Market
Take A Peek At Our Top Ten Stocks Lists: Daily, Weekly, Year-to-Date & Top Trends
Find Best Stocks In Any Market - Bull or Bear Market
Take A Peek At Our Top Ten Stocks Lists: Daily, Weekly, Year-to-Date & Top Trends
Consumer Services Stocks With Best Up Trends [0-bearish to 100-bullish]: MYT Netherlands[100], MOGU [100], Napco Security[100], Reservoir Media[100], Wendy s[100], WPP [100], ASGN [100], Grocery Outlet[100], Manpower [100], Genuine Parts[100], FTI Consulting[100]
Best Consumer Services Stocks Year-to-Date:
U Power[2612.05%], Vroom [1728.28%], Yatsen Holding[419.41%], Fluent [288.06%], Codere Online[134.59%], Research[96.15%], Sweetgreen [79.82%], RealReal [64.68%], Bright Scholar[61.6%], PaySign [52.86%], CRA [48.96%] Best Consumer Services Stocks This Week:
Pinduoduo [9.38%], Allbirds [9.07%], AMC Entertainment[8.23%], Noodles & [7.98%], DoubleDown Interactive[6.64%], Kohl s[6.51%], RealReal [6.43%], Qurate Retail[5.84%], Jumia Technologies[5.58%], Baozun [5.17%], Yatsen Holding[5.12%] Best Consumer Services Stocks Daily:
Pinduoduo [9.38%], Allbirds [9.07%], AMC Entertainment[8.23%], Noodles & [7.98%], DoubleDown Interactive[6.64%], Kohl s[6.51%], RealReal [6.43%], Qurate Retail[5.84%], Jumia Technologies[5.58%], Baozun [5.17%], Yatsen Holding[5.12%]