
 Login Sign Up


| |||||
 |  | ||||

| 12Stocks.com Market Intelligence |
Best SmallCap Stocks
|
| In a hurry? Small Cap Stock Lists: Performance Trends Table, Stock Charts
Sort Small Cap stocks: Daily, Weekly, Year-to-Date, Market Cap & Trends. Filter Small Cap stocks list by sector: Show all, Tech, Finance, Energy, Staples, Retail, Industrial, Materials, Utilities and HealthCare Filter Small Cap stocks list by size: All Large Medium Small and MicroCap |
| 12Stocks.com Small Cap Stocks Performances & Trends Daily | |||||||||
|
|  The overall Smart Investing & Trading Score is 23 (0-bearish to 100-bullish) which puts Small Cap index in short term bearish to neutral trend. The Smart Investing & Trading Score from previous trading session is 13 and an improvement of trend continues.
| ||||||||
Here are the Smart Investing & Trading Scores of the most requested small cap stocks at 12Stocks.com (click stock name for detailed review):
|


| 12Stocks.com: Investing in Smallcap Index with Stocks | |
|
The following table helps investors and traders sort through current performance and trends (as measured by Smart Investing & Trading Score) of various
stocks in the Smallcap Index. Quick View: Move mouse or cursor over stock symbol (ticker) to view short-term technical chart and over stock name to view long term chart. Click on  to add stock symbol to your watchlist and to add stock symbol to your watchlist and  to view watchlist. Click on any ticker or stock name for detailed market intelligence report for that stock. to view watchlist. Click on any ticker or stock name for detailed market intelligence report for that stock. |
12Stocks.com Performance of Stocks in Smallcap Index
| Ticker | Stock Name | Watchlist | Category | Recent Price | Smart Investing & Trading Score | Change % | YTD Change% |
| FTDR | frontdoor |   | Services & Goods | 30.40 | 42 | 1.30% | -13.69% |
| FCBC | First Community | | Financials | 32.32 | 42 | 1.25% | -12.88% |
| NYMT | New York | | Financials | 6.91 | 42 | 1.25% | -19.05% |
| CSV | Carriage Services | | Services & Goods | 23.84 | 42 | 1.15% | -4.68% |
| UMBF | UMB Financial | | Financials | 81.10 | 42 | 1.12% | -2.93% |
| FPI | Farmland Partners | | Financials | 10.70 | 42 | 1.09% | -14.30% |
| UE | Urban Edge | | Financials | 16.37 | 42 | 1.05% | -10.55% |
| EPC | Edgewell Personal | | Consumer Staples | 36.50 | 42 | 1.00% | -0.35% |
| CZNC | Citizens & Northern | | Financials | 17.46 | 42 | 0.98% | -22.16% |
| NTST | NetSTREIT | | Financials | 16.70 | 42 | 0.94% | -6.47% |
| DEI | Douglas Emmett | | Financials | 13.13 | 42 | 0.92% | -9.45% |
| RMAX | RE/MAX | | Financials | 7.21 | 42 | 0.91% | -45.95% |
| PKBK | Parke Bancorp | | Financials | 16.40 | 42 | 0.89% | -19.04% |
| TDS | Telephone and | | Technology | 15.28 | 42 | 0.86% | -16.73% |
| CBL | CBL & Associates Properties | | Financials | 21.52 | 42 | 0.84% | -11.88% |
| KRG | Kite Realty | | Financials | 20.72 | 42 | 0.78% | -9.36% |
| AVNS | Avanos Medical | | Health Care | 18.83 | 42 | 0.70% | -16.05% |
| GNL | Global Net | | Financials | 6.67 | 42 | 0.68% | -33.02% |
| BHR | Braemar Hotels | | Financials | 2.21 | 42 | 0.68% | -11.40% |
| BTU | Peabody Energy | | Materials | 24.25 | 42 | 0.66% | -0.29% |
| NREF | NexPoint Real | | Financials | 13.10 | 42 | 0.65% | -16.78% |
| ENR | Energizer | | Consumer Staples | 28.13 | 42 | 0.57% | -11.21% |
| ABR | Arbor Realty | | Financials | 12.55 | 42 | 0.56% | -17.33% |
| AAN | Aaron s | | Transports | 7.35 | 42 | 0.55% | -32.44% |
| SBCF | Seacoast Banking | | Financials | 22.59 | 42 | 0.53% | -20.63% |


| Too many stocks? View smallcap stocks filtered by marketcap & sector |
| Marketcap: All SmallCap Stocks (default-no microcap), Large, Mid-Range, Small |
| Smallcap Sector: Tech, Finance, Energy, Staples, Retail, Industrial, Materials, & Medical |
|
Get the most comprehensive stock market coverage daily at 12Stocks.com ➞ Best Stocks Today ➞ Best Stocks Weekly ➞ Best Stocks Year-to-Date ➞ Best Stocks Trends ➞  Best Stocks Today 12Stocks.com Best Nasdaq Stocks ➞ Best S&P 500 Stocks ➞ Best Tech Stocks ➞ Best Biotech Stocks ➞ |
| Detailed Overview of SmallCap Stocks |
| SmallCap Technical Overview, Leaders & Laggards, Top SmallCap ETF Funds & Detailed SmallCap Stocks List, Charts, Trends & More |
| Smallcap: Technical Analysis, Trends & YTD Performance | |
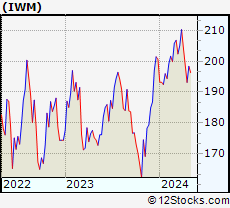
| SmallCap segment as represented by
IWM, an exchange-traded fund [ETF], holds basket of thousands of smallcap stocks from across all major sectors of the US stock market. The smallcap index (contains stocks like Riverbed & Sotheby's) is down by -4.52% and is currently underperforming the overall market by -7.67% year-to-date. Below is a quick view of technical charts and trends: | |
 IWM Weekly Chart |
|
| Long Term Trend: Not Good | |
| Medium Term Trend: Not Good | |
 IWM Daily Chart |
|
| Short Term Trend: Not Good | |
| Overall Trend Score: 23 | |
| YTD Performance: -4.52% | |
| **Trend Scores & Views Are Only For Educational Purposes And Not For Investing | |
| 12Stocks.com: Top Performing Small Cap Index Stocks | ||||||||||||||||||||||||||||||||||||||||||||||||
 The top performing Small Cap Index stocks year to date are
Now, more recently, over last week, the top performing Small Cap Index stocks on the move are


|
||||||||||||||||||||||||||||||||||||||||||||||||
| 12Stocks.com: Investing in Smallcap Index using Exchange Traded Funds | |
|
The following table shows list of key exchange traded funds (ETF) that
help investors track Smallcap index. The following list also includes leveraged ETF funds that track twice or thrice the daily returns of Smallcap indices. Short or inverse ETF funds move in the opposite direction to the index they track and are useful during market pullbacks or during bear markets. Quick View: Move mouse or cursor over ETF symbol (ticker) to view short-term technical chart and over ETF name to view long term chart. Click on ticker or stock name for detailed view. Click on to add stock symbol to your watchlist and to view watchlist. |
12Stocks.com List of ETFs that track Smallcap Index
| Ticker | ETF Name | Watchlist | Recent Price | Smart Investing & Trading Score | Change % | Week % | Year-to-date % |
| IWM | iShares Russell 2000 | | 191.63 | 23 | -0.63 | -3.55 | -4.52% |
| IWN | iShares Russell 2000 Value | | 146.63 | 10 | 0.21 | -2.49 | -5.6% |
| IJR | iShares Core S&P Small-Cap | | 102.51 | 10 | 0.16 | -1.92 | -5.31% |
| VTWO | Vanguard Russell 2000 ETF | | 77.48 | 23 | -0.60 | -3.53 | -4.46% |
| IWO | iShares Russell 2000 Growth | | 243.13 | 36 | -1.54 | -4.79 | -3.6% |
| IJS | iShares S&P Small-Cap 600 Value | | 95.00 | 17 | 0.52 | -1.22 | -7.83% |
| IJT | iShares S&P Small-Cap 600 Growth | | 122.10 | 23 | 0.44 | -2.15 | -2.43% |
| SAA | ProShares Ultra SmallCap600 | | 21.91 | 18 | 1.34 | -2.88 | -12.18% |
| XSLV | PowerShares S&P SmallCap Low Volatil ETF | | 42.07 | 17 | 1.01 | -0.05 | -4.71% |
| SMLV | SPDR SSGA US Small Cap Low Volatil ETF | | 105.89 | 32 | 1.98 | 0.84 | -5.89% |
| SDD | ProShares UltraShort SmallCap600 | | 20.32 | 76 | -1.79 | 2.47 | 10.28% |
| SBB | ProShares Short SmallCap600 | | 16.78 | 76 | -1.18 | 1.41 | 5.34% |
| 12Stocks.com: Charts, Trends, Fundamental Data and Performances of SmallCap Stocks | |
|
We now take in-depth look at all SmallCap stocks including charts, multi-period performances and overall trends (as measured by Smart Investing & Trading Score). One can sort SmallCap stocks (click link to choose) by Daily, Weekly and by Year-to-Date performances. Also, one can sort by size of the company or by market capitalization. |
| Select Your Default Chart Type: | |||||
| |||||
| Click on stock symbol or name for detailed view. Click on to add stock symbol to your watchlist and to view watchlist. Quick View: Move mouse or cursor over "Daily" to quickly view daily technical stock chart and over "Weekly" to view weekly technical stock chart. | |||||

 | FTDR frontdoor, inc. |
| Sector: Services & Goods | |
| SubSector: Business Services | |
| MarketCap: 2974.22 Millions | |
| Recent Price: 30.40 Smart Investing & Trading Score: 42 | |
| Day Percent Change: 1.30% Day Change: 0.39 | |
| Week Change: -0.13% Year-to-date Change: -13.7% | |
| FTDR Links: Profile News Message Board | |
| Charts:- Daily , Weekly | |
| Add FTDR to Watchlist: View: Get Complete FTDR Trend Analysis ➞ | |
 | FCBC First Community Bankshares, Inc. |
| Sector: Financials | |
| SubSector: Regional - Mid-Atlantic Banks | |
| MarketCap: 393.459 Millions | |
| Recent Price: 32.32 Smart Investing & Trading Score: 42 | |
| Day Percent Change: 1.25% Day Change: 0.40 | |
| Week Change: 0.59% Year-to-date Change: -12.9% | |
| FCBC Links: Profile News Message Board | |
| Charts:- Daily , Weekly | |
| Add FCBC to Watchlist: View: Get Complete FCBC Trend Analysis ➞ | |
 | NYMT New York Mortgage Trust, Inc. |
| Sector: Financials | |
| SubSector: Mortgage Investment | |
| MarketCap: 1038.39 Millions | |
| Recent Price: 6.91 Smart Investing & Trading Score: 42 | |
| Day Percent Change: 1.25% Day Change: 0.08 | |
| Week Change: -1.07% Year-to-date Change: -19.1% | |
| NYMT Links: Profile News Message Board | |
| Charts:- Daily , Weekly | |
| Add NYMT to Watchlist: View: Get Complete NYMT Trend Analysis ➞ | |
 | CSV Carriage Services, Inc. |
| Sector: Services & Goods | |
| SubSector: Personal Services | |
| MarketCap: 304.725 Millions | |
| Recent Price: 23.84 Smart Investing & Trading Score: 42 | |
| Day Percent Change: 1.15% Day Change: 0.27 | |
| Week Change: -1.65% Year-to-date Change: -4.7% | |
| CSV Links: Profile News Message Board | |
| Charts:- Daily , Weekly | |
| Add CSV to Watchlist: View: Get Complete CSV Trend Analysis ➞ | |
 | UMBF UMB Financial Corporation |
| Sector: Financials | |
| SubSector: Regional - Southwest Banks | |
| MarketCap: 2207.35 Millions | |
| Recent Price: 81.10 Smart Investing & Trading Score: 42 | |
| Day Percent Change: 1.12% Day Change: 0.90 | |
| Week Change: 1.29% Year-to-date Change: -2.9% | |
| UMBF Links: Profile News Message Board | |
| Charts:- Daily , Weekly | |
| Add UMBF to Watchlist: View: Get Complete UMBF Trend Analysis ➞ | |
 | FPI Farmland Partners Inc. |
| Sector: Financials | |
| SubSector: REIT - Diversified | |
| MarketCap: 182.653 Millions | |
| Recent Price: 10.70 Smart Investing & Trading Score: 42 | |
| Day Percent Change: 1.09% Day Change: 0.12 | |
| Week Change: 1.86% Year-to-date Change: -14.3% | |
| FPI Links: Profile News Message Board | |
| Charts:- Daily , Weekly | |
| Add FPI to Watchlist: View: Get Complete FPI Trend Analysis ➞ | |
 | UE Urban Edge Properties |
| Sector: Financials | |
| SubSector: REIT - Diversified | |
| MarketCap: 1112.33 Millions | |
| Recent Price: 16.37 Smart Investing & Trading Score: 42 | |
| Day Percent Change: 1.05% Day Change: 0.17 | |
| Week Change: 0.55% Year-to-date Change: -10.6% | |
| UE Links: Profile News Message Board | |
| Charts:- Daily , Weekly | |
| Add UE to Watchlist: View: Get Complete UE Trend Analysis ➞ | |
 | EPC Edgewell Personal Care Company |
| Sector: Consumer Staples | |
| SubSector: Personal Products | |
| MarketCap: 1605.95 Millions | |
| Recent Price: 36.50 Smart Investing & Trading Score: 42 | |
| Day Percent Change: 1.00% Day Change: 0.36 | |
| Week Change: 1.98% Year-to-date Change: -0.4% | |
| EPC Links: Profile News Message Board | |
| Charts:- Daily , Weekly | |
| Add EPC to Watchlist: View: Get Complete EPC Trend Analysis ➞ | |
 | CZNC Citizens & Northern Corporation |
| Sector: Financials | |
| SubSector: Regional - Mid-Atlantic Banks | |
| MarketCap: 274.459 Millions | |
| Recent Price: 17.46 Smart Investing & Trading Score: 42 | |
| Day Percent Change: 0.98% Day Change: 0.17 | |
| Week Change: 2.46% Year-to-date Change: -22.2% | |
| CZNC Links: Profile News Message Board | |
| Charts:- Daily , Weekly | |
| Add CZNC to Watchlist: View: Get Complete CZNC Trend Analysis ➞ | |
 | NTST NetSTREIT Corp. |
| Sector: Financials | |
| SubSector: REIT Retail | |
| MarketCap: 51267 Millions | |
| Recent Price: 16.70 Smart Investing & Trading Score: 42 | |
| Day Percent Change: 0.94% Day Change: 0.15 | |
| Week Change: -1.97% Year-to-date Change: -6.5% | |
| NTST Links: Profile News Message Board | |
| Charts:- Daily , Weekly | |
| Add NTST to Watchlist: View: Get Complete NTST Trend Analysis ➞ | |
 | DEI Douglas Emmett, Inc. |
| Sector: Financials | |
| SubSector: REIT - Diversified | |
| MarketCap: 4917.83 Millions | |
| Recent Price: 13.13 Smart Investing & Trading Score: 42 | |
| Day Percent Change: 0.92% Day Change: 0.12 | |
| Week Change: -0.98% Year-to-date Change: -9.5% | |
| DEI Links: Profile News Message Board | |
| Charts:- Daily , Weekly | |
| Add DEI to Watchlist: View: Get Complete DEI Trend Analysis ➞ | |
 | RMAX RE/MAX Holdings, Inc. |
| Sector: Financials | |
| SubSector: Property Management | |
| MarketCap: 334.742 Millions | |
| Recent Price: 7.21 Smart Investing & Trading Score: 42 | |
| Day Percent Change: 0.91% Day Change: 0.07 | |
| Week Change: -4.32% Year-to-date Change: -46.0% | |
| RMAX Links: Profile News Message Board | |
| Charts:- Daily , Weekly | |
| Add RMAX to Watchlist: View: Get Complete RMAX Trend Analysis ➞ | |
 | PKBK Parke Bancorp, Inc. |
| Sector: Financials | |
| SubSector: Regional - Northeast Banks | |
| MarketCap: 165.799 Millions | |
| Recent Price: 16.40 Smart Investing & Trading Score: 42 | |
| Day Percent Change: 0.89% Day Change: 0.14 | |
| Week Change: 1.14% Year-to-date Change: -19.0% | |
| PKBK Links: Profile News Message Board | |
| Charts:- Daily , Weekly | |
| Add PKBK to Watchlist: View: Get Complete PKBK Trend Analysis ➞ | |
 | TDS Telephone and Data Systems, Inc. |
| Sector: Technology | |
| SubSector: Wireless Communications | |
| MarketCap: 1851.87 Millions | |
| Recent Price: 15.28 Smart Investing & Trading Score: 42 | |
| Day Percent Change: 0.86% Day Change: 0.13 | |
| Week Change: -2.36% Year-to-date Change: -16.7% | |
| TDS Links: Profile News Message Board | |
| Charts:- Daily , Weekly | |
| Add TDS to Watchlist: View: Get Complete TDS Trend Analysis ➞ | |
 | CBL CBL & Associates Properties, Inc. |
| Sector: Financials | |
| SubSector: REIT - Retail | |
| MarketCap: 690 Millions | |
| Recent Price: 21.52 Smart Investing & Trading Score: 42 | |
| Day Percent Change: 0.84% Day Change: 0.18 | |
| Week Change: -1.74% Year-to-date Change: -11.9% | |
| CBL Links: Profile News Message Board | |
| Charts:- Daily , Weekly | |
| Add CBL to Watchlist: View: Get Complete CBL Trend Analysis ➞ | |
 | KRG Kite Realty Group Trust |
| Sector: Financials | |
| SubSector: REIT - Retail | |
| MarketCap: 1030.14 Millions | |
| Recent Price: 20.72 Smart Investing & Trading Score: 42 | |
| Day Percent Change: 0.78% Day Change: 0.16 | |
| Week Change: 2.57% Year-to-date Change: -9.4% | |
| KRG Links: Profile News Message Board | |
| Charts:- Daily , Weekly | |
| Add KRG to Watchlist: View: Get Complete KRG Trend Analysis ➞ | |
 | AVNS Avanos Medical, Inc. |
| Sector: Health Care | |
| SubSector: Medical Instruments & Supplies | |
| MarketCap: 1229.6 Millions | |
| Recent Price: 18.83 Smart Investing & Trading Score: 42 | |
| Day Percent Change: 0.70% Day Change: 0.13 | |
| Week Change: 1.73% Year-to-date Change: -16.1% | |
| AVNS Links: Profile News Message Board | |
| Charts:- Daily , Weekly | |
| Add AVNS to Watchlist: View: Get Complete AVNS Trend Analysis ➞ | |
 | GNL Global Net Lease, Inc. |
| Sector: Financials | |
| SubSector: REIT - Diversified | |
| MarketCap: 1362.73 Millions | |
| Recent Price: 6.67 Smart Investing & Trading Score: 42 | |
| Day Percent Change: 0.68% Day Change: 0.04 | |
| Week Change: -1.7% Year-to-date Change: -33.0% | |
| GNL Links: Profile News Message Board | |
| Charts:- Daily , Weekly | |
| Add GNL to Watchlist: View: Get Complete GNL Trend Analysis ➞ | |
 | BHR Braemar Hotels & Resorts, Inc. |
| Sector: Financials | |
| SubSector: REIT - Hotel/Motel | |
| MarketCap: 88.9434 Millions | |
| Recent Price: 2.21 Smart Investing & Trading Score: 42 | |
| Day Percent Change: 0.68% Day Change: 0.01 | |
| Week Change: -9.59% Year-to-date Change: -11.4% | |
| BHR Links: Profile News Message Board | |
| Charts:- Daily , Weekly | |
| Add BHR to Watchlist: View: Get Complete BHR Trend Analysis ➞ | |
 | BTU Peabody Energy Corporation |
| Sector: Materials | |
| SubSector: Industrial Metals & Minerals | |
| MarketCap: 355.11 Millions | |
| Recent Price: 24.25 Smart Investing & Trading Score: 42 | |
| Day Percent Change: 0.66% Day Change: 0.16 | |
| Week Change: 5.02% Year-to-date Change: -0.3% | |
| BTU Links: Profile News Message Board | |
| Charts:- Daily , Weekly | |
| Add BTU to Watchlist: View: Get Complete BTU Trend Analysis ➞ | |
 | NREF NexPoint Real Estate Finance, Inc. |
| Sector: Financials | |
| SubSector: REIT Diversified | |
| MarketCap: 97267 Millions | |
| Recent Price: 13.10 Smart Investing & Trading Score: 42 | |
| Day Percent Change: 0.65% Day Change: 0.09 | |
| Week Change: 0.19% Year-to-date Change: -16.8% | |
| NREF Links: Profile News Message Board | |
| Charts:- Daily , Weekly | |
| Add NREF to Watchlist: View: Get Complete NREF Trend Analysis ➞ | |
 | ENR Energizer Holdings, Inc. |
| Sector: Consumer Staples | |
| SubSector: Personal Products | |
| MarketCap: 2469.55 Millions | |
| Recent Price: 28.13 Smart Investing & Trading Score: 42 | |
| Day Percent Change: 0.57% Day Change: 0.16 | |
| Week Change: 2.51% Year-to-date Change: -11.2% | |
| ENR Links: Profile News Message Board | |
| Charts:- Daily , Weekly | |
| Add ENR to Watchlist: View: Get Complete ENR Trend Analysis ➞ | |
 | ABR Arbor Realty Trust, Inc. |
| Sector: Financials | |
| SubSector: Mortgage Investment | |
| MarketCap: 648.939 Millions | |
| Recent Price: 12.55 Smart Investing & Trading Score: 42 | |
| Day Percent Change: 0.56% Day Change: 0.07 | |
| Week Change: 2.87% Year-to-date Change: -17.3% | |
| ABR Links: Profile News Message Board | |
| Charts:- Daily , Weekly | |
| Add ABR to Watchlist: View: Get Complete ABR Trend Analysis ➞ | |
 | AAN Aaron s, Inc. |
| Sector: Transports | |
| SubSector: Rental & Leasing Services | |
| MarketCap: 1087.04 Millions | |
| Recent Price: 7.35 Smart Investing & Trading Score: 42 | |
| Day Percent Change: 0.55% Day Change: 0.04 | |
| Week Change: 2.65% Year-to-date Change: -32.4% | |
| AAN Links: Profile News Message Board | |
| Charts:- Daily , Weekly | |
| Add AAN to Watchlist: View: Get Complete AAN Trend Analysis ➞ | |
 | SBCF Seacoast Banking Corporation of Florida |
| Sector: Financials | |
| SubSector: Regional - Mid-Atlantic Banks | |
| MarketCap: 881.559 Millions | |
| Recent Price: 22.59 Smart Investing & Trading Score: 42 | |
| Day Percent Change: 0.53% Day Change: 0.12 | |
| Week Change: 0.36% Year-to-date Change: -20.6% | |
| SBCF Links: Profile News Message Board | |
| Charts:- Daily , Weekly | |
| Add SBCF to Watchlist: View: Get Complete SBCF Trend Analysis ➞ | |
| Too many stocks? View smallcap stocks filtered by marketcap & sector |
| Marketcap: All SmallCap Stocks (default-no microcap), Large, Mid-Range, Small & MicroCap |
| Sector: Tech, Finance, Energy, Staples, Retail, Industrial, Materials, Utilities & Medical |
|
Best Stocks Today 12Stocks.com |
© 2024 12Stocks.com Terms & Conditions Privacy Contact Us
All Information Provided Only For Education And Not To Be Used For Investing or Trading. See Terms & Conditions


One More Thing ... Get Best Stocks Delivered Daily!
Never Ever Miss A Move With Our Top Ten Stocks Lists
Find Best Stocks In Any Market - Bull or Bear Market
Take A Peek At Our Top Ten Stocks Lists: Daily, Weekly, Year-to-Date & Top Trends
Find Best Stocks In Any Market - Bull or Bear Market
Take A Peek At Our Top Ten Stocks Lists: Daily, Weekly, Year-to-Date & Top Trends
Smallcap Stocks With Best Up Trends [0-bearish to 100-bullish]: Humacyte [100], Victory Capital[100], Cricut [100], Old Second[100], United Fire[100], Century Aluminum[100], Portland General[100], Tejon Ranch[100], Gannett Co[100], Lantheus [100], Target Hospitality[100]
Best Smallcap Stocks Year-to-Date:
Agenus [519.64%], CareMax [423.71%], Janux [336.95%], Alpine Immune[238.42%], Viking [231.81%], Longboard [194.11%], Arcutis Bio[184.06%], Super Micro[155.54%], Avidity Biosciences[153.65%], Vera [138.18%], Stoke [121.48%] Best Smallcap Stocks This Week:
Macatawa Bank[45.99%], Vertex Energy[43.75%], Snap One[29.61%], Vanda [24.76%], Humacyte [23.78%], ALX Oncology[22.49%], ContextLogic [20%], ProKidney [16.57%], Badger Meter[15.82%], Calavo Growers[14.44%], Accolade [13.45%] Best Smallcap Stocks Daily:
Origin Materials[20.44%], Metropolitan Bank[17.73%], Tellurian [17.66%], Vertex Energy[14.12%], Fossil Group[10.55%], Genelux [10.37%], Humacyte [9.86%], Riot Blockchain[9.11%], Cohen & Steers[8.81%], Chemung Financial[8.68%], Urban One[8.21%]