
 Login Sign Up


| |||||
 |  | ||||

| 12Stocks.com Market Intelligence |
Best SmallCap Stocks
|
| In a hurry? Small Cap Stock Lists: Performance Trends Table, Stock Charts
Sort Small Cap stocks: Daily, Weekly, Year-to-Date, Market Cap & Trends. Filter Small Cap stocks list by sector: Show all, Tech, Finance, Energy, Staples, Retail, Industrial, Materials, Utilities and HealthCare Filter Small Cap stocks list by size: All Large Medium Small and MicroCap |
| 12Stocks.com Small Cap Stocks Performances & Trends Daily | |||||||||
|
|  The overall Smart Investing & Trading Score is 43 (0-bearish to 100-bullish) which puts Small Cap index in short term neutral trend. The Smart Investing & Trading Score from previous trading session is 26 and hence an improvement of trend.
| ||||||||
Here are the Smart Investing & Trading Scores of the most requested small cap stocks at 12Stocks.com (click stock name for detailed review):
|


| 12Stocks.com: Investing in Smallcap Index with Stocks | |
|
The following table helps investors and traders sort through current performance and trends (as measured by Smart Investing & Trading Score) of various
stocks in the Smallcap Index. Quick View: Move mouse or cursor over stock symbol (ticker) to view short-term technical chart and over stock name to view long term chart. Click on  to add stock symbol to your watchlist and to add stock symbol to your watchlist and  to view watchlist. Click on any ticker or stock name for detailed market intelligence report for that stock. to view watchlist. Click on any ticker or stock name for detailed market intelligence report for that stock. |
12Stocks.com Performance of Stocks in Smallcap Index
| Ticker | Stock Name | Watchlist | Category | Recent Price | Smart Investing & Trading Score | Change % | YTD Change% |
| BARK | BARK |   | Services & Goods | 1.08 | 36 | 2.86% | 34.97% |
| ZNTL | Zentalis | | Health Care | 13.10 | 36 | 1.71% | -13.59% |
| MTRN | Materion | | Materials | 123.45 | 36 | 1.21% | -5.13% |
| MNKD | MannKind | | Health Care | 4.09 | 36 | 1.11% | 12.50% |
| LQDA | Liquidia | | Health Care | 13.73 | 36 | 1.10% | 14.13% |
| AMRX | Amneal | | Health Care | 5.50 | 36 | 0.92% | -9.39% |
| AIV | Apartment | | Financials | 7.88 | 36 | 0.90% | 0.64% |
| CIFR | Cipher Mining | | Financials | 3.39 | 36 | 0.89% | -17.52% |
| MLYS | Mineralys | | Health Care | 12.17 | 36 | 0.83% | 39.56% |
| TG | Tredegar | | Materials | 6.35 | 36 | 0.79% | 17.38% |
| COLL | Collegium Pharmaceutical | | Health Care | 35.67 | 36 | 0.76% | 15.89% |
| ATEX | Anterix | | Technology | 32.28 | 36 | 0.65% | -3.12% |
| ANIP | ANI | | Health Care | 65.94 | 36 | 0.58% | 19.59% |
| MPX | Marine Products | | Consumer Staples | 10.91 | 36 | 0.55% | -4.30% |
| PCT | PureCycle | | Industrials | 5.23 | 36 | 0.38% | 28.98% |
| TTMI | TTM | | Technology | 14.21 | 36 | 0.32% | -10.15% |
| IRT | Independence Realty | | Financials | 15.72 | 36 | 0.32% | 2.75% |
| AESI | Atlas Energy | | Energy | 22.24 | 36 | 0.32% | 29.91% |
| ALRM | Alarm.com | | Technology | 64.88 | 36 | 0.30% | 0.39% |
| CTS | CTS | | Technology | 44.48 | 36 | 0.24% | 1.68% |
| SXI | Standex | | Industrials | 169.30 | 36 | 0.13% | 6.89% |
| TRN | Trinity Industries | | Transports | 26.15 | 36 | 0.08% | -1.65% |
| ASIX | AdvanSix | | Materials | 26.98 | 36 | 0.02% | -9.96% |
| PRM | Perimeter Solutions | | Materials | 7.06 | 36 | 0.00% | 53.65% |
| ENTA | Enanta | | Health Care | 14.22 | 36 | -7.45% | 51.06% |


| Too many stocks? View smallcap stocks filtered by marketcap & sector |
| Marketcap: All SmallCap Stocks (default-no microcap), Large, Mid-Range, Small |
| Smallcap Sector: Tech, Finance, Energy, Staples, Retail, Industrial, Materials, & Medical |
|
Get the most comprehensive stock market coverage daily at 12Stocks.com ➞ Best Stocks Today ➞ Best Stocks Weekly ➞ Best Stocks Year-to-Date ➞ Best Stocks Trends ➞  Best Stocks Today 12Stocks.com Best Nasdaq Stocks ➞ Best S&P 500 Stocks ➞ Best Tech Stocks ➞ Best Biotech Stocks ➞ |
| Detailed Overview of SmallCap Stocks |
| SmallCap Technical Overview, Leaders & Laggards, Top SmallCap ETF Funds & Detailed SmallCap Stocks List, Charts, Trends & More |
| Smallcap: Technical Analysis, Trends & YTD Performance | |
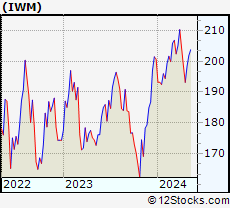
| SmallCap segment as represented by
IWM, an exchange-traded fund [ETF], holds basket of thousands of smallcap stocks from across all major sectors of the US stock market. The smallcap index (contains stocks like Riverbed & Sotheby's) is down by -2.93% and is currently underperforming the overall market by -7.9% year-to-date. Below is a quick view of technical charts and trends: | |
 IWM Weekly Chart |
|
| Long Term Trend: Good | |
| Medium Term Trend: Not Good | |
 IWM Daily Chart |
|
| Short Term Trend: Not Good | |
| Overall Trend Score: 43 | |
| YTD Performance: -2.93% | |
| **Trend Scores & Views Are Only For Educational Purposes And Not For Investing | |
| 12Stocks.com: Top Performing Small Cap Index Stocks | ||||||||||||||||||||||||||||||||||||||||||||||||
 The top performing Small Cap Index stocks year to date are
Now, more recently, over last week, the top performing Small Cap Index stocks on the move are


|
||||||||||||||||||||||||||||||||||||||||||||||||
| 12Stocks.com: Investing in Smallcap Index using Exchange Traded Funds | |
|
The following table shows list of key exchange traded funds (ETF) that
help investors track Smallcap index. The following list also includes leveraged ETF funds that track twice or thrice the daily returns of Smallcap indices. Short or inverse ETF funds move in the opposite direction to the index they track and are useful during market pullbacks or during bear markets. Quick View: Move mouse or cursor over ETF symbol (ticker) to view short-term technical chart and over ETF name to view long term chart. Click on ticker or stock name for detailed view. Click on to add stock symbol to your watchlist and to view watchlist. |
12Stocks.com List of ETFs that track Smallcap Index
| Ticker | ETF Name | Watchlist | Recent Price | Smart Investing & Trading Score | Change % | Week % | Year-to-date % |
| IWM | iShares Russell 2000 | | 194.83 | 43 | -0.12 | -1.94 | -2.93% |
| VTWO | Vanguard Russell 2000 ETF | | 78.77 | 36 | -0.13 | -1.93 | -2.87% |
| IJR | iShares Core S&P Small-Cap | | 102.94 | 17 | 0.21 | -1.5 | -4.91% |
| IWN | iShares Russell 2000 Value | | 147.37 | 30 | 0.14 | -2 | -5.12% |
| IWO | iShares Russell 2000 Growth | | 250.93 | 43 | 0.27 | -1.73 | -0.51% |
| IJS | iShares S&P Small-Cap 600 Value | | 94.92 | 17 | 0.27 | -1.3 | -7.91% |
| IJT | iShares S&P Small-Cap 600 Growth | | 122.69 | 41 | -0.33 | -1.67 | -1.96% |
| XSLV | PowerShares S&P SmallCap Low Volatil ETF | | 41.58 | 17 | 0.00 | -1.21 | -5.82% |
| SMLV | SPDR SSGA US Small Cap Low Volatil ETF | | 103.94 | 25 | 0.09 | -1.03 | -7.63% |
| SAA | ProShares Ultra SmallCap600 | | 21.83 | 17 | -0.41 | -3.24 | -12.51% |
| SBB | ProShares Short SmallCap600 | | 16.85 | 73 | 0.42 | 1.83 | 5.78% |
| SDD | ProShares UltraShort SmallCap600 | | 20.49 | 73 | 0.69 | 3.33 | 11.2% |
| 12Stocks.com: Charts, Trends, Fundamental Data and Performances of SmallCap Stocks | |
|
We now take in-depth look at all SmallCap stocks including charts, multi-period performances and overall trends (as measured by Smart Investing & Trading Score). One can sort SmallCap stocks (click link to choose) by Daily, Weekly and by Year-to-Date performances. Also, one can sort by size of the company or by market capitalization. |
| Select Your Default Chart Type: | |||||
| |||||
| Click on stock symbol or name for detailed view. Click on to add stock symbol to your watchlist and to view watchlist. Quick View: Move mouse or cursor over "Daily" to quickly view daily technical stock chart and over "Weekly" to view weekly technical stock chart. | |||||

 | BARK BARK, Inc. |
| Sector: Services & Goods | |
| SubSector: Specialty Retail | |
| MarketCap: 234 Millions | |
| Recent Price: 1.08 Smart Investing & Trading Score: 36 | |
| Day Percent Change: 2.86% Day Change: 0.03 | |
| Week Change: -1.82% Year-to-date Change: 35.0% | |
| BARK Links: Profile News Message Board | |
| Charts:- Daily , Weekly | |
| Add BARK to Watchlist: View: Get Complete BARK Trend Analysis ➞ | |
 | ZNTL Zentalis Pharmaceuticals, Inc. |
| Sector: Health Care | |
| SubSector: Biotechnology | |
| MarketCap: 22187 Millions | |
| Recent Price: 13.10 Smart Investing & Trading Score: 36 | |
| Day Percent Change: 1.71% Day Change: 0.22 | |
| Week Change: -2.31% Year-to-date Change: -13.6% | |
| ZNTL Links: Profile News Message Board | |
| Charts:- Daily , Weekly | |
| Add ZNTL to Watchlist: View: Get Complete ZNTL Trend Analysis ➞ | |
 | MTRN Materion Corporation |
| Sector: Materials | |
| SubSector: Industrial Metals & Minerals | |
| MarketCap: 703.71 Millions | |
| Recent Price: 123.45 Smart Investing & Trading Score: 36 | |
| Day Percent Change: 1.21% Day Change: 1.48 | |
| Week Change: -1.59% Year-to-date Change: -5.1% | |
| MTRN Links: Profile News Message Board | |
| Charts:- Daily , Weekly | |
| Add MTRN to Watchlist: View: Get Complete MTRN Trend Analysis ➞ | |
 | MNKD MannKind Corporation |
| Sector: Health Care | |
| SubSector: Biotechnology | |
| MarketCap: 250.885 Millions | |
| Recent Price: 4.09 Smart Investing & Trading Score: 36 | |
| Day Percent Change: 1.11% Day Change: 0.04 | |
| Week Change: -1.33% Year-to-date Change: 12.5% | |
| MNKD Links: Profile News Message Board | |
| Charts:- Daily , Weekly | |
| Add MNKD to Watchlist: View: Get Complete MNKD Trend Analysis ➞ | |
 | LQDA Liquidia Technologies, Inc. |
| Sector: Health Care | |
| SubSector: Biotechnology | |
| MarketCap: 80.4785 Millions | |
| Recent Price: 13.73 Smart Investing & Trading Score: 36 | |
| Day Percent Change: 1.10% Day Change: 0.15 | |
| Week Change: -1.58% Year-to-date Change: 14.1% | |
| LQDA Links: Profile News Message Board | |
| Charts:- Daily , Weekly | |
| Add LQDA to Watchlist: View: Get Complete LQDA Trend Analysis ➞ | |
 | AMRX Amneal Pharmaceuticals, Inc. |
| Sector: Health Care | |
| SubSector: Drug Related Products | |
| MarketCap: 1218.13 Millions | |
| Recent Price: 5.50 Smart Investing & Trading Score: 36 | |
| Day Percent Change: 0.92% Day Change: 0.05 | |
| Week Change: -0.36% Year-to-date Change: -9.4% | |
| AMRX Links: Profile News Message Board | |
| Charts:- Daily , Weekly | |
| Add AMRX to Watchlist: View: Get Complete AMRX Trend Analysis ➞ | |
 | AIV Apartment Investment and Management Company |
| Sector: Financials | |
| SubSector: REIT - Residential | |
| MarketCap: 4485.11 Millions | |
| Recent Price: 7.88 Smart Investing & Trading Score: 36 | |
| Day Percent Change: 0.90% Day Change: 0.07 | |
| Week Change: -2.84% Year-to-date Change: 0.6% | |
| AIV Links: Profile News Message Board | |
| Charts:- Daily , Weekly | |
| Add AIV to Watchlist: View: Get Complete AIV Trend Analysis ➞ | |
 | CIFR Cipher Mining Inc. |
| Sector: Financials | |
| SubSector: Capital Markets | |
| MarketCap: 712 Millions | |
| Recent Price: 3.39 Smart Investing & Trading Score: 36 | |
| Day Percent Change: 0.89% Day Change: 0.03 | |
| Week Change: -11.37% Year-to-date Change: -17.5% | |
| CIFR Links: Profile News Message Board | |
| Charts:- Daily , Weekly | |
| Add CIFR to Watchlist: View: Get Complete CIFR Trend Analysis ➞ | |
 | MLYS Mineralys Therapeutics, Inc. |
| Sector: Health Care | |
| SubSector: Biotechnology | |
| MarketCap: 719 Millions | |
| Recent Price: 12.17 Smart Investing & Trading Score: 36 | |
| Day Percent Change: 0.83% Day Change: 0.10 | |
| Week Change: -6.46% Year-to-date Change: 39.6% | |
| MLYS Links: Profile News Message Board | |
| Charts:- Daily , Weekly | |
| Add MLYS to Watchlist: View: Get Complete MLYS Trend Analysis ➞ | |
 | TG Tredegar Corporation |
| Sector: Materials | |
| SubSector: Specialty Chemicals | |
| MarketCap: 545.057 Millions | |
| Recent Price: 6.35 Smart Investing & Trading Score: 36 | |
| Day Percent Change: 0.79% Day Change: 0.05 | |
| Week Change: -1.55% Year-to-date Change: 17.4% | |
| TG Links: Profile News Message Board | |
| Charts:- Daily , Weekly | |
| Add TG to Watchlist: View: Get Complete TG Trend Analysis ➞ | |
 | COLL Collegium Pharmaceutical, Inc. |
| Sector: Health Care | |
| SubSector: Drugs - Generic | |
| MarketCap: 569.185 Millions | |
| Recent Price: 35.67 Smart Investing & Trading Score: 36 | |
| Day Percent Change: 0.76% Day Change: 0.27 | |
| Week Change: -0.11% Year-to-date Change: 15.9% | |
| COLL Links: Profile News Message Board | |
| Charts:- Daily , Weekly | |
| Add COLL to Watchlist: View: Get Complete COLL Trend Analysis ➞ | |
 | ATEX Anterix Inc. |
| Sector: Technology | |
| SubSector: Telecom Services - Domestic | |
| MarketCap: 694.077 Millions | |
| Recent Price: 32.28 Smart Investing & Trading Score: 36 | |
| Day Percent Change: 0.65% Day Change: 0.21 | |
| Week Change: 0.47% Year-to-date Change: -3.1% | |
| ATEX Links: Profile News Message Board | |
| Charts:- Daily , Weekly | |
| Add ATEX to Watchlist: View: Get Complete ATEX Trend Analysis ➞ | |
 | ANIP ANI Pharmaceuticals, Inc. |
| Sector: Health Care | |
| SubSector: Biotechnology | |
| MarketCap: 489.285 Millions | |
| Recent Price: 65.94 Smart Investing & Trading Score: 36 | |
| Day Percent Change: 0.58% Day Change: 0.38 | |
| Week Change: -1.41% Year-to-date Change: 19.6% | |
| ANIP Links: Profile News Message Board | |
| Charts:- Daily , Weekly | |
| Add ANIP to Watchlist: View: Get Complete ANIP Trend Analysis ➞ | |
 | MPX Marine Products Corporation |
| Sector: Consumer Staples | |
| SubSector: Recreational Vehicles | |
| MarketCap: 316.059 Millions | |
| Recent Price: 10.91 Smart Investing & Trading Score: 36 | |
| Day Percent Change: 0.55% Day Change: 0.06 | |
| Week Change: -1.45% Year-to-date Change: -4.3% | |
| MPX Links: Profile News Message Board | |
| Charts:- Daily , Weekly | |
| Add MPX to Watchlist: View: Get Complete MPX Trend Analysis ➞ | |
 | PCT PureCycle Technologies, Inc. |
| Sector: Industrials | |
| SubSector: Pollution & Treatment Controls | |
| MarketCap: 1610 Millions | |
| Recent Price: 5.23 Smart Investing & Trading Score: 36 | |
| Day Percent Change: 0.38% Day Change: 0.02 | |
| Week Change: -7.76% Year-to-date Change: 29.0% | |
| PCT Links: Profile News Message Board | |
| Charts:- Daily , Weekly | |
| Add PCT to Watchlist: View: Get Complete PCT Trend Analysis ➞ | |
 | TTMI TTM Technologies, Inc. |
| Sector: Technology | |
| SubSector: Printed Circuit Boards | |
| MarketCap: 1028.35 Millions | |
| Recent Price: 14.21 Smart Investing & Trading Score: 36 | |
| Day Percent Change: 0.32% Day Change: 0.04 | |
| Week Change: -0.94% Year-to-date Change: -10.2% | |
| TTMI Links: Profile News Message Board | |
| Charts:- Daily , Weekly | |
| Add TTMI to Watchlist: View: Get Complete TTMI Trend Analysis ➞ | |
 | IRT Independence Realty Trust, Inc. |
| Sector: Financials | |
| SubSector: REIT - Residential | |
| MarketCap: 980.161 Millions | |
| Recent Price: 15.72 Smart Investing & Trading Score: 36 | |
| Day Percent Change: 0.32% Day Change: 0.05 | |
| Week Change: -1.75% Year-to-date Change: 2.8% | |
| IRT Links: Profile News Message Board | |
| Charts:- Daily , Weekly | |
| Add IRT to Watchlist: View: Get Complete IRT Trend Analysis ➞ | |
 | AESI Atlas Energy Solutions Inc. |
| Sector: Energy | |
| SubSector: Oil & Gas Equipment & Services | |
| MarketCap: 947 Millions | |
| Recent Price: 22.24 Smart Investing & Trading Score: 36 | |
| Day Percent Change: 0.32% Day Change: 0.07 | |
| Week Change: -5.12% Year-to-date Change: 29.9% | |
| AESI Links: Profile News Message Board | |
| Charts:- Daily , Weekly | |
| Add AESI to Watchlist: View: Get Complete AESI Trend Analysis ➞ | |
 | ALRM Alarm.com Holdings, Inc. |
| Sector: Technology | |
| SubSector: Application Software | |
| MarketCap: 2035.62 Millions | |
| Recent Price: 64.88 Smart Investing & Trading Score: 36 | |
| Day Percent Change: 0.30% Day Change: 0.19 | |
| Week Change: -4.34% Year-to-date Change: 0.4% | |
| ALRM Links: Profile News Message Board | |
| Charts:- Daily , Weekly | |
| Add ALRM to Watchlist: View: Get Complete ALRM Trend Analysis ➞ | |
 | CTS CTS Corporation |
| Sector: Technology | |
| SubSector: Diversified Electronics | |
| MarketCap: 645.896 Millions | |
| Recent Price: 44.48 Smart Investing & Trading Score: 36 | |
| Day Percent Change: 0.24% Day Change: 0.11 | |
| Week Change: -3.25% Year-to-date Change: 1.7% | |
| CTS Links: Profile News Message Board | |
| Charts:- Daily , Weekly | |
| Add CTS to Watchlist: View: Get Complete CTS Trend Analysis ➞ | |
 | SXI Standex International Corporation |
| Sector: Industrials | |
| SubSector: Industrial Equipment & Components | |
| MarketCap: 644.109 Millions | |
| Recent Price: 169.30 Smart Investing & Trading Score: 36 | |
| Day Percent Change: 0.13% Day Change: 0.22 | |
| Week Change: -1.25% Year-to-date Change: 6.9% | |
| SXI Links: Profile News Message Board | |
| Charts:- Daily , Weekly | |
| Add SXI to Watchlist: View: Get Complete SXI Trend Analysis ➞ | |
 | TRN Trinity Industries, Inc. |
| Sector: Transports | |
| SubSector: Railroads | |
| MarketCap: 2058.22 Millions | |
| Recent Price: 26.15 Smart Investing & Trading Score: 36 | |
| Day Percent Change: 0.08% Day Change: 0.02 | |
| Week Change: -2.64% Year-to-date Change: -1.7% | |
| TRN Links: Profile News Message Board | |
| Charts:- Daily , Weekly | |
| Add TRN to Watchlist: View: Get Complete TRN Trend Analysis ➞ | |
 | ASIX AdvanSix Inc. |
| Sector: Materials | |
| SubSector: Chemicals - Major Diversified | |
| MarketCap: 394.136 Millions | |
| Recent Price: 26.98 Smart Investing & Trading Score: 36 | |
| Day Percent Change: 0.02% Day Change: 0.01 | |
| Week Change: -1.77% Year-to-date Change: -10.0% | |
| ASIX Links: Profile News Message Board | |
| Charts:- Daily , Weekly | |
| Add ASIX to Watchlist: View: Get Complete ASIX Trend Analysis ➞ | |
 | PRM Perimeter Solutions, SA |
| Sector: Materials | |
| SubSector: Specialty Chemicals | |
| MarketCap: 930 Millions | |
| Recent Price: 7.06 Smart Investing & Trading Score: 36 | |
| Day Percent Change: 0.00% Day Change: 0.00 | |
| Week Change: -2.62% Year-to-date Change: 53.7% | |
| PRM Links: Profile News Message Board | |
| Charts:- Daily , Weekly | |
| Add PRM to Watchlist: View: Get Complete PRM Trend Analysis ➞ | |
 | ENTA Enanta Pharmaceuticals, Inc. |
| Sector: Health Care | |
| SubSector: Biotechnology | |
| MarketCap: 998.385 Millions | |
| Recent Price: 14.22 Smart Investing & Trading Score: 36 | |
| Day Percent Change: -7.45% Day Change: -1.14 | |
| Week Change: -13.59% Year-to-date Change: 51.1% | |
| ENTA Links: Profile News Message Board | |
| Charts:- Daily , Weekly | |
| Add ENTA to Watchlist: View: Get Complete ENTA Trend Analysis ➞ | |
| Too many stocks? View smallcap stocks filtered by marketcap & sector |
| Marketcap: All SmallCap Stocks (default-no microcap), Large, Mid-Range, Small & MicroCap |
| Sector: Tech, Finance, Energy, Staples, Retail, Industrial, Materials, Utilities & Medical |
|
Best Stocks Today 12Stocks.com |
© 2024 12Stocks.com Terms & Conditions Privacy Contact Us
All Information Provided Only For Education And Not To Be Used For Investing or Trading. See Terms & Conditions


One More Thing ... Get Best Stocks Delivered Daily!
Never Ever Miss A Move With Our Top Ten Stocks Lists
Find Best Stocks In Any Market - Bull or Bear Market
Take A Peek At Our Top Ten Stocks Lists: Daily, Weekly, Year-to-Date & Top Trends
Find Best Stocks In Any Market - Bull or Bear Market
Take A Peek At Our Top Ten Stocks Lists: Daily, Weekly, Year-to-Date & Top Trends
Smallcap Stocks With Best Up Trends [0-bearish to 100-bullish]: Vanda [100], ALX Oncology[100], Reneo [100], ProKidney [100], Cullinan Oncology[100], IMAX [100], Oscar Health[100], Envestnet [100], Macatawa Bank[100], Intra-Cellular Therapies[100], NextNav [100]
Best Smallcap Stocks Year-to-Date:
Agenus [578.83%], CareMax [418.56%], Janux [362.82%], Viking [265.5%], Super Micro[241.81%], Alpine Immune[238.58%], Arcutis Bio[218.73%], Longboard [181.01%], Vera [166.99%], Avidity Biosciences[164.93%], Stoke [131.18%] Best Smallcap Stocks This Week:
ProKidney [70.86%], Macatawa Bank[42.54%], Snap One[29.61%], ALX Oncology[27.82%], Vanda [27.18%], Intra-Cellular Therapies[20.54%], Zuora [14.36%], Escalade [13.71%], Encore Wire[10.31%], Cullinan Oncology[10.29%], Design [9.89%] Best Smallcap Stocks Daily:
Vanda [29.38%], WW [17.31%], Karyopharm [17.27%], Children s[16.60%], Zuora [16.12%], ALX Oncology[14.94%], Cutera [12.94%], Lineage Cell[12.17%], Citius [11.62%], Reneo [11.52%], Maxeon Solar[9.97%]