
 Login Sign Up


| |||||
 |  | ||||

| 12Stocks.com Market Intelligence |
Best SmallCap Stocks
|
| In a hurry? Small Cap Stock Lists: Performance Trends Table, Stock Charts
Sort Small Cap stocks: Daily, Weekly, Year-to-Date, Market Cap & Trends. Filter Small Cap stocks list by sector: Show all, Tech, Finance, Energy, Staples, Retail, Industrial, Materials, Utilities and HealthCare Filter Small Cap stocks list by size: All Large Medium Small and MicroCap |
| 12Stocks.com Small Cap Stocks Performances & Trends Daily | |||||||||
|
|  The overall Smart Investing & Trading Score is 23 (0-bearish to 100-bullish) which puts Small Cap index in short term bearish to neutral trend. The Smart Investing & Trading Score from previous trading session is 13 and hence an improvement of trend.
| ||||||||
Here are the Smart Investing & Trading Scores of the most requested small cap stocks at 12Stocks.com (click stock name for detailed review):
|


| 12Stocks.com: Investing in Smallcap Index with Stocks | |
|
The following table helps investors and traders sort through current performance and trends (as measured by Smart Investing & Trading Score) of various
stocks in the Smallcap Index. Quick View: Move mouse or cursor over stock symbol (ticker) to view short-term technical chart and over stock name to view long term chart. Click on  to add stock symbol to your watchlist and to add stock symbol to your watchlist and  to view watchlist. Click on any ticker or stock name for detailed market intelligence report for that stock. to view watchlist. Click on any ticker or stock name for detailed market intelligence report for that stock. |
12Stocks.com Performance of Stocks in Smallcap Index
| Ticker | Stock Name | Watchlist | Category | Recent Price | Smart Investing & Trading Score | Change % | YTD Change% |
| DHIL | Diamond Hill |   | Financials | 147.88 | 10 | -0.01% | -10.70% |
| WEAV | Weave | | Technology | 11.08 | 8 | 0.99% | -4.66% |
| OTTR | Otter Tail | | Utilities | 82.26 | 8 | 0.16% | -3.19% |
| SVRA | Savara | | Health Care | 4.81 | 8 | -3.02% | 2.34% |
| SIG | Signet Jewelers | | Services & Goods | 93.98 | 8 | -2.57% | -12.38% |
| CYTK | Cytokinetics | | Health Care | 67.00 | 8 | -1.37% | -19.75% |
| PJT | PJT Partners | | Financials | 91.25 | 8 | -1.05% | -10.43% |
| MMSI | Merit Medical | | Health Care | 71.04 | 8 | -0.66% | -6.48% |
| IPSC | Century | | Health Care | 2.97 | 5 | 5.13% | -10.00% |
| ALLK | Allakos | | Health Care | 1.06 | 5 | 0.47% | -60.99% |
| ANAB | AnaptysBio | | Health Care | 19.84 | 5 | -7.59% | -7.38% |
| MITK | Mitek Systems | | Technology | 11.98 | 5 | -1.56% | -8.13% |
| ALX | Alexander s | | Financials | 205.46 | 5 | -1.19% | -3.80% |
| WRBY | Warby Parker | | Health Care | 12.07 | 5 | -0.17% | -14.43% |
| LBPH | Longboard | | Health Care | 18.01 | 0 | 6.07% | 194.76% |
| PACB | Pacific Biosciences | | Health Care | 1.47 | 0 | 5.00% | -85.02% |
| SAGE | Sage | | Health Care | 13.03 | 0 | 3.66% | -39.87% |
| RXO | RXO | | Industrials | 19.84 | 0 | 3.17% | -15.10% |
| SCPH | sc | | Health Care | 4.52 | 0 | 2.26% | -27.91% |
| ATOM | Atomera | | Technology | 5.74 | 0 | 1.77% | -18.12% |
| CBL | CBL & Associates Properties | | Financials | 21.34 | 0 | 1.62% | -12.61% |
| PGEN | Precigen | | Health Care | 1.33 | 0 | 1.53% | -0.75% |
| SAMG | Silvercrest Asset | | Financials | 14.43 | 0 | 1.48% | -15.12% |
| CPS | Cooper-Standard | | Consumer Staples | 15.31 | 0 | 1.12% | -21.65% |
| TRNS | Transcat | | Technology | 105.82 | 0 | 1.06% | -3.21% |


| Too many stocks? View smallcap stocks filtered by marketcap & sector |
| Marketcap: All SmallCap Stocks (default-no microcap), Large, Mid-Range, Small |
| Smallcap Sector: Tech, Finance, Energy, Staples, Retail, Industrial, Materials, & Medical |
|
Get the most comprehensive stock market coverage daily at 12Stocks.com ➞ Best Stocks Today ➞ Best Stocks Weekly ➞ Best Stocks Year-to-Date ➞ Best Stocks Trends ➞  Best Stocks Today 12Stocks.com Best Nasdaq Stocks ➞ Best S&P 500 Stocks ➞ Best Tech Stocks ➞ Best Biotech Stocks ➞ |
| Detailed Overview of SmallCap Stocks |
| SmallCap Technical Overview, Leaders & Laggards, Top SmallCap ETF Funds & Detailed SmallCap Stocks List, Charts, Trends & More |
| Smallcap: Technical Analysis, Trends & YTD Performance | |
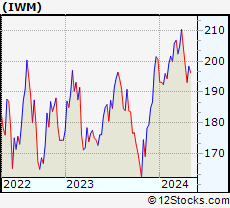
| SmallCap segment as represented by
IWM, an exchange-traded fund [ETF], holds basket of thousands of smallcap stocks from across all major sectors of the US stock market. The smallcap index (contains stocks like Riverbed & Sotheby's) is down by -3.92% and is currently underperforming the overall market by -8.11% year-to-date. Below is a quick view of technical charts and trends: | |
 IWM Weekly Chart |
|
| Long Term Trend: Not Good | |
| Medium Term Trend: Not Good | |
 IWM Daily Chart |
|
| Short Term Trend: Not Good | |
| Overall Trend Score: 23 | |
| YTD Performance: -3.92% | |
| **Trend Scores & Views Are Only For Educational Purposes And Not For Investing | |
| 12Stocks.com: Top Performing Small Cap Index Stocks | ||||||||||||||||||||||||||||||||||||||||||||||||
 The top performing Small Cap Index stocks year to date are
Now, more recently, over last week, the top performing Small Cap Index stocks on the move are


|
||||||||||||||||||||||||||||||||||||||||||||||||
| 12Stocks.com: Investing in Smallcap Index using Exchange Traded Funds | |
|
The following table shows list of key exchange traded funds (ETF) that
help investors track Smallcap index. The following list also includes leveraged ETF funds that track twice or thrice the daily returns of Smallcap indices. Short or inverse ETF funds move in the opposite direction to the index they track and are useful during market pullbacks or during bear markets. Quick View: Move mouse or cursor over ETF symbol (ticker) to view short-term technical chart and over ETF name to view long term chart. Click on ticker or stock name for detailed view. Click on to add stock symbol to your watchlist and to view watchlist. |
12Stocks.com List of ETFs that track Smallcap Index
| Ticker | ETF Name | Watchlist | Recent Price | Smart Investing & Trading Score | Change % | Week % | Year-to-date % |
| IWM | iShares Russell 2000 | | 192.84 | 23 | -0.08 | -2.94 | -3.92% |
| IJR | iShares Core S&P Small-Cap | | 102.34 | 31 | 0.21 | -2.08 | -5.46% |
| VTWO | Vanguard Russell 2000 ETF | | 77.94 | 23 | -0.14 | -2.96 | -3.9% |
| IWN | iShares Russell 2000 Value | | 146.33 | 10 | 0.21 | -2.69 | -5.79% |
| IJS | iShares S&P Small-Cap 600 Value | | 94.51 | 10 | 0.41 | -1.73 | -8.31% |
| IWO | iShares Russell 2000 Growth | | 246.94 | 36 | -0.44 | -3.3 | -2.09% |
| IJT | iShares S&P Small-Cap 600 Growth | | 121.59 | 23 | -0.21 | -2.56 | -2.84% |
| XSLV | PowerShares S&P SmallCap Low Volatil ETF | | 41.65 | 25 | 0.56 | -1.05 | -5.66% |
| SAA | ProShares Ultra SmallCap600 | | 21.62 | 10 | -0.18 | -4.17 | -13.35% |
| SMLV | SPDR SSGA US Small Cap Low Volatil ETF | | 103.83 | 18 | 0.16 | -1.13 | -7.72% |
| SBB | ProShares Short SmallCap600 | | 16.77 | 80 | -0.50 | 1.32 | 5.24% |
| SDD | ProShares UltraShort SmallCap600 | | 20.16 | 73 | -2.14 | 1.66 | 9.41% |
| 12Stocks.com: Charts, Trends, Fundamental Data and Performances of SmallCap Stocks | |
|
We now take in-depth look at all SmallCap stocks including charts, multi-period performances and overall trends (as measured by Smart Investing & Trading Score). One can sort SmallCap stocks (click link to choose) by Daily, Weekly and by Year-to-Date performances. Also, one can sort by size of the company or by market capitalization. |
| Select Your Default Chart Type: | |||||
| |||||
| Click on stock symbol or name for detailed view. Click on to add stock symbol to your watchlist and to view watchlist. Quick View: Move mouse or cursor over "Daily" to quickly view daily technical stock chart and over "Weekly" to view weekly technical stock chart. | |||||

 | DHIL Diamond Hill Investment Group, Inc. |
| Sector: Financials | |
| SubSector: Asset Management | |
| MarketCap: 316.203 Millions | |
| Recent Price: 147.88 Smart Investing & Trading Score: 10 | |
| Day Percent Change: -0.01% Day Change: -0.01 | |
| Week Change: -1.79% Year-to-date Change: -10.7% | |
| DHIL Links: Profile News Message Board | |
| Charts:- Daily , Weekly | |
| Add DHIL to Watchlist: View: Get Complete DHIL Trend Analysis ➞ | |
 | WEAV Weave Communications, Inc. |
| Sector: Technology | |
| SubSector: Software - Application | |
| MarketCap: 740 Millions | |
| Recent Price: 11.08 Smart Investing & Trading Score: 8 | |
| Day Percent Change: 0.99% Day Change: 0.11 | |
| Week Change: -4.33% Year-to-date Change: -4.7% | |
| WEAV Links: Profile News Message Board | |
| Charts:- Daily , Weekly | |
| Add WEAV to Watchlist: View: Get Complete WEAV Trend Analysis ➞ | |
 | OTTR Otter Tail Corporation |
| Sector: Utilities | |
| SubSector: Diversified Utilities | |
| MarketCap: 1728.2 Millions | |
| Recent Price: 82.26 Smart Investing & Trading Score: 8 | |
| Day Percent Change: 0.16% Day Change: 0.13 | |
| Week Change: -0.9% Year-to-date Change: -3.2% | |
| OTTR Links: Profile News Message Board | |
| Charts:- Daily , Weekly | |
| Add OTTR to Watchlist: View: Get Complete OTTR Trend Analysis ➞ | |
 | SVRA Savara Inc. |
| Sector: Health Care | |
| SubSector: Biotechnology | |
| MarketCap: 80.3785 Millions | |
| Recent Price: 4.81 Smart Investing & Trading Score: 8 | |
| Day Percent Change: -3.02% Day Change: -0.15 | |
| Week Change: -5.13% Year-to-date Change: 2.3% | |
| SVRA Links: Profile News Message Board | |
| Charts:- Daily , Weekly | |
| Add SVRA to Watchlist: View: Get Complete SVRA Trend Analysis ➞ | |
 | SIG Signet Jewelers Limited |
| Sector: Services & Goods | |
| SubSector: Jewelry Stores | |
| MarketCap: 518.1 Millions | |
| Recent Price: 93.98 Smart Investing & Trading Score: 8 | |
| Day Percent Change: -2.57% Day Change: -2.48 | |
| Week Change: -1.87% Year-to-date Change: -12.4% | |
| SIG Links: Profile News Message Board | |
| Charts:- Daily , Weekly | |
| Add SIG to Watchlist: View: Get Complete SIG Trend Analysis ➞ | |
 | CYTK Cytokinetics, Incorporated |
| Sector: Health Care | |
| SubSector: Biotechnology | |
| MarketCap: 654.285 Millions | |
| Recent Price: 67.00 Smart Investing & Trading Score: 8 | |
| Day Percent Change: -1.37% Day Change: -0.93 | |
| Week Change: -6.37% Year-to-date Change: -19.8% | |
| CYTK Links: Profile News Message Board | |
| Charts:- Daily , Weekly | |
| Add CYTK to Watchlist: View: Get Complete CYTK Trend Analysis ➞ | |
 | PJT PJT Partners Inc. |
| Sector: Financials | |
| SubSector: Asset Management | |
| MarketCap: 1100.93 Millions | |
| Recent Price: 91.25 Smart Investing & Trading Score: 8 | |
| Day Percent Change: -1.05% Day Change: -0.97 | |
| Week Change: -1.9% Year-to-date Change: -10.4% | |
| PJT Links: Profile News Message Board | |
| Charts:- Daily , Weekly | |
| Add PJT to Watchlist: View: Get Complete PJT Trend Analysis ➞ | |
 | MMSI Merit Medical Systems, Inc. |
| Sector: Health Care | |
| SubSector: Medical Instruments & Supplies | |
| MarketCap: 1719.2 Millions | |
| Recent Price: 71.04 Smart Investing & Trading Score: 8 | |
| Day Percent Change: -0.66% Day Change: -0.47 | |
| Week Change: -2.19% Year-to-date Change: -6.5% | |
| MMSI Links: Profile News Message Board | |
| Charts:- Daily , Weekly | |
| Add MMSI to Watchlist: View: Get Complete MMSI Trend Analysis ➞ | |
 | IPSC Century Therapeutics, Inc. |
| Sector: Health Care | |
| SubSector: Biotechnology | |
| MarketCap: 187 Millions | |
| Recent Price: 2.97 Smart Investing & Trading Score: 5 | |
| Day Percent Change: 5.13% Day Change: 0.15 | |
| Week Change: -24.04% Year-to-date Change: -10.0% | |
| IPSC Links: Profile News Message Board | |
| Charts:- Daily , Weekly | |
| Add IPSC to Watchlist: View: Get Complete IPSC Trend Analysis ➞ | |
 | ALLK Allakos Inc. |
| Sector: Health Care | |
| SubSector: Biotechnology | |
| MarketCap: 3233.55 Millions | |
| Recent Price: 1.06 Smart Investing & Trading Score: 5 | |
| Day Percent Change: 0.47% Day Change: 0.00 | |
| Week Change: -4.05% Year-to-date Change: -61.0% | |
| ALLK Links: Profile News Message Board | |
| Charts:- Daily , Weekly | |
| Add ALLK to Watchlist: View: Get Complete ALLK Trend Analysis ➞ | |
 | ANAB AnaptysBio, Inc. |
| Sector: Health Care | |
| SubSector: Biotechnology | |
| MarketCap: 405.985 Millions | |
| Recent Price: 19.84 Smart Investing & Trading Score: 5 | |
| Day Percent Change: -7.59% Day Change: -1.63 | |
| Week Change: -12.64% Year-to-date Change: -7.4% | |
| ANAB Links: Profile News Message Board | |
| Charts:- Daily , Weekly | |
| Add ANAB to Watchlist: View: Get Complete ANAB Trend Analysis ➞ | |
 | MITK Mitek Systems, Inc. |
| Sector: Technology | |
| SubSector: Application Software | |
| MarketCap: 265.962 Millions | |
| Recent Price: 11.98 Smart Investing & Trading Score: 5 | |
| Day Percent Change: -1.56% Day Change: -0.19 | |
| Week Change: -18.11% Year-to-date Change: -8.1% | |
| MITK Links: Profile News Message Board | |
| Charts:- Daily , Weekly | |
| Add MITK to Watchlist: View: Get Complete MITK Trend Analysis ➞ | |
 | ALX Alexander s, Inc. |
| Sector: Financials | |
| SubSector: REIT - Retail | |
| MarketCap: 1251.54 Millions | |
| Recent Price: 205.46 Smart Investing & Trading Score: 5 | |
| Day Percent Change: -1.19% Day Change: -2.47 | |
| Week Change: -5.16% Year-to-date Change: -3.8% | |
| ALX Links: Profile News Message Board | |
| Charts:- Daily , Weekly | |
| Add ALX to Watchlist: View: Get Complete ALX Trend Analysis ➞ | |
 | WRBY Warby Parker Inc. |
| Sector: Health Care | |
| SubSector: Medical Instruments & Supplies | |
| MarketCap: 1380 Millions | |
| Recent Price: 12.07 Smart Investing & Trading Score: 5 | |
| Day Percent Change: -0.17% Day Change: -0.02 | |
| Week Change: -8.7% Year-to-date Change: -14.4% | |
| WRBY Links: Profile News Message Board | |
| Charts:- Daily , Weekly | |
| Add WRBY to Watchlist: View: Get Complete WRBY Trend Analysis ➞ | |
 | LBPH Longboard Pharmaceuticals, Inc. |
| Sector: Health Care | |
| SubSector: Biotechnology | |
| MarketCap: 169 Millions | |
| Recent Price: 18.01 Smart Investing & Trading Score: 0 | |
| Day Percent Change: 6.07% Day Change: 1.03 | |
| Week Change: -6.2% Year-to-date Change: 194.8% | |
| LBPH Links: Profile News Message Board | |
| Charts:- Daily , Weekly | |
| Add LBPH to Watchlist: View: Get Complete LBPH Trend Analysis ➞ | |
 | PACB Pacific Biosciences of California, Inc. |
| Sector: Health Care | |
| SubSector: Biotechnology | |
| MarketCap: 470.685 Millions | |
| Recent Price: 1.47 Smart Investing & Trading Score: 0 | |
| Day Percent Change: 5.00% Day Change: 0.07 | |
| Week Change: -53.63% Year-to-date Change: -85.0% | |
| PACB Links: Profile News Message Board | |
| Charts:- Daily , Weekly | |
| Add PACB to Watchlist: View: Get Complete PACB Trend Analysis ➞ | |
 | SAGE Sage Therapeutics, Inc. |
| Sector: Health Care | |
| SubSector: Biotechnology | |
| MarketCap: 1683.75 Millions | |
| Recent Price: 13.03 Smart Investing & Trading Score: 0 | |
| Day Percent Change: 3.66% Day Change: 0.46 | |
| Week Change: -15.61% Year-to-date Change: -39.9% | |
| SAGE Links: Profile News Message Board | |
| Charts:- Daily , Weekly | |
| Add SAGE to Watchlist: View: Get Complete SAGE Trend Analysis ➞ | |
 | RXO RXO, Inc. |
| Sector: Industrials | |
| SubSector: Trucking | |
| MarketCap: 2550 Millions | |
| Recent Price: 19.84 Smart Investing & Trading Score: 0 | |
| Day Percent Change: 3.17% Day Change: 0.61 | |
| Week Change: -3.74% Year-to-date Change: -15.1% | |
| RXO Links: Profile News Message Board | |
| Charts:- Daily , Weekly | |
| Add RXO to Watchlist: View: Get Complete RXO Trend Analysis ➞ | |
 | SCPH scPharmaceuticals Inc. |
| Sector: Health Care | |
| SubSector: Biotechnology | |
| MarketCap: 136.185 Millions | |
| Recent Price: 4.52 Smart Investing & Trading Score: 0 | |
| Day Percent Change: 2.26% Day Change: 0.10 | |
| Week Change: -8.32% Year-to-date Change: -27.9% | |
| SCPH Links: Profile News Message Board | |
| Charts:- Daily , Weekly | |
| Add SCPH to Watchlist: View: Get Complete SCPH Trend Analysis ➞ | |
 | ATOM Atomera Incorporated |
| Sector: Technology | |
| SubSector: Semiconductor Equipment & Materials | |
| MarketCap: 60.6918 Millions | |
| Recent Price: 5.74 Smart Investing & Trading Score: 0 | |
| Day Percent Change: 1.77% Day Change: 0.10 | |
| Week Change: -5.12% Year-to-date Change: -18.1% | |
| ATOM Links: Profile News Message Board | |
| Charts:- Daily , Weekly | |
| Add ATOM to Watchlist: View: Get Complete ATOM Trend Analysis ➞ | |
 | CBL CBL & Associates Properties, Inc. |
| Sector: Financials | |
| SubSector: REIT - Retail | |
| MarketCap: 690 Millions | |
| Recent Price: 21.34 Smart Investing & Trading Score: 0 | |
| Day Percent Change: 1.62% Day Change: 0.34 | |
| Week Change: -2.56% Year-to-date Change: -12.6% | |
| CBL Links: Profile News Message Board | |
| Charts:- Daily , Weekly | |
| Add CBL to Watchlist: View: Get Complete CBL Trend Analysis ➞ | |
 | PGEN Precigen, Inc. |
| Sector: Health Care | |
| SubSector: Biotechnology | |
| MarketCap: 564.785 Millions | |
| Recent Price: 1.33 Smart Investing & Trading Score: 0 | |
| Day Percent Change: 1.53% Day Change: 0.02 | |
| Week Change: -6.34% Year-to-date Change: -0.8% | |
| PGEN Links: Profile News Message Board | |
| Charts:- Daily , Weekly | |
| Add PGEN to Watchlist: View: Get Complete PGEN Trend Analysis ➞ | |
 | SAMG Silvercrest Asset Management Group Inc. |
| Sector: Financials | |
| SubSector: Asset Management | |
| MarketCap: 116.303 Millions | |
| Recent Price: 14.43 Smart Investing & Trading Score: 0 | |
| Day Percent Change: 1.48% Day Change: 0.21 | |
| Week Change: -2.5% Year-to-date Change: -15.1% | |
| SAMG Links: Profile News Message Board | |
| Charts:- Daily , Weekly | |
| Add SAMG to Watchlist: View: Get Complete SAMG Trend Analysis ➞ | |
 | CPS Cooper-Standard Holdings Inc. |
| Sector: Consumer Staples | |
| SubSector: Auto Parts | |
| MarketCap: 184.339 Millions | |
| Recent Price: 15.31 Smart Investing & Trading Score: 0 | |
| Day Percent Change: 1.12% Day Change: 0.17 | |
| Week Change: -11.35% Year-to-date Change: -21.7% | |
| CPS Links: Profile News Message Board | |
| Charts:- Daily , Weekly | |
| Add CPS to Watchlist: View: Get Complete CPS Trend Analysis ➞ | |
 | TRNS Transcat, Inc. |
| Sector: Technology | |
| SubSector: Scientific & Technical Instruments | |
| MarketCap: 216.653 Millions | |
| Recent Price: 105.82 Smart Investing & Trading Score: 0 | |
| Day Percent Change: 1.06% Day Change: 1.11 | |
| Week Change: -4.05% Year-to-date Change: -3.2% | |
| TRNS Links: Profile News Message Board | |
| Charts:- Daily , Weekly | |
| Add TRNS to Watchlist: View: Get Complete TRNS Trend Analysis ➞ | |
| Too many stocks? View smallcap stocks filtered by marketcap & sector |
| Marketcap: All SmallCap Stocks (default-no microcap), Large, Mid-Range, Small & MicroCap |
| Sector: Tech, Finance, Energy, Staples, Retail, Industrial, Materials, Utilities & Medical |
|
Best Stocks Today 12Stocks.com |
© 2024 12Stocks.com Terms & Conditions Privacy Contact Us
All Information Provided Only For Education And Not To Be Used For Investing or Trading. See Terms & Conditions


One More Thing ... Get Best Stocks Delivered Daily!
Never Ever Miss A Move With Our Top Ten Stocks Lists
Find Best Stocks In Any Market - Bull or Bear Market
Take A Peek At Our Top Ten Stocks Lists: Daily, Weekly, Year-to-Date & Top Trends
Find Best Stocks In Any Market - Bull or Bear Market
Take A Peek At Our Top Ten Stocks Lists: Daily, Weekly, Year-to-Date & Top Trends
Smallcap Stocks With Best Up Trends [0-bearish to 100-bullish]: Badger Meter[100], Cullinan Oncology[100], Oscar Health[100], NextNav [100], Richardson Electronics[100], Seneca Foods[100], Lantheus [100], Macatawa Bank[100], Geron [100], IMAX [100], Regional Management[100]
Best Smallcap Stocks Year-to-Date:
Agenus [500.31%], CareMax [417.53%], Janux [348.12%], Viking [248.9%], Alpine Immune[238.5%], Super Micro[226.74%], Longboard [194.76%], Arcutis Bio[192.57%], Vera [161.3%], Avidity Biosciences[154.87%], Hippo [128.32%] Best Smallcap Stocks This Week:
Macatawa Bank[44.53%], 23andMe Holding[33.3%], ProKidney [32%], Snap One[29.73%], Vertex Energy[23.08%], ALX Oncology[20.64%], Vanda [20.63%], Expensify [18.37%], Badger Meter[16.72%], ContextLogic [15%], Cullinan Oncology[13.89%] Best Smallcap Stocks Daily:
23andMe Holding[65.91%], Vertex Energy[30.72%], Zura Bio[17.20%], Badger Meter[16.65%], ContextLogic [15.81%], Expensify [15.23%], Montrose Environmental[12.84%], Vaxxinity [10.05%], Vuzix [9.87%], Cipher Mining[8.65%], FiscalNote [8.61%]