
 Login Sign Up


| |||||
 |  | ||||

| 12Stocks.com Market Intelligence |
Best SmallCap Stocks
|
| In a hurry? Small Cap Stock Lists: Performance Trends Table, Stock Charts
Sort Small Cap stocks: Daily, Weekly, Year-to-Date, Market Cap & Trends. Filter Small Cap stocks list by sector: Show all, Tech, Finance, Energy, Staples, Retail, Industrial, Materials, Utilities and HealthCare Filter Small Cap stocks list by size: All Large Medium Small and MicroCap |
| 12Stocks.com Small Cap Stocks Performances & Trends Daily | |||||||||
|
|  The overall Smart Investing & Trading Score is 23 (0-bearish to 100-bullish) which puts Small Cap index in short term bearish to neutral trend. The Smart Investing & Trading Score from previous trading session is 13 and hence an improvement of trend.
| ||||||||
Here are the Smart Investing & Trading Scores of the most requested small cap stocks at 12Stocks.com (click stock name for detailed review):
|


| 12Stocks.com: Investing in Smallcap Index with Stocks | |
|
The following table helps investors and traders sort through current performance and trends (as measured by Smart Investing & Trading Score) of various
stocks in the Smallcap Index. Quick View: Move mouse or cursor over stock symbol (ticker) to view short-term technical chart and over stock name to view long term chart. Click on  to add stock symbol to your watchlist and to add stock symbol to your watchlist and  to view watchlist. Click on any ticker or stock name for detailed market intelligence report for that stock. to view watchlist. Click on any ticker or stock name for detailed market intelligence report for that stock. |
12Stocks.com Performance of Stocks in Smallcap Index
| Ticker | Stock Name | Watchlist | Category | Recent Price | Smart Investing & Trading Score | Change % | YTD Change% |
| DEA | Easterly Government |   | Financials | 11.42 | 52 | 1.87% | -15.03% |
| CIO | City Office | | Financials | 4.46 | 52 | 1.83% | -27.00% |
| GOGO | Gogo | | Technology | 8.38 | 52 | 1.76% | -17.23% |
| CWT | California Water | | Utilities | 44.90 | 52 | 1.65% | -13.44% |
| ATSG | Air Transport | | Transports | 12.62 | 52 | 1.37% | -28.34% |
| EFC | Ellington Financial | | Financials | 11.27 | 52 | 1.35% | -11.33% |
| WEST | Westrock Coffee | | Consumer Staples | 10.17 | 52 | 1.29% | 0.10% |
| HFWA | Heritage Financial | | Financials | 17.56 | 52 | 1.27% | -17.91% |
| FBMS | First Bancshares | | Financials | 23.74 | 52 | 1.24% | -19.06% |
| BMRC | Bank of Marin Bancorp | | Financials | 15.17 | 52 | 1.13% | -31.11% |
| NSP | Insperity | | Services & Goods | 106.80 | 52 | 0.99% | -8.89% |
| HTBK | Heritage Commerce | | Financials | 7.91 | 52 | 0.76% | -20.26% |
| AAT | American Assets | | Financials | 20.56 | 52 | 0.49% | -8.66% |
| RC | Ready Capital | | Financials | 8.47 | 52 | 0.00% | -17.37% |
| EVEX | Eve Holding | | Industrials | 5.18 | 52 | 0.00% | -29.62% |
| CEIX | CONSOL Energy | | Materials | 84.00 | 52 | -1.78% | -16.44% |
| ITIC | Investors Title | | Financials | 158.48 | 52 | 1.12% | -2.26% |
| SPTN | SpartanNash | | Consumer Staples | 19.22 | 52 | 0.89% | -16.25% |
| HIPO | Hippo | | Financials | 20.80 | 51 | 2.56% | 128.32% |
| TG | Tredegar | | Materials | 6.47 | 51 | 2.05% | 19.59% |
| ELF | e.l.f. Beauty | | Consumer Staples | 167.51 | 51 | 0.75% | 16.05% |
| DCO | Ducommun | | Industrials | 51.85 | 51 | 0.72% | -0.40% |
| JANX | Janux | | Health Care | 48.15 | 51 | 0.46% | 348.12% |
| LXU | LSB Industries | | Materials | 7.96 | 51 | 0.13% | -14.50% |
| LGND | Ligand | | Health Care | 72.61 | 51 | -7.94% | 1.67% |


| Too many stocks? View smallcap stocks filtered by marketcap & sector |
| Marketcap: All SmallCap Stocks (default-no microcap), Large, Mid-Range, Small |
| Smallcap Sector: Tech, Finance, Energy, Staples, Retail, Industrial, Materials, & Medical |
|
Get the most comprehensive stock market coverage daily at 12Stocks.com ➞ Best Stocks Today ➞ Best Stocks Weekly ➞ Best Stocks Year-to-Date ➞ Best Stocks Trends ➞  Best Stocks Today 12Stocks.com Best Nasdaq Stocks ➞ Best S&P 500 Stocks ➞ Best Tech Stocks ➞ Best Biotech Stocks ➞ |
| Detailed Overview of SmallCap Stocks |
| SmallCap Technical Overview, Leaders & Laggards, Top SmallCap ETF Funds & Detailed SmallCap Stocks List, Charts, Trends & More |
| Smallcap: Technical Analysis, Trends & YTD Performance | |
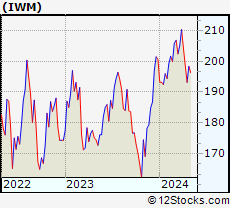
| SmallCap segment as represented by
IWM, an exchange-traded fund [ETF], holds basket of thousands of smallcap stocks from across all major sectors of the US stock market. The smallcap index (contains stocks like Riverbed & Sotheby's) is down by -3.92% and is currently underperforming the overall market by -8.11% year-to-date. Below is a quick view of technical charts and trends: | |
 IWM Weekly Chart |
|
| Long Term Trend: Not Good | |
| Medium Term Trend: Not Good | |
 IWM Daily Chart |
|
| Short Term Trend: Not Good | |
| Overall Trend Score: 23 | |
| YTD Performance: -3.92% | |
| **Trend Scores & Views Are Only For Educational Purposes And Not For Investing | |
| 12Stocks.com: Top Performing Small Cap Index Stocks | ||||||||||||||||||||||||||||||||||||||||||||||||
 The top performing Small Cap Index stocks year to date are
Now, more recently, over last week, the top performing Small Cap Index stocks on the move are


|
||||||||||||||||||||||||||||||||||||||||||||||||
| 12Stocks.com: Investing in Smallcap Index using Exchange Traded Funds | |
|
The following table shows list of key exchange traded funds (ETF) that
help investors track Smallcap index. The following list also includes leveraged ETF funds that track twice or thrice the daily returns of Smallcap indices. Short or inverse ETF funds move in the opposite direction to the index they track and are useful during market pullbacks or during bear markets. Quick View: Move mouse or cursor over ETF symbol (ticker) to view short-term technical chart and over ETF name to view long term chart. Click on ticker or stock name for detailed view. Click on to add stock symbol to your watchlist and to view watchlist. |
12Stocks.com List of ETFs that track Smallcap Index
| Ticker | ETF Name | Watchlist | Recent Price | Smart Investing & Trading Score | Change % | Week % | Year-to-date % |
| IWM | iShares Russell 2000 | | 192.84 | 23 | -0.08 | -2.94 | -3.92% |
| IJR | iShares Core S&P Small-Cap | | 102.34 | 31 | 0.21 | -2.08 | -5.46% |
| VTWO | Vanguard Russell 2000 ETF | | 77.94 | 23 | -0.14 | -2.96 | -3.9% |
| IWN | iShares Russell 2000 Value | | 146.33 | 10 | 0.21 | -2.69 | -5.79% |
| IJS | iShares S&P Small-Cap 600 Value | | 94.51 | 10 | 0.41 | -1.73 | -8.31% |
| IWO | iShares Russell 2000 Growth | | 246.94 | 36 | -0.44 | -3.3 | -2.09% |
| IJT | iShares S&P Small-Cap 600 Growth | | 121.59 | 23 | -0.21 | -2.56 | -2.84% |
| XSLV | PowerShares S&P SmallCap Low Volatil ETF | | 41.65 | 25 | 0.56 | -1.05 | -5.66% |
| SAA | ProShares Ultra SmallCap600 | | 21.62 | 10 | -0.18 | -4.17 | -13.35% |
| SMLV | SPDR SSGA US Small Cap Low Volatil ETF | | 103.83 | 18 | 0.16 | -1.13 | -7.72% |
| SBB | ProShares Short SmallCap600 | | 16.77 | 80 | -0.50 | 1.32 | 5.24% |
| SDD | ProShares UltraShort SmallCap600 | | 20.16 | 73 | -2.14 | 1.66 | 9.41% |
| 12Stocks.com: Charts, Trends, Fundamental Data and Performances of SmallCap Stocks | |
|
We now take in-depth look at all SmallCap stocks including charts, multi-period performances and overall trends (as measured by Smart Investing & Trading Score). One can sort SmallCap stocks (click link to choose) by Daily, Weekly and by Year-to-Date performances. Also, one can sort by size of the company or by market capitalization. |
| Select Your Default Chart Type: | |||||
| |||||
| Click on stock symbol or name for detailed view. Click on to add stock symbol to your watchlist and to view watchlist. Quick View: Move mouse or cursor over "Daily" to quickly view daily technical stock chart and over "Weekly" to view weekly technical stock chart. | |||||

 | DEA Easterly Government Properties, Inc. |
| Sector: Financials | |
| SubSector: REIT - Office | |
| MarketCap: 1832.56 Millions | |
| Recent Price: 11.42 Smart Investing & Trading Score: 52 | |
| Day Percent Change: 1.87% Day Change: 0.21 | |
| Week Change: 0.44% Year-to-date Change: -15.0% | |
| DEA Links: Profile News Message Board | |
| Charts:- Daily , Weekly | |
| Add DEA to Watchlist: View: Get Complete DEA Trend Analysis ➞ | |
 | CIO City Office REIT, Inc. |
| Sector: Financials | |
| SubSector: REIT - Office | |
| MarketCap: 478.566 Millions | |
| Recent Price: 4.46 Smart Investing & Trading Score: 52 | |
| Day Percent Change: 1.83% Day Change: 0.08 | |
| Week Change: -0.89% Year-to-date Change: -27.0% | |
| CIO Links: Profile News Message Board | |
| Charts:- Daily , Weekly | |
| Add CIO to Watchlist: View: Get Complete CIO Trend Analysis ➞ | |
 | GOGO Gogo Inc. |
| Sector: Technology | |
| SubSector: Diversified Communication Services | |
| MarketCap: 307.064 Millions | |
| Recent Price: 8.38 Smart Investing & Trading Score: 52 | |
| Day Percent Change: 1.76% Day Change: 0.14 | |
| Week Change: 0.9% Year-to-date Change: -17.2% | |
| GOGO Links: Profile News Message Board | |
| Charts:- Daily , Weekly | |
| Add GOGO to Watchlist: View: Get Complete GOGO Trend Analysis ➞ | |
 | CWT California Water Service Group |
| Sector: Utilities | |
| SubSector: Water Utilities | |
| MarketCap: 2790.92 Millions | |
| Recent Price: 44.90 Smart Investing & Trading Score: 52 | |
| Day Percent Change: 1.65% Day Change: 0.73 | |
| Week Change: 1.13% Year-to-date Change: -13.4% | |
| CWT Links: Profile News Message Board | |
| Charts:- Daily , Weekly | |
| Add CWT to Watchlist: View: Get Complete CWT Trend Analysis ➞ | |
 | ATSG Air Transport Services Group, Inc. |
| Sector: Transports | |
| SubSector: Air Delivery & Freight Services | |
| MarketCap: 1111.68 Millions | |
| Recent Price: 12.62 Smart Investing & Trading Score: 52 | |
| Day Percent Change: 1.37% Day Change: 0.17 | |
| Week Change: -1.41% Year-to-date Change: -28.3% | |
| ATSG Links: Profile News Message Board | |
| Charts:- Daily , Weekly | |
| Add ATSG to Watchlist: View: Get Complete ATSG Trend Analysis ➞ | |
 | EFC Ellington Financial Inc. |
| Sector: Financials | |
| SubSector: Mortgage Investment | |
| MarketCap: 380.239 Millions | |
| Recent Price: 11.27 Smart Investing & Trading Score: 52 | |
| Day Percent Change: 1.35% Day Change: 0.15 | |
| Week Change: 0.71% Year-to-date Change: -11.3% | |
| EFC Links: Profile News Message Board | |
| Charts:- Daily , Weekly | |
| Add EFC to Watchlist: View: Get Complete EFC Trend Analysis ➞ | |
 | WEST Westrock Coffee Company, LLC |
| Sector: Consumer Staples | |
| SubSector: Packaged Foods | |
| MarketCap: 799 Millions | |
| Recent Price: 10.17 Smart Investing & Trading Score: 52 | |
| Day Percent Change: 1.29% Day Change: 0.13 | |
| Week Change: 1.8% Year-to-date Change: 0.1% | |
| WEST Links: Profile News Message Board | |
| Charts:- Daily , Weekly | |
| Add WEST to Watchlist: View: Get Complete WEST Trend Analysis ➞ | |
 | HFWA Heritage Financial Corporation |
| Sector: Financials | |
| SubSector: Regional - Pacific Banks | |
| MarketCap: 752.829 Millions | |
| Recent Price: 17.56 Smart Investing & Trading Score: 52 | |
| Day Percent Change: 1.27% Day Change: 0.22 | |
| Week Change: 1.44% Year-to-date Change: -17.9% | |
| HFWA Links: Profile News Message Board | |
| Charts:- Daily , Weekly | |
| Add HFWA to Watchlist: View: Get Complete HFWA Trend Analysis ➞ | |
 | FBMS The First Bancshares, Inc. |
| Sector: Financials | |
| SubSector: Regional - Southeast Banks | |
| MarketCap: 359.535 Millions | |
| Recent Price: 23.74 Smart Investing & Trading Score: 52 | |
| Day Percent Change: 1.24% Day Change: 0.29 | |
| Week Change: -0.04% Year-to-date Change: -19.1% | |
| FBMS Links: Profile News Message Board | |
| Charts:- Daily , Weekly | |
| Add FBMS to Watchlist: View: Get Complete FBMS Trend Analysis ➞ | |
 | BMRC Bank of Marin Bancorp |
| Sector: Financials | |
| SubSector: Regional - Pacific Banks | |
| MarketCap: 367.929 Millions | |
| Recent Price: 15.17 Smart Investing & Trading Score: 52 | |
| Day Percent Change: 1.13% Day Change: 0.17 | |
| Week Change: 1.2% Year-to-date Change: -31.1% | |
| BMRC Links: Profile News Message Board | |
| Charts:- Daily , Weekly | |
| Add BMRC to Watchlist: View: Get Complete BMRC Trend Analysis ➞ | |
 | NSP Insperity, Inc. |
| Sector: Services & Goods | |
| SubSector: Business Services | |
| MarketCap: 1385.32 Millions | |
| Recent Price: 106.80 Smart Investing & Trading Score: 52 | |
| Day Percent Change: 0.99% Day Change: 1.05 | |
| Week Change: 0.83% Year-to-date Change: -8.9% | |
| NSP Links: Profile News Message Board | |
| Charts:- Daily , Weekly | |
| Add NSP to Watchlist: View: Get Complete NSP Trend Analysis ➞ | |
 | HTBK Heritage Commerce Corp |
| Sector: Financials | |
| SubSector: Regional - Pacific Banks | |
| MarketCap: 416.129 Millions | |
| Recent Price: 7.91 Smart Investing & Trading Score: 52 | |
| Day Percent Change: 0.76% Day Change: 0.06 | |
| Week Change: 0% Year-to-date Change: -20.3% | |
| HTBK Links: Profile News Message Board | |
| Charts:- Daily , Weekly | |
| Add HTBK to Watchlist: View: Get Complete HTBK Trend Analysis ➞ | |
 | AAT American Assets Trust, Inc. |
| Sector: Financials | |
| SubSector: REIT - Retail | |
| MarketCap: 1580.54 Millions | |
| Recent Price: 20.56 Smart Investing & Trading Score: 52 | |
| Day Percent Change: 0.49% Day Change: 0.10 | |
| Week Change: -1.01% Year-to-date Change: -8.7% | |
| AAT Links: Profile News Message Board | |
| Charts:- Daily , Weekly | |
| Add AAT to Watchlist: View: Get Complete AAT Trend Analysis ➞ | |
 | RC Ready Capital Corporation |
| Sector: Financials | |
| SubSector: Mortgage Investment | |
| MarketCap: 358.039 Millions | |
| Recent Price: 8.47 Smart Investing & Trading Score: 52 | |
| Day Percent Change: 0.00% Day Change: 0.00 | |
| Week Change: 1.8% Year-to-date Change: -17.4% | |
| RC Links: Profile News Message Board | |
| Charts:- Daily , Weekly | |
| Add RC to Watchlist: View: Get Complete RC Trend Analysis ➞ | |
 | EVEX Eve Holding, Inc. |
| Sector: Industrials | |
| SubSector: Aerospace & Defense | |
| MarketCap: 2830 Millions | |
| Recent Price: 5.18 Smart Investing & Trading Score: 52 | |
| Day Percent Change: 0.00% Day Change: 0.00 | |
| Week Change: 0.97% Year-to-date Change: -29.6% | |
| EVEX Links: Profile News Message Board | |
| Charts:- Daily , Weekly | |
| Add EVEX to Watchlist: View: Get Complete EVEX Trend Analysis ➞ | |
 | CEIX CONSOL Energy Inc. |
| Sector: Materials | |
| SubSector: Industrial Metals & Minerals | |
| MarketCap: 196.81 Millions | |
| Recent Price: 84.00 Smart Investing & Trading Score: 52 | |
| Day Percent Change: -1.78% Day Change: -1.52 | |
| Week Change: 0.47% Year-to-date Change: -16.4% | |
| CEIX Links: Profile News Message Board | |
| Charts:- Daily , Weekly | |
| Add CEIX to Watchlist: View: Get Complete CEIX Trend Analysis ➞ | |
 | ITIC Investors Title Company |
| Sector: Financials | |
| SubSector: Surety & Title Insurance | |
| MarketCap: 219.518 Millions | |
| Recent Price: 158.48 Smart Investing & Trading Score: 52 | |
| Day Percent Change: 1.12% Day Change: 1.76 | |
| Week Change: 1.24% Year-to-date Change: -2.3% | |
| ITIC Links: Profile News Message Board | |
| Charts:- Daily , Weekly | |
| Add ITIC to Watchlist: View: Get Complete ITIC Trend Analysis ➞ | |
 | SPTN SpartanNash Company |
| Sector: Consumer Staples | |
| SubSector: Food Wholesale | |
| MarketCap: 671.229 Millions | |
| Recent Price: 19.22 Smart Investing & Trading Score: 52 | |
| Day Percent Change: 0.89% Day Change: 0.17 | |
| Week Change: 2.62% Year-to-date Change: -16.3% | |
| SPTN Links: Profile News Message Board | |
| Charts:- Daily , Weekly | |
| Add SPTN to Watchlist: View: Get Complete SPTN Trend Analysis ➞ | |
 | HIPO Hippo Holdings Inc. |
| Sector: Financials | |
| SubSector: Insurance - Specialty | |
| MarketCap: 377 Millions | |
| Recent Price: 20.80 Smart Investing & Trading Score: 51 | |
| Day Percent Change: 2.56% Day Change: 0.52 | |
| Week Change: -7.51% Year-to-date Change: 128.3% | |
| HIPO Links: Profile News Message Board | |
| Charts:- Daily , Weekly | |
| Add HIPO to Watchlist: View: Get Complete HIPO Trend Analysis ➞ | |
 | TG Tredegar Corporation |
| Sector: Materials | |
| SubSector: Specialty Chemicals | |
| MarketCap: 545.057 Millions | |
| Recent Price: 6.47 Smart Investing & Trading Score: 51 | |
| Day Percent Change: 2.05% Day Change: 0.13 | |
| Week Change: 0.31% Year-to-date Change: 19.6% | |
| TG Links: Profile News Message Board | |
| Charts:- Daily , Weekly | |
| Add TG to Watchlist: View: Get Complete TG Trend Analysis ➞ | |
 | ELF e.l.f. Beauty, Inc. |
| Sector: Consumer Staples | |
| SubSector: Personal Products | |
| MarketCap: 497.985 Millions | |
| Recent Price: 167.51 Smart Investing & Trading Score: 51 | |
| Day Percent Change: 0.75% Day Change: 1.25 | |
| Week Change: 2.82% Year-to-date Change: 16.1% | |
| ELF Links: Profile News Message Board | |
| Charts:- Daily , Weekly | |
| Add ELF to Watchlist: View: Get Complete ELF Trend Analysis ➞ | |
 | DCO Ducommun Incorporated |
| Sector: Industrials | |
| SubSector: Aerospace/Defense Products & Services | |
| MarketCap: 261.101 Millions | |
| Recent Price: 51.85 Smart Investing & Trading Score: 51 | |
| Day Percent Change: 0.72% Day Change: 0.37 | |
| Week Change: -5.45% Year-to-date Change: -0.4% | |
| DCO Links: Profile News Message Board | |
| Charts:- Daily , Weekly | |
| Add DCO to Watchlist: View: Get Complete DCO Trend Analysis ➞ | |
 | JANX Janux Therapeutics, Inc. |
| Sector: Health Care | |
| SubSector: Biotechnology | |
| MarketCap: 496 Millions | |
| Recent Price: 48.15 Smart Investing & Trading Score: 51 | |
| Day Percent Change: 0.46% Day Change: 0.22 | |
| Week Change: -8.55% Year-to-date Change: 348.1% | |
| JANX Links: Profile News Message Board | |
| Charts:- Daily , Weekly | |
| Add JANX to Watchlist: View: Get Complete JANX Trend Analysis ➞ | |
 | LXU LSB Industries, Inc. |
| Sector: Materials | |
| SubSector: Chemicals - Major Diversified | |
| MarketCap: 51.7736 Millions | |
| Recent Price: 7.96 Smart Investing & Trading Score: 51 | |
| Day Percent Change: 0.13% Day Change: 0.01 | |
| Week Change: -2.45% Year-to-date Change: -14.5% | |
| LXU Links: Profile News Message Board | |
| Charts:- Daily , Weekly | |
| Add LXU to Watchlist: View: Get Complete LXU Trend Analysis ➞ | |
 | LGND Ligand Pharmaceuticals Incorporated |
| Sector: Health Care | |
| SubSector: Biotechnology | |
| MarketCap: 1344.45 Millions | |
| Recent Price: 72.61 Smart Investing & Trading Score: 51 | |
| Day Percent Change: -7.94% Day Change: -6.26 | |
| Week Change: -10.75% Year-to-date Change: 1.7% | |
| LGND Links: Profile News Message Board | |
| Charts:- Daily , Weekly | |
| Add LGND to Watchlist: View: Get Complete LGND Trend Analysis ➞ | |
| Too many stocks? View smallcap stocks filtered by marketcap & sector |
| Marketcap: All SmallCap Stocks (default-no microcap), Large, Mid-Range, Small & MicroCap |
| Sector: Tech, Finance, Energy, Staples, Retail, Industrial, Materials, Utilities & Medical |
|
Best Stocks Today 12Stocks.com |
© 2024 12Stocks.com Terms & Conditions Privacy Contact Us
All Information Provided Only For Education And Not To Be Used For Investing or Trading. See Terms & Conditions


One More Thing ... Get Best Stocks Delivered Daily!
Never Ever Miss A Move With Our Top Ten Stocks Lists
Find Best Stocks In Any Market - Bull or Bear Market
Take A Peek At Our Top Ten Stocks Lists: Daily, Weekly, Year-to-Date & Top Trends
Find Best Stocks In Any Market - Bull or Bear Market
Take A Peek At Our Top Ten Stocks Lists: Daily, Weekly, Year-to-Date & Top Trends
Smallcap Stocks With Best Up Trends [0-bearish to 100-bullish]: Badger Meter[100], Cullinan Oncology[100], Oscar Health[100], NextNav [100], Richardson Electronics[100], Seneca Foods[100], Lantheus [100], Macatawa Bank[100], Geron [100], IMAX [100], Regional Management[100]
Best Smallcap Stocks Year-to-Date:
Agenus [500.31%], CareMax [417.53%], Janux [348.12%], Viking [248.9%], Alpine Immune[238.5%], Super Micro[226.74%], Longboard [194.76%], Arcutis Bio[192.57%], Vera [161.3%], Avidity Biosciences[154.87%], Hippo [128.32%] Best Smallcap Stocks This Week:
Macatawa Bank[44.53%], 23andMe Holding[33.3%], ProKidney [32%], Snap One[29.73%], Vertex Energy[23.08%], ALX Oncology[20.64%], Vanda [20.63%], Expensify [18.37%], Badger Meter[16.72%], ContextLogic [15%], Cullinan Oncology[13.89%] Best Smallcap Stocks Daily:
23andMe Holding[65.91%], Vertex Energy[30.72%], Zura Bio[17.20%], Badger Meter[16.65%], ContextLogic [15.81%], Expensify [15.23%], Montrose Environmental[12.84%], Vaxxinity [10.05%], Vuzix [9.87%], Cipher Mining[8.65%], FiscalNote [8.61%]