
 Login Sign Up


| |||||
 |  | ||||

| 12Stocks.com Market Intelligence |
Best SmallCap Stocks
|
| In a hurry? Small Cap Stock Lists: Performance Trends Table, Stock Charts
Sort Small Cap stocks: Daily, Weekly, Year-to-Date, Market Cap & Trends. Filter Small Cap stocks list by sector: Show all, Tech, Finance, Energy, Staples, Retail, Industrial, Materials, Utilities and HealthCare Filter Small Cap stocks list by size: All Large Medium Small and MicroCap |
| 12Stocks.com Small Cap Stocks Performances & Trends Daily | |||||||||
|
|  The overall Smart Investing & Trading Score is 44 (0-bearish to 100-bullish) which puts Small Cap index in short term neutral trend. The Smart Investing & Trading Score from previous trading session is 13 and hence an improvement of trend.
| ||||||||
Here are the Smart Investing & Trading Scores of the most requested small cap stocks at 12Stocks.com (click stock name for detailed review):
|


| 12Stocks.com: Investing in Smallcap Index with Stocks | |
|
The following table helps investors and traders sort through current performance and trends (as measured by Smart Investing & Trading Score) of various
stocks in the Smallcap Index. Quick View: Move mouse or cursor over stock symbol (ticker) to view short-term technical chart and over stock name to view long term chart. Click on  to add stock symbol to your watchlist and to add stock symbol to your watchlist and  to view watchlist. Click on any ticker or stock name for detailed market intelligence report for that stock. to view watchlist. Click on any ticker or stock name for detailed market intelligence report for that stock. |
12Stocks.com Performance of Stocks in Smallcap Index
| Ticker | Stock Name | Watchlist | Category | Recent Price | Smart Investing & Trading Score | Change % | YTD Change% |
| PLUS | ePlus |   | Technology | 75.31 | 20 | -0.15% | -5.67% |
| BLFY | Blue Foundry | | Financials | 7.96 | 20 | -0.13% | -17.34% |
| INNV | InnovAge Holding | | Health Care | 4.05 | 20 | -0.12% | -28.95% |
| NTLA | Intellia | | Health Care | 21.48 | 20 | -0.09% | -29.55% |
| TDS | Telephone and | | Technology | 14.95 | 20 | -0.07% | -18.53% |
| RUSHB | Rush Enterprises | | Services & Goods | 45.57 | 20 | -0.07% | -13.99% |
| ASRT | Assertio | | Health Care | 0.78 | 20 | -0.06% | -27.82% |
| FFIN | First Financial | | Financials | 28.64 | 20 | -0.03% | -5.48% |
| TEX | Terex | | Industrials | 60.20 | 18 | -0.85% | 4.76% |
| MCS | Marcus | | Services & Goods | 13.12 | 18 | 2.22% | -10.05% |
| SMBK | SmartFinancial | | Financials | 19.43 | 18 | 1.78% | -20.66% |
| AMPL | Amplitude | | Technology | 9.65 | 18 | 1.53% | -24.37% |
| JBSS | John B. | | Consumer Staples | 97.53 | 18 | 1.47% | -5.35% |
| SKT | Tanger Factory | | Financials | 26.84 | 18 | 1.36% | -3.17% |
| ONB | Old National | | Financials | 15.72 | 18 | 1.22% | -6.93% |
| PRDO | Perdoceo Education | | Services & Goods | 17.02 | 18 | 1.10% | -3.08% |
| HTH | Hilltop | | Financials | 28.95 | 18 | 1.06% | -17.79% |
| BBAI | BigBear.ai | | Technology | 1.58 | 18 | 0.96% | -26.06% |
| NABL | N-able | | Technology | 12.26 | 18 | 0.95% | -7.89% |
| UE | Urban Edge | | Financials | 16.15 | 18 | 0.84% | -11.78% |
| CDRE | Cadre | | Industrials | 33.37 | 18 | 0.82% | 1.21% |
| CFFN | Capitol Federal | | Financials | 5.16 | 18 | 0.78% | -20.00% |
| NATH | Nathan s | | Services & Goods | 65.25 | 18 | 0.77% | -16.36% |
| FISI | Financial Institutions | | Financials | 16.43 | 18 | 0.52% | -22.89% |
| SRCE | 1st Source | | Financials | 47.95 | 18 | 0.40% | -12.74% |


| Too many stocks? View smallcap stocks filtered by marketcap & sector |
| Marketcap: All SmallCap Stocks (default-no microcap), Large, Mid-Range, Small |
| Smallcap Sector: Tech, Finance, Energy, Staples, Retail, Industrial, Materials, & Medical |
|
Get the most comprehensive stock market coverage daily at 12Stocks.com ➞ Best Stocks Today ➞ Best Stocks Weekly ➞ Best Stocks Year-to-Date ➞ Best Stocks Trends ➞  Best Stocks Today 12Stocks.com Best Nasdaq Stocks ➞ Best S&P 500 Stocks ➞ Best Tech Stocks ➞ Best Biotech Stocks ➞ |
| Detailed Overview of SmallCap Stocks |
| SmallCap Technical Overview, Leaders & Laggards, Top SmallCap ETF Funds & Detailed SmallCap Stocks List, Charts, Trends & More |
| Smallcap: Technical Analysis, Trends & YTD Performance | |
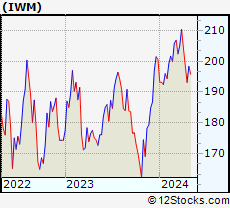
| SmallCap segment as represented by
IWM, an exchange-traded fund [ETF], holds basket of thousands of smallcap stocks from across all major sectors of the US stock market. The smallcap index (contains stocks like Riverbed & Sotheby's) is down by -3.99% and is currently underperforming the overall market by -8.02% year-to-date. Below is a quick view of technical charts and trends: | |
 IWM Weekly Chart |
|
| Long Term Trend: Good | |
| Medium Term Trend: Not Good | |
 IWM Daily Chart |
|
| Short Term Trend: Deteriorating | |
| Overall Trend Score: 44 | |
| YTD Performance: -3.99% | |
| **Trend Scores & Views Are Only For Educational Purposes And Not For Investing | |
| 12Stocks.com: Top Performing Small Cap Index Stocks | ||||||||||||||||||||||||||||||||||||||||||||||||
 The top performing Small Cap Index stocks year to date are
Now, more recently, over last week, the top performing Small Cap Index stocks on the move are


|
||||||||||||||||||||||||||||||||||||||||||||||||
| 12Stocks.com: Investing in Smallcap Index using Exchange Traded Funds | |
|
The following table shows list of key exchange traded funds (ETF) that
help investors track Smallcap index. The following list also includes leveraged ETF funds that track twice or thrice the daily returns of Smallcap indices. Short or inverse ETF funds move in the opposite direction to the index they track and are useful during market pullbacks or during bear markets. Quick View: Move mouse or cursor over ETF symbol (ticker) to view short-term technical chart and over ETF name to view long term chart. Click on ticker or stock name for detailed view. Click on to add stock symbol to your watchlist and to view watchlist. |
12Stocks.com List of ETFs that track Smallcap Index
| Ticker | ETF Name | Watchlist | Recent Price | Smart Investing & Trading Score | Change % | Week % | Year-to-date % |
| IWM | iShares Russell 2000 | | 192.71 | 44 | -0.15 | -3.01 | -3.99% |
| IJR | iShares Core S&P Small-Cap | | 102.18 | 38 | 0.05 | -2.23 | -5.61% |
| VTWO | Vanguard Russell 2000 ETF | | 77.90 | 23 | -0.19 | -3.01 | -3.95% |
| IWN | iShares Russell 2000 Value | | 146.15 | 10 | 0.08 | -2.81 | -5.91% |
| IWO | iShares Russell 2000 Growth | | 247.09 | 36 | -0.37 | -3.24 | -2.03% |
| IJS | iShares S&P Small-Cap 600 Value | | 94.40 | 10 | 0.30 | -1.84 | -8.41% |
| IJT | iShares S&P Small-Cap 600 Growth | | 122.58 | 23 | 0.61 | -1.76 | -2.05% |
| XSLV | PowerShares S&P SmallCap Low Volatil ETF | | 41.62 | 18 | 0.48 | -1.12 | -5.73% |
| SAA | ProShares Ultra SmallCap600 | | 21.71 | 10 | 0.25 | -3.75 | -12.97% |
| SMLV | SPDR SSGA US Small Cap Low Volatil ETF | | 104.02 | 18 | 0.34 | -0.95 | -7.56% |
| SBB | ProShares Short SmallCap600 | | 16.89 | 73 | 0.24 | 2.07 | 6.03% |
| SDD | ProShares UltraShort SmallCap600 | | 20.23 | 73 | -1.80 | 2.01 | 9.79% |
| 12Stocks.com: Charts, Trends, Fundamental Data and Performances of SmallCap Stocks | |
|
We now take in-depth look at all SmallCap stocks including charts, multi-period performances and overall trends (as measured by Smart Investing & Trading Score). One can sort SmallCap stocks (click link to choose) by Daily, Weekly and by Year-to-Date performances. Also, one can sort by size of the company or by market capitalization. |
| Select Your Default Chart Type: | |||||
| |||||
| Click on stock symbol or name for detailed view. Click on to add stock symbol to your watchlist and to view watchlist. Quick View: Move mouse or cursor over "Daily" to quickly view daily technical stock chart and over "Weekly" to view weekly technical stock chart. | |||||

 | PLUS ePlus inc. |
| Sector: Technology | |
| SubSector: Application Software | |
| MarketCap: 728.262 Millions | |
| Recent Price: 75.31 Smart Investing & Trading Score: 20 | |
| Day Percent Change: -0.15% Day Change: -0.12 | |
| Week Change: -2.28% Year-to-date Change: -5.7% | |
| PLUS Links: Profile News Message Board | |
| Charts:- Daily , Weekly | |
| Add PLUS to Watchlist: View: Get Complete PLUS Trend Analysis ➞ | |
 | BLFY Blue Foundry Bancorp |
| Sector: Financials | |
| SubSector: Banks - Regional | |
| MarketCap: 264 Millions | |
| Recent Price: 7.96 Smart Investing & Trading Score: 20 | |
| Day Percent Change: -0.13% Day Change: -0.01 | |
| Week Change: -6.24% Year-to-date Change: -17.3% | |
| BLFY Links: Profile News Message Board | |
| Charts:- Daily , Weekly | |
| Add BLFY to Watchlist: View: Get Complete BLFY Trend Analysis ➞ | |
 | INNV InnovAge Holding Corp. |
| Sector: Health Care | |
| SubSector: Medical Care Facilities | |
| MarketCap: 1010 Millions | |
| Recent Price: 4.05 Smart Investing & Trading Score: 20 | |
| Day Percent Change: -0.12% Day Change: 0.00 | |
| Week Change: 3.58% Year-to-date Change: -29.0% | |
| INNV Links: Profile News Message Board | |
| Charts:- Daily , Weekly | |
| Add INNV to Watchlist: View: Get Complete INNV Trend Analysis ➞ | |
 | NTLA Intellia Therapeutics, Inc. |
| Sector: Health Care | |
| SubSector: Biotechnology | |
| MarketCap: 707.185 Millions | |
| Recent Price: 21.48 Smart Investing & Trading Score: 20 | |
| Day Percent Change: -0.09% Day Change: -0.02 | |
| Week Change: -11.5% Year-to-date Change: -29.6% | |
| NTLA Links: Profile News Message Board | |
| Charts:- Daily , Weekly | |
| Add NTLA to Watchlist: View: Get Complete NTLA Trend Analysis ➞ | |
 | TDS Telephone and Data Systems, Inc. |
| Sector: Technology | |
| SubSector: Wireless Communications | |
| MarketCap: 1851.87 Millions | |
| Recent Price: 14.95 Smart Investing & Trading Score: 20 | |
| Day Percent Change: -0.07% Day Change: -0.01 | |
| Week Change: -4.47% Year-to-date Change: -18.5% | |
| TDS Links: Profile News Message Board | |
| Charts:- Daily , Weekly | |
| Add TDS to Watchlist: View: Get Complete TDS Trend Analysis ➞ | |
 | RUSHB Rush Enterprises, Inc. |
| Sector: Services & Goods | |
| SubSector: Auto Dealerships | |
| MarketCap: 203.221 Millions | |
| Recent Price: 45.57 Smart Investing & Trading Score: 20 | |
| Day Percent Change: -0.07% Day Change: -0.03 | |
| Week Change: -6.25% Year-to-date Change: -14.0% | |
| RUSHB Links: Profile News Message Board | |
| Charts:- Daily , Weekly | |
| Add RUSHB to Watchlist: View: Get Complete RUSHB Trend Analysis ➞ | |
 | ASRT Assertio Therapeutics, Inc. |
| Sector: Health Care | |
| SubSector: Drugs - Generic | |
| MarketCap: 65.8185 Millions | |
| Recent Price: 0.78 Smart Investing & Trading Score: 20 | |
| Day Percent Change: -0.06% Day Change: 0.00 | |
| Week Change: -10.22% Year-to-date Change: -27.8% | |
| ASRT Links: Profile News Message Board | |
| Charts:- Daily , Weekly | |
| Add ASRT to Watchlist: View: Get Complete ASRT Trend Analysis ➞ | |
 | FFIN First Financial Bankshares, Inc. |
| Sector: Financials | |
| SubSector: Regional - Southwest Banks | |
| MarketCap: 3503.75 Millions | |
| Recent Price: 28.64 Smart Investing & Trading Score: 20 | |
| Day Percent Change: -0.03% Day Change: -0.01 | |
| Week Change: -5.2% Year-to-date Change: -5.5% | |
| FFIN Links: Profile News Message Board | |
| Charts:- Daily , Weekly | |
| Add FFIN to Watchlist: View: Get Complete FFIN Trend Analysis ➞ | |
 | TEX Terex Corporation |
| Sector: Industrials | |
| SubSector: Farm & Construction Machinery | |
| MarketCap: 1083.07 Millions | |
| Recent Price: 60.20 Smart Investing & Trading Score: 18 | |
| Day Percent Change: -0.85% Day Change: -0.52 | |
| Week Change: -5.01% Year-to-date Change: 4.8% | |
| TEX Links: Profile News Message Board | |
| Charts:- Daily , Weekly | |
| Add TEX to Watchlist: View: Get Complete TEX Trend Analysis ➞ | |
 | MCS The Marcus Corporation |
| Sector: Services & Goods | |
| SubSector: Entertainment - Diversified | |
| MarketCap: 441.437 Millions | |
| Recent Price: 13.12 Smart Investing & Trading Score: 18 | |
| Day Percent Change: 2.22% Day Change: 0.29 | |
| Week Change: -0.04% Year-to-date Change: -10.1% | |
| MCS Links: Profile News Message Board | |
| Charts:- Daily , Weekly | |
| Add MCS to Watchlist: View: Get Complete MCS Trend Analysis ➞ | |
 | SMBK SmartFinancial, Inc. |
| Sector: Financials | |
| SubSector: Regional - Southeast Banks | |
| MarketCap: 174.035 Millions | |
| Recent Price: 19.43 Smart Investing & Trading Score: 18 | |
| Day Percent Change: 1.78% Day Change: 0.34 | |
| Week Change: 0.88% Year-to-date Change: -20.7% | |
| SMBK Links: Profile News Message Board | |
| Charts:- Daily , Weekly | |
| Add SMBK to Watchlist: View: Get Complete SMBK Trend Analysis ➞ | |
 | AMPL Amplitude, Inc. |
| Sector: Technology | |
| SubSector: Software - Application | |
| MarketCap: 1320 Millions | |
| Recent Price: 9.65 Smart Investing & Trading Score: 18 | |
| Day Percent Change: 1.53% Day Change: 0.14 | |
| Week Change: -5.02% Year-to-date Change: -24.4% | |
| AMPL Links: Profile News Message Board | |
| Charts:- Daily , Weekly | |
| Add AMPL to Watchlist: View: Get Complete AMPL Trend Analysis ➞ | |
 | JBSS John B. Sanfilippo & Son, Inc. |
| Sector: Consumer Staples | |
| SubSector: Processed & Packaged Goods | |
| MarketCap: 899.748 Millions | |
| Recent Price: 97.53 Smart Investing & Trading Score: 18 | |
| Day Percent Change: 1.47% Day Change: 1.41 | |
| Week Change: 0.18% Year-to-date Change: -5.4% | |
| JBSS Links: Profile News Message Board | |
| Charts:- Daily , Weekly | |
| Add JBSS to Watchlist: View: Get Complete JBSS Trend Analysis ➞ | |
 | SKT Tanger Factory Outlet Centers, Inc. |
| Sector: Financials | |
| SubSector: REIT - Retail | |
| MarketCap: 720.214 Millions | |
| Recent Price: 26.84 Smart Investing & Trading Score: 18 | |
| Day Percent Change: 1.36% Day Change: 0.36 | |
| Week Change: 0.3% Year-to-date Change: -3.2% | |
| SKT Links: Profile News Message Board | |
| Charts:- Daily , Weekly | |
| Add SKT to Watchlist: View: Get Complete SKT Trend Analysis ➞ | |
 | ONB Old National Bancorp |
| Sector: Financials | |
| SubSector: Regional - Midwest Banks | |
| MarketCap: 2340.8 Millions | |
| Recent Price: 15.72 Smart Investing & Trading Score: 18 | |
| Day Percent Change: 1.22% Day Change: 0.19 | |
| Week Change: -0.57% Year-to-date Change: -6.9% | |
| ONB Links: Profile News Message Board | |
| Charts:- Daily , Weekly | |
| Add ONB to Watchlist: View: Get Complete ONB Trend Analysis ➞ | |
 | PRDO Perdoceo Education Corporation |
| Sector: Services & Goods | |
| SubSector: Education & Training Services | |
| MarketCap: 631.006 Millions | |
| Recent Price: 17.02 Smart Investing & Trading Score: 18 | |
| Day Percent Change: 1.10% Day Change: 0.18 | |
| Week Change: -0.53% Year-to-date Change: -3.1% | |
| PRDO Links: Profile News Message Board | |
| Charts:- Daily , Weekly | |
| Add PRDO to Watchlist: View: Get Complete PRDO Trend Analysis ➞ | |
 | HTH Hilltop Holdings Inc. |
| Sector: Financials | |
| SubSector: Mortgage Investment | |
| MarketCap: 1317.89 Millions | |
| Recent Price: 28.95 Smart Investing & Trading Score: 18 | |
| Day Percent Change: 1.06% Day Change: 0.30 | |
| Week Change: -1.95% Year-to-date Change: -17.8% | |
| HTH Links: Profile News Message Board | |
| Charts:- Daily , Weekly | |
| Add HTH to Watchlist: View: Get Complete HTH Trend Analysis ➞ | |
 | BBAI BigBear.ai Holdings, Inc. |
| Sector: Technology | |
| SubSector: Information Technology Services | |
| MarketCap: 339 Millions | |
| Recent Price: 1.58 Smart Investing & Trading Score: 18 | |
| Day Percent Change: 0.96% Day Change: 0.01 | |
| Week Change: -10% Year-to-date Change: -26.1% | |
| BBAI Links: Profile News Message Board | |
| Charts:- Daily , Weekly | |
| Add BBAI to Watchlist: View: Get Complete BBAI Trend Analysis ➞ | |
 | NABL N-able, Inc. |
| Sector: Technology | |
| SubSector: Information Technology Services | |
| MarketCap: 2590 Millions | |
| Recent Price: 12.26 Smart Investing & Trading Score: 18 | |
| Day Percent Change: 0.95% Day Change: 0.12 | |
| Week Change: -2.43% Year-to-date Change: -7.9% | |
| NABL Links: Profile News Message Board | |
| Charts:- Daily , Weekly | |
| Add NABL to Watchlist: View: Get Complete NABL Trend Analysis ➞ | |
 | UE Urban Edge Properties |
| Sector: Financials | |
| SubSector: REIT - Diversified | |
| MarketCap: 1112.33 Millions | |
| Recent Price: 16.15 Smart Investing & Trading Score: 18 | |
| Day Percent Change: 0.84% Day Change: 0.13 | |
| Week Change: -0.83% Year-to-date Change: -11.8% | |
| UE Links: Profile News Message Board | |
| Charts:- Daily , Weekly | |
| Add UE to Watchlist: View: Get Complete UE Trend Analysis ➞ | |
 | CDRE Cadre Holdings, Inc. |
| Sector: Industrials | |
| SubSector: Aerospace & Defense | |
| MarketCap: 817 Millions | |
| Recent Price: 33.37 Smart Investing & Trading Score: 18 | |
| Day Percent Change: 0.82% Day Change: 0.27 | |
| Week Change: -0.63% Year-to-date Change: 1.2% | |
| CDRE Links: Profile News Message Board | |
| Charts:- Daily , Weekly | |
| Add CDRE to Watchlist: View: Get Complete CDRE Trend Analysis ➞ | |
 | CFFN Capitol Federal Financial, Inc. |
| Sector: Financials | |
| SubSector: Savings & Loans | |
| MarketCap: 1639.1 Millions | |
| Recent Price: 5.16 Smart Investing & Trading Score: 18 | |
| Day Percent Change: 0.78% Day Change: 0.04 | |
| Week Change: -2.46% Year-to-date Change: -20.0% | |
| CFFN Links: Profile News Message Board | |
| Charts:- Daily , Weekly | |
| Add CFFN to Watchlist: View: Get Complete CFFN Trend Analysis ➞ | |
 | NATH Nathan s Famous, Inc. |
| Sector: Services & Goods | |
| SubSector: Restaurants | |
| MarketCap: 211.77 Millions | |
| Recent Price: 65.25 Smart Investing & Trading Score: 18 | |
| Day Percent Change: 0.77% Day Change: 0.50 | |
| Week Change: -1.57% Year-to-date Change: -16.4% | |
| NATH Links: Profile News Message Board | |
| Charts:- Daily , Weekly | |
| Add NATH to Watchlist: View: Get Complete NATH Trend Analysis ➞ | |
 | FISI Financial Institutions, Inc. |
| Sector: Financials | |
| SubSector: Regional - Mid-Atlantic Banks | |
| MarketCap: 253.459 Millions | |
| Recent Price: 16.43 Smart Investing & Trading Score: 18 | |
| Day Percent Change: 0.52% Day Change: 0.09 | |
| Week Change: -2.7% Year-to-date Change: -22.9% | |
| FISI Links: Profile News Message Board | |
| Charts:- Daily , Weekly | |
| Add FISI to Watchlist: View: Get Complete FISI Trend Analysis ➞ | |
 | SRCE 1st Source Corporation |
| Sector: Financials | |
| SubSector: Regional - Midwest Banks | |
| MarketCap: 784.77 Millions | |
| Recent Price: 47.95 Smart Investing & Trading Score: 18 | |
| Day Percent Change: 0.40% Day Change: 0.19 | |
| Week Change: -0.7% Year-to-date Change: -12.7% | |
| SRCE Links: Profile News Message Board | |
| Charts:- Daily , Weekly | |
| Add SRCE to Watchlist: View: Get Complete SRCE Trend Analysis ➞ | |
| Too many stocks? View smallcap stocks filtered by marketcap & sector |
| Marketcap: All SmallCap Stocks (default-no microcap), Large, Mid-Range, Small & MicroCap |
| Sector: Tech, Finance, Energy, Staples, Retail, Industrial, Materials, Utilities & Medical |
|
Best Stocks Today 12Stocks.com |
© 2024 12Stocks.com Terms & Conditions Privacy Contact Us
All Information Provided Only For Education And Not To Be Used For Investing or Trading. See Terms & Conditions


One More Thing ... Get Best Stocks Delivered Daily!
Never Ever Miss A Move With Our Top Ten Stocks Lists
Find Best Stocks In Any Market - Bull or Bear Market
Take A Peek At Our Top Ten Stocks Lists: Daily, Weekly, Year-to-Date & Top Trends
Find Best Stocks In Any Market - Bull or Bear Market
Take A Peek At Our Top Ten Stocks Lists: Daily, Weekly, Year-to-Date & Top Trends
Smallcap Stocks With Best Up Trends [0-bearish to 100-bullish]: Badger Meter[100], Cullinan Oncology[100], Oscar Health[100], Apogee Enterprises[100], NextNav [100], Geron [100], Richardson Electronics[100], Seneca Foods[100], Lantheus [100], Macatawa Bank[100], Regional Management[100]
Best Smallcap Stocks Year-to-Date:
Agenus [511.18%], CareMax [417.53%], Janux [348.12%], Viking [248.9%], Alpine Immune[238.6%], Super Micro[230.42%], Arcutis Bio[203.72%], Longboard [184.12%], Vera [161.3%], Avidity Biosciences[159.18%], Hippo [128.32%] Best Smallcap Stocks This Week:
Macatawa Bank[44.47%], 23andMe Holding[33.3%], ProKidney [32%], Snap One[29.73%], Vertex Energy[23.08%], ALX Oncology[22.79%], Vanda [20.63%], Expensify [18.37%], Badger Meter[15.7%], Cullinan Oncology[13.89%], Humacyte [12.67%] Best Smallcap Stocks Daily:
23andMe Holding[65.91%], Vertex Energy[30.72%], Badger Meter[15.63%], Expensify [15.23%], Zura Bio[10.99%], Vaxxinity [10.05%], Vuzix [9.87%], Montrose Environmental[8.91%], Cipher Mining[8.65%], FiscalNote [8.61%], Barnes Group[8.48%]