
 Login Sign Up


| |||||
 |  | ||||

| 12Stocks.com Market Intelligence |
Best SmallCap Stocks
|
| In a hurry? Small Cap Stock Lists: Performance Trends Table, Stock Charts
Sort Small Cap stocks: Daily, Weekly, Year-to-Date, Market Cap & Trends. Filter Small Cap stocks list by sector: Show all, Tech, Finance, Energy, Staples, Retail, Industrial, Materials, Utilities and HealthCare Filter Small Cap stocks list by size: All Large Medium Small and MicroCap |
| 12Stocks.com Small Cap Stocks Performances & Trends Daily | |||||||||
|
|  The overall Smart Investing & Trading Score is 44 (0-bearish to 100-bullish) which puts Small Cap index in short term neutral trend. The Smart Investing & Trading Score from previous trading session is 58 and hence a deterioration of trend.
| ||||||||
Here are the Smart Investing & Trading Scores of the most requested small cap stocks at 12Stocks.com (click stock name for detailed review):
|


| 12Stocks.com: Investing in Smallcap Index with Stocks | |
|
The following table helps investors and traders sort through current performance and trends (as measured by Smart Investing & Trading Score) of various
stocks in the Smallcap Index. Quick View: Move mouse or cursor over stock symbol (ticker) to view short-term technical chart and over stock name to view long term chart. Click on  to add stock symbol to your watchlist and to add stock symbol to your watchlist and  to view watchlist. Click on any ticker or stock name for detailed market intelligence report for that stock. to view watchlist. Click on any ticker or stock name for detailed market intelligence report for that stock. |
12Stocks.com Performance of Stocks in Smallcap Index
| Ticker | Stock Name | Watchlist | Category | Recent Price | Smart Investing & Trading Score | Change % | YTD Change% |
| PJT | PJT Partners |   | Financials | 95.30 | 63 | -0.67% | -6.45% |
| SAH | Sonic Automotive | | Services & Goods | 56.67 | 62 | 10.86% | 0.82% |
| UNTY | Unity Bancorp | | Financials | 27.25 | 62 | -1.77% | -7.91% |
| LBPH | Longboard | | Health Care | 19.43 | 62 | -1.67% | 218.00% |
| CURV | Torrid | | Services & Goods | 4.92 | 62 | -1.60% | -15.90% |
| INFN | Infinera | | Technology | 4.97 | 62 | -0.20% | 4.63% |
| CASH | Meta Financial | | Financials | 52.92 | 62 | 3.58% | -0.02% |
| BMBL | Bumble | | Technology | 10.55 | 62 | 2.93% | -29.00% |
| SMMF | Summit Financial | | Financials | 27.41 | 62 | -1.12% | -10.69% |
| SG | Sweetgreen | | Services & Goods | 22.76 | 61 | 4.79% | 101.42% |
| CARA | Cara | | Health Care | 0.70 | 61 | 4.23% | -5.79% |
| MYRG | MYR Group | | Industrials | 166.06 | 61 | 0.89% | 14.82% |
| PRIM | Primoris Services | | Industrials | 45.41 | 61 | 0.89% | 36.74% |
| TDW | Tidewater | | Energy | 93.22 | 61 | 0.59% | 29.27% |
| CTRE | CareTrust REIT | | Financials | 23.95 | 61 | 0.59% | 7.02% |
| PBF | PBF Energy | | Energy | 57.50 | 61 | 0.56% | 30.80% |
| MTDR | Matador Resources | | Energy | 65.58 | 61 | 0.44% | 15.34% |
| BECN | Beacon Roofing | | Industrials | 97.56 | 61 | 0.36% | 12.11% |
| ERAS | Erasca | | Health Care | 1.88 | 61 | 0.00% | -11.74% |
| THRD | Third Harmonic | | Health Care | 10.42 | 61 | -8.27% | -5.40% |
| PEPG | PepGen | | Health Care | 11.03 | 61 | -5.73% | 61.26% |
| NVAX | Novavax | | Health Care | 3.95 | 61 | -4.82% | -17.71% |
| CODI | Compass Diversified | | Industrials | 22.33 | 61 | -3.83% | -0.53% |
| SWIM | Latham Group | | Industrials | 3.04 | 61 | -3.80% | 15.15% |
| MLYS | Mineralys | | Health Care | 11.04 | 61 | -3.71% | 26.61% |


| Too many stocks? View smallcap stocks filtered by marketcap & sector |
| Marketcap: All SmallCap Stocks (default-no microcap), Large, Mid-Range, Small |
| Smallcap Sector: Tech, Finance, Energy, Staples, Retail, Industrial, Materials, & Medical |
|
Get the most comprehensive stock market coverage daily at 12Stocks.com ➞ Best Stocks Today ➞ Best Stocks Weekly ➞ Best Stocks Year-to-Date ➞ Best Stocks Trends ➞  Best Stocks Today 12Stocks.com Best Nasdaq Stocks ➞ Best S&P 500 Stocks ➞ Best Tech Stocks ➞ Best Biotech Stocks ➞ |
| Detailed Overview of SmallCap Stocks |
| SmallCap Technical Overview, Leaders & Laggards, Top SmallCap ETF Funds & Detailed SmallCap Stocks List, Charts, Trends & More |
| Smallcap: Technical Analysis, Trends & YTD Performance | |
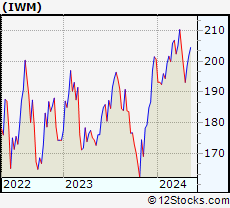
| SmallCap segment as represented by
IWM, an exchange-traded fund [ETF], holds basket of thousands of smallcap stocks from across all major sectors of the US stock market. The smallcap index (contains stocks like Riverbed & Sotheby's) is down by -2.11% and is currently underperforming the overall market by -7.27% year-to-date. Below is a quick view of technical charts and trends: | |
 IWM Weekly Chart |
|
| Long Term Trend: Good | |
| Medium Term Trend: Not Good | |
 IWM Daily Chart |
|
| Short Term Trend: Very Good | |
| Overall Trend Score: 44 | |
| YTD Performance: -2.11% | |
| **Trend Scores & Views Are Only For Educational Purposes And Not For Investing | |
| 12Stocks.com: Top Performing Small Cap Index Stocks | ||||||||||||||||||||||||||||||||||||||||||||||||
 The top performing Small Cap Index stocks year to date are
Now, more recently, over last week, the top performing Small Cap Index stocks on the move are


|
||||||||||||||||||||||||||||||||||||||||||||||||
| 12Stocks.com: Investing in Smallcap Index using Exchange Traded Funds | |
|
The following table shows list of key exchange traded funds (ETF) that
help investors track Smallcap index. The following list also includes leveraged ETF funds that track twice or thrice the daily returns of Smallcap indices. Short or inverse ETF funds move in the opposite direction to the index they track and are useful during market pullbacks or during bear markets. Quick View: Move mouse or cursor over ETF symbol (ticker) to view short-term technical chart and over ETF name to view long term chart. Click on ticker or stock name for detailed view. Click on to add stock symbol to your watchlist and to view watchlist. |
12Stocks.com List of ETFs that track Smallcap Index
| Ticker | ETF Name | Watchlist | Recent Price | Smart Investing & Trading Score | Change % | Week % | Year-to-date % |
| IWM | iShares Russell 2000 | | 196.48 | 44 | -0.61 | 1.73 | -2.11% |
| IJR | iShares Core S&P Small-Cap | | 104.86 | 78 | -0.80 | 1.59 | -3.13% |
| VTWO | Vanguard Russell 2000 ETF | | 79.45 | 63 | -0.60 | 1.75 | -2.03% |
| IWN | iShares Russell 2000 Value | | 150.18 | 68 | -0.73 | 1.62 | -3.32% |
| IWO | iShares Russell 2000 Growth | | 249.86 | 51 | -0.56 | 1.86 | -0.94% |
| IJS | iShares S&P Small-Cap 600 Value | | 96.69 | 60 | -1.04 | 1.13 | -6.19% |
| IJT | iShares S&P Small-Cap 600 Growth | | 125.06 | 63 | -0.25 | 2.33 | -0.06% |
| XSLV | PowerShares S&P SmallCap Low Volatil ETF | | 42.54 | 73 | -0.93 | 0.85 | -3.65% |
| SDD | ProShares UltraShort SmallCap600 | | 19.58 | 42 | 0.46 | -3.74 | 6.26% |
| SBB | ProShares Short SmallCap600 | | 16.50 | 40 | 0.79 | -2.02 | 3.58% |
| SMLV | SPDR SSGA US Small Cap Low Volatil ETF | | 107.33 | 73 | -1.01 | 1.17 | -4.61% |
| SAA | ProShares Ultra SmallCap600 | | 22.66 | 58 | -1.52 | 3.94 | -9.18% |
| 12Stocks.com: Charts, Trends, Fundamental Data and Performances of SmallCap Stocks | |
|
We now take in-depth look at all SmallCap stocks including charts, multi-period performances and overall trends (as measured by Smart Investing & Trading Score). One can sort SmallCap stocks (click link to choose) by Daily, Weekly and by Year-to-Date performances. Also, one can sort by size of the company or by market capitalization. |
| Select Your Default Chart Type: | |||||
| |||||
| Click on stock symbol or name for detailed view. Click on to add stock symbol to your watchlist and to view watchlist. Quick View: Move mouse or cursor over "Daily" to quickly view daily technical stock chart and over "Weekly" to view weekly technical stock chart. | |||||

 | PJT PJT Partners Inc. |
| Sector: Financials | |
| SubSector: Asset Management | |
| MarketCap: 1100.93 Millions | |
| Recent Price: 95.30 Smart Investing & Trading Score: 63 | |
| Day Percent Change: -0.67% Day Change: -0.64 | |
| Week Change: 3.86% Year-to-date Change: -6.5% | |
| PJT Links: Profile News Message Board | |
| Charts:- Daily , Weekly | |
| Add PJT to Watchlist: View: Get Complete PJT Trend Analysis ➞ | |
 | SAH Sonic Automotive, Inc. |
| Sector: Services & Goods | |
| SubSector: Auto Dealerships | |
| MarketCap: 581.321 Millions | |
| Recent Price: 56.67 Smart Investing & Trading Score: 62 | |
| Day Percent Change: 10.86% Day Change: 5.55 | |
| Week Change: 16.56% Year-to-date Change: 0.8% | |
| SAH Links: Profile News Message Board | |
| Charts:- Daily , Weekly | |
| Add SAH to Watchlist: View: Get Complete SAH Trend Analysis ➞ | |
 | UNTY Unity Bancorp, Inc. |
| Sector: Financials | |
| SubSector: Money Center Banks | |
| MarketCap: 149.099 Millions | |
| Recent Price: 27.25 Smart Investing & Trading Score: 62 | |
| Day Percent Change: -1.77% Day Change: -0.49 | |
| Week Change: 1.26% Year-to-date Change: -7.9% | |
| UNTY Links: Profile News Message Board | |
| Charts:- Daily , Weekly | |
| Add UNTY to Watchlist: View: Get Complete UNTY Trend Analysis ➞ | |
 | LBPH Longboard Pharmaceuticals, Inc. |
| Sector: Health Care | |
| SubSector: Biotechnology | |
| MarketCap: 169 Millions | |
| Recent Price: 19.43 Smart Investing & Trading Score: 62 | |
| Day Percent Change: -1.67% Day Change: -0.33 | |
| Week Change: 11.41% Year-to-date Change: 218.0% | |
| LBPH Links: Profile News Message Board | |
| Charts:- Daily , Weekly | |
| Add LBPH to Watchlist: View: Get Complete LBPH Trend Analysis ➞ | |
 | CURV Torrid Holdings Inc. |
| Sector: Services & Goods | |
| SubSector: Apparel Retail | |
| MarketCap: 278 Millions | |
| Recent Price: 4.92 Smart Investing & Trading Score: 62 | |
| Day Percent Change: -1.60% Day Change: -0.08 | |
| Week Change: 1.86% Year-to-date Change: -15.9% | |
| CURV Links: Profile News Message Board | |
| Charts:- Daily , Weekly | |
| Add CURV to Watchlist: View: Get Complete CURV Trend Analysis ➞ | |
 | INFN Infinera Corporation |
| Sector: Technology | |
| SubSector: Communication Equipment | |
| MarketCap: 943 Millions | |
| Recent Price: 4.97 Smart Investing & Trading Score: 62 | |
| Day Percent Change: -0.20% Day Change: -0.01 | |
| Week Change: 5.3% Year-to-date Change: 4.6% | |
| INFN Links: Profile News Message Board | |
| Charts:- Daily , Weekly | |
| Add INFN to Watchlist: View: Get Complete INFN Trend Analysis ➞ | |
 | CASH Meta Financial Group, Inc. |
| Sector: Financials | |
| SubSector: Savings & Loans | |
| MarketCap: 849.33 Millions | |
| Recent Price: 52.92 Smart Investing & Trading Score: 62 | |
| Day Percent Change: 3.58% Day Change: 1.83 | |
| Week Change: 5.02% Year-to-date Change: 0.0% | |
| CASH Links: Profile News Message Board | |
| Charts:- Daily , Weekly | |
| Add CASH to Watchlist: View: Get Complete CASH Trend Analysis ➞ | |
 | BMBL Bumble Inc. |
| Sector: Technology | |
| SubSector: Software - Application | |
| MarketCap: 2290 Millions | |
| Recent Price: 10.55 Smart Investing & Trading Score: 62 | |
| Day Percent Change: 2.93% Day Change: 0.30 | |
| Week Change: 3.63% Year-to-date Change: -29.0% | |
| BMBL Links: Profile News Message Board | |
| Charts:- Daily , Weekly | |
| Add BMBL to Watchlist: View: Get Complete BMBL Trend Analysis ➞ | |
 | SMMF Summit Financial Group, Inc. |
| Sector: Financials | |
| SubSector: Regional - Mid-Atlantic Banks | |
| MarketCap: 228.959 Millions | |
| Recent Price: 27.41 Smart Investing & Trading Score: 62 | |
| Day Percent Change: -1.12% Day Change: -0.31 | |
| Week Change: 0.77% Year-to-date Change: -10.7% | |
| SMMF Links: Profile News Message Board | |
| Charts:- Daily , Weekly | |
| Add SMMF to Watchlist: View: Get Complete SMMF Trend Analysis ➞ | |
 | SG Sweetgreen, Inc. |
| Sector: Services & Goods | |
| SubSector: Restaurants | |
| MarketCap: 1420 Millions | |
| Recent Price: 22.76 Smart Investing & Trading Score: 61 | |
| Day Percent Change: 4.79% Day Change: 1.04 | |
| Week Change: 10.22% Year-to-date Change: 101.4% | |
| SG Links: Profile News Message Board | |
| Charts:- Daily , Weekly | |
| Add SG to Watchlist: View: Get Complete SG Trend Analysis ➞ | |
 | CARA Cara Therapeutics, Inc. |
| Sector: Health Care | |
| SubSector: Biotechnology | |
| MarketCap: 597.985 Millions | |
| Recent Price: 0.70 Smart Investing & Trading Score: 61 | |
| Day Percent Change: 4.23% Day Change: 0.03 | |
| Week Change: 5.9% Year-to-date Change: -5.8% | |
| CARA Links: Profile News Message Board | |
| Charts:- Daily , Weekly | |
| Add CARA to Watchlist: View: Get Complete CARA Trend Analysis ➞ | |
 | MYRG MYR Group Inc. |
| Sector: Industrials | |
| SubSector: General Contractors | |
| MarketCap: 405.363 Millions | |
| Recent Price: 166.06 Smart Investing & Trading Score: 61 | |
| Day Percent Change: 0.89% Day Change: 1.46 | |
| Week Change: 4.63% Year-to-date Change: 14.8% | |
| MYRG Links: Profile News Message Board | |
| Charts:- Daily , Weekly | |
| Add MYRG to Watchlist: View: Get Complete MYRG Trend Analysis ➞ | |
 | PRIM Primoris Services Corporation |
| Sector: Industrials | |
| SubSector: Heavy Construction | |
| MarketCap: 931.895 Millions | |
| Recent Price: 45.41 Smart Investing & Trading Score: 61 | |
| Day Percent Change: 0.89% Day Change: 0.40 | |
| Week Change: 4.32% Year-to-date Change: 36.7% | |
| PRIM Links: Profile News Message Board | |
| Charts:- Daily , Weekly | |
| Add PRIM to Watchlist: View: Get Complete PRIM Trend Analysis ➞ | |
 | TDW Tidewater Inc. |
| Sector: Energy | |
| SubSector: Oil & Gas Equipment & Services | |
| MarketCap: 295.061 Millions | |
| Recent Price: 93.22 Smart Investing & Trading Score: 61 | |
| Day Percent Change: 0.59% Day Change: 0.55 | |
| Week Change: 4.14% Year-to-date Change: 29.3% | |
| TDW Links: Profile News Message Board | |
| Charts:- Daily , Weekly | |
| Add TDW to Watchlist: View: Get Complete TDW Trend Analysis ➞ | |
 | CTRE CareTrust REIT, Inc. |
| Sector: Financials | |
| SubSector: REIT - Healthcare Facilities | |
| MarketCap: 1507.94 Millions | |
| Recent Price: 23.95 Smart Investing & Trading Score: 61 | |
| Day Percent Change: 0.59% Day Change: 0.14 | |
| Week Change: 1.1% Year-to-date Change: 7.0% | |
| CTRE Links: Profile News Message Board | |
| Charts:- Daily , Weekly | |
| Add CTRE to Watchlist: View: Get Complete CTRE Trend Analysis ➞ | |
 | PBF PBF Energy Inc |
| Sector: Energy | |
| SubSector: Oil & Gas Refining & Marketing | |
| MarketCap: 1118.54 Millions | |
| Recent Price: 57.50 Smart Investing & Trading Score: 61 | |
| Day Percent Change: 0.56% Day Change: 0.32 | |
| Week Change: 2.83% Year-to-date Change: 30.8% | |
| PBF Links: Profile News Message Board | |
| Charts:- Daily , Weekly | |
| Add PBF to Watchlist: View: Get Complete PBF Trend Analysis ➞ | |
 | MTDR Matador Resources Company |
| Sector: Energy | |
| SubSector: Independent Oil & Gas | |
| MarketCap: 196.593 Millions | |
| Recent Price: 65.58 Smart Investing & Trading Score: 61 | |
| Day Percent Change: 0.44% Day Change: 0.29 | |
| Week Change: 1.5% Year-to-date Change: 15.3% | |
| MTDR Links: Profile News Message Board | |
| Charts:- Daily , Weekly | |
| Add MTDR to Watchlist: View: Get Complete MTDR Trend Analysis ➞ | |
 | BECN Beacon Roofing Supply, Inc. |
| Sector: Industrials | |
| SubSector: General Building Materials | |
| MarketCap: 1210.13 Millions | |
| Recent Price: 97.56 Smart Investing & Trading Score: 61 | |
| Day Percent Change: 0.36% Day Change: 0.35 | |
| Week Change: 3.17% Year-to-date Change: 12.1% | |
| BECN Links: Profile News Message Board | |
| Charts:- Daily , Weekly | |
| Add BECN to Watchlist: View: Get Complete BECN Trend Analysis ➞ | |
 | ERAS Erasca, Inc. |
| Sector: Health Care | |
| SubSector: Biotechnology | |
| MarketCap: 419 Millions | |
| Recent Price: 1.88 Smart Investing & Trading Score: 61 | |
| Day Percent Change: 0.00% Day Change: 0.00 | |
| Week Change: 5.03% Year-to-date Change: -11.7% | |
| ERAS Links: Profile News Message Board | |
| Charts:- Daily , Weekly | |
| Add ERAS to Watchlist: View: Get Complete ERAS Trend Analysis ➞ | |
 | THRD Third Harmonic Bio, Inc. |
| Sector: Health Care | |
| SubSector: Biotechnology | |
| MarketCap: 190 Millions | |
| Recent Price: 10.42 Smart Investing & Trading Score: 61 | |
| Day Percent Change: -8.27% Day Change: -0.94 | |
| Week Change: -10.79% Year-to-date Change: -5.4% | |
| THRD Links: Profile News Message Board | |
| Charts:- Daily , Weekly | |
| Add THRD to Watchlist: View: Get Complete THRD Trend Analysis ➞ | |
 | PEPG PepGen Inc. |
| Sector: Health Care | |
| SubSector: Biotechnology | |
| MarketCap: 216 Millions | |
| Recent Price: 11.03 Smart Investing & Trading Score: 61 | |
| Day Percent Change: -5.73% Day Change: -0.67 | |
| Week Change: 4.7% Year-to-date Change: 61.3% | |
| PEPG Links: Profile News Message Board | |
| Charts:- Daily , Weekly | |
| Add PEPG to Watchlist: View: Get Complete PEPG Trend Analysis ➞ | |
 | NVAX Novavax, Inc. |
| Sector: Health Care | |
| SubSector: Biotechnology | |
| MarketCap: 376.185 Millions | |
| Recent Price: 3.95 Smart Investing & Trading Score: 61 | |
| Day Percent Change: -4.82% Day Change: -0.20 | |
| Week Change: -0.5% Year-to-date Change: -17.7% | |
| NVAX Links: Profile News Message Board | |
| Charts:- Daily , Weekly | |
| Add NVAX to Watchlist: View: Get Complete NVAX Trend Analysis ➞ | |
 | CODI Compass Diversified Holdings LLC |
| Sector: Industrials | |
| SubSector: Conglomerates | |
| MarketCap: 803.348 Millions | |
| Recent Price: 22.33 Smart Investing & Trading Score: 61 | |
| Day Percent Change: -3.83% Day Change: -0.89 | |
| Week Change: -2.1% Year-to-date Change: -0.5% | |
| CODI Links: Profile News Message Board | |
| Charts:- Daily , Weekly | |
| Add CODI to Watchlist: View: Get Complete CODI Trend Analysis ➞ | |
 | SWIM Latham Group, Inc. |
| Sector: Industrials | |
| SubSector: Building Products & Equipment | |
| MarketCap: 388 Millions | |
| Recent Price: 3.04 Smart Investing & Trading Score: 61 | |
| Day Percent Change: -3.80% Day Change: -0.12 | |
| Week Change: -0.98% Year-to-date Change: 15.2% | |
| SWIM Links: Profile News Message Board | |
| Charts:- Daily , Weekly | |
| Add SWIM to Watchlist: View: Get Complete SWIM Trend Analysis ➞ | |
 | MLYS Mineralys Therapeutics, Inc. |
| Sector: Health Care | |
| SubSector: Biotechnology | |
| MarketCap: 719 Millions | |
| Recent Price: 11.04 Smart Investing & Trading Score: 61 | |
| Day Percent Change: -3.71% Day Change: -0.43 | |
| Week Change: -2.21% Year-to-date Change: 26.6% | |
| MLYS Links: Profile News Message Board | |
| Charts:- Daily , Weekly | |
| Add MLYS to Watchlist: View: Get Complete MLYS Trend Analysis ➞ | |
| Too many stocks? View smallcap stocks filtered by marketcap & sector |
| Marketcap: All SmallCap Stocks (default-no microcap), Large, Mid-Range, Small & MicroCap |
| Sector: Tech, Finance, Energy, Staples, Retail, Industrial, Materials, Utilities & Medical |
|
Best Stocks Today 12Stocks.com |
© 2024 12Stocks.com Terms & Conditions Privacy Contact Us
All Information Provided Only For Education And Not To Be Used For Investing or Trading. See Terms & Conditions


One More Thing ... Get Best Stocks Delivered Daily!
Never Ever Miss A Move With Our Top Ten Stocks Lists
Find Best Stocks In Any Market - Bull or Bear Market
Take A Peek At Our Top Ten Stocks Lists: Daily, Weekly, Year-to-Date & Top Trends
Find Best Stocks In Any Market - Bull or Bear Market
Take A Peek At Our Top Ten Stocks Lists: Daily, Weekly, Year-to-Date & Top Trends
Smallcap Stocks With Best Up Trends [0-bearish to 100-bullish]: B. Riley[100], Central Pacific[100], California Water[100], Cricut [100], Carpenter [100], Haemonetics [100], Sanmina [100], Trustmark [100], Comstock Resources[100], EchoStar [100], Mueller Industries[100]
Best Smallcap Stocks Year-to-Date:
CareMax [490.72%], Janux [338.34%], Viking [270.02%], Alpine Immune[239.52%], Longboard [218%], Super Micro[177%], Arcutis Bio[166.56%], Avidity Biosciences[159.79%], Vera [149.94%], Hippo [128.87%], Stoke [122.15%] Best Smallcap Stocks This Week:
Matterport [168.97%], B. Riley[73.54%], Impinj [33.73%], ProKidney [32.84%], Seres [32.65%], Riot Blockchain[32.64%], Ribbon [25.58%], Cullinan Oncology[22.92%], P.A.M. Transportation[22.85%], NuScale Power[21.44%], Hibbett Sports[21.03%] Best Smallcap Stocks Daily:
Impinj [28.65%], P.A.M. Transportation[17.95%], B. Riley[16.61%], Strategic Education[16.28%], OptiNose [14.56%], JELD-WEN Holding[11.54%], Sonic Automotive[10.86%], Intevac [10.54%], SiTime [8.84%], Noodles & [8.08%], ProKidney [7.75%]