
 Login Sign Up


| |||||
 |  | ||||

| 12Stocks.com Market Intelligence |
Best SmallCap Stocks
|
| In a hurry? Small Cap Stock Lists: Performance Trends Table, Stock Charts
Sort Small Cap stocks: Daily, Weekly, Year-to-Date, Market Cap & Trends. Filter Small Cap stocks list by sector: Show all, Tech, Finance, Energy, Staples, Retail, Industrial, Materials, Utilities and HealthCare Filter Small Cap stocks list by size: All Large Medium Small and MicroCap |
| 12Stocks.com Small Cap Stocks Performances & Trends Daily | |||||||||
|
|  The overall Smart Investing & Trading Score is 44 (0-bearish to 100-bullish) which puts Small Cap index in short term neutral trend. The Smart Investing & Trading Score from previous trading session is 58 and hence a deterioration of trend.
| ||||||||
Here are the Smart Investing & Trading Scores of the most requested small cap stocks at 12Stocks.com (click stock name for detailed review):
|


| 12Stocks.com: Investing in Smallcap Index with Stocks | |
|
The following table helps investors and traders sort through current performance and trends (as measured by Smart Investing & Trading Score) of various
stocks in the Smallcap Index. Quick View: Move mouse or cursor over stock symbol (ticker) to view short-term technical chart and over stock name to view long term chart. Click on  to add stock symbol to your watchlist and to add stock symbol to your watchlist and  to view watchlist. Click on any ticker or stock name for detailed market intelligence report for that stock. to view watchlist. Click on any ticker or stock name for detailed market intelligence report for that stock. |
12Stocks.com Performance of Stocks in Smallcap Index
| Ticker | Stock Name | Watchlist | Category | Recent Price | Smart Investing & Trading Score | Change % | YTD Change% |
| FTCI | FTC Solar |   | Technology | 0.40 | 40 | -11.79% | -41.78% |
| ZIMV | ZimVie | | Health Care | 15.48 | 40 | -1.84% | -12.64% |
| SPCE | Virgin Galactic | | Industrials | 0.86 | 40 | -1.09% | -64.88% |
| ONTF | ON24 | | Technology | 6.66 | 40 | -0.89% | -15.54% |
| PAR | PAR | | Technology | 41.76 | 40 | -0.57% | -4.09% |
| INSW | Seaways | | Services & Goods | 54.58 | 40 | 1.87% | 20.01% |
| BOH | Bank of Hawaii | | Financials | 59.11 | 40 | 0.75% | -18.42% |
| EVCM | EverCommerce | | Technology | 9.18 | 40 | -2.91% | -17.48% |
| HBCP | Home Bancorp | | Financials | 35.50 | 40 | -2.69% | -15.50% |
| FISI | Financial Institutions | | Financials | 17.42 | 40 | -1.97% | -18.22% |
| AROW | Arrow Financial | | Financials | 22.67 | 40 | -1.31% | -18.86% |
| ENR | Energizer | | Consumer Staples | 28.40 | 40 | -1.15% | -10.35% |
| MSBI | Midland States | | Financials | 24.05 | 40 | -1.15% | -12.74% |
| GNE | Genie Energy | | Energy | 15.70 | 40 | -0.88% | -44.19% |
| MTH | Meritage Homes | | Industrials | 165.07 | 39 | 6.71% | -5.24% |
| PMT | PennyMac Mortgage | | Financials | 14.14 | 39 | 3.06% | -5.42% |
| ASC | Ardmore Shipping | | Transports | 16.62 | 39 | 1.53% | 17.96% |
| MOND | Mondee | | Services & Goods | 2.14 | 39 | 0.47% | -23.02% |
| ARCB | ArcBest | | Transports | 138.08 | 39 | 0.79% | 14.87% |
| HQY | HealthEquity | | Technology | 79.04 | 39 | -0.20% | 19.22% |
| IIIN | Insteel Industries | | Materials | 31.73 | 38 | -7.00% | -17.13% |
| TRVI | Trevi | | Health Care | 2.53 | 38 | -5.60% | 88.81% |
| KIND | Nextdoor | | Services & Goods | 2.00 | 38 | -5.44% | 8.11% |
| DSP | Viant | | Technology | 8.30 | 38 | -3.15% | 19.60% |
| KAI | Kadant | | Industrials | 279.58 | 38 | -2.21% | -0.26% |


| Too many stocks? View smallcap stocks filtered by marketcap & sector |
| Marketcap: All SmallCap Stocks (default-no microcap), Large, Mid-Range, Small |
| Smallcap Sector: Tech, Finance, Energy, Staples, Retail, Industrial, Materials, & Medical |
|
Get the most comprehensive stock market coverage daily at 12Stocks.com ➞ Best Stocks Today ➞ Best Stocks Weekly ➞ Best Stocks Year-to-Date ➞ Best Stocks Trends ➞  Best Stocks Today 12Stocks.com Best Nasdaq Stocks ➞ Best S&P 500 Stocks ➞ Best Tech Stocks ➞ Best Biotech Stocks ➞ |
| Detailed Overview of SmallCap Stocks |
| SmallCap Technical Overview, Leaders & Laggards, Top SmallCap ETF Funds & Detailed SmallCap Stocks List, Charts, Trends & More |
| Smallcap: Technical Analysis, Trends & YTD Performance | |
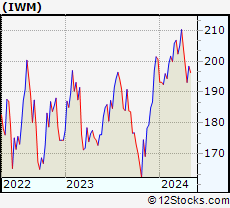
| SmallCap segment as represented by
IWM, an exchange-traded fund [ETF], holds basket of thousands of smallcap stocks from across all major sectors of the US stock market. The smallcap index (contains stocks like Riverbed & Sotheby's) is down by -2.11% and is currently underperforming the overall market by -7.27% year-to-date. Below is a quick view of technical charts and trends: | |
 IWM Weekly Chart |
|
| Long Term Trend: Good | |
| Medium Term Trend: Not Good | |
 IWM Daily Chart |
|
| Short Term Trend: Very Good | |
| Overall Trend Score: 44 | |
| YTD Performance: -2.11% | |
| **Trend Scores & Views Are Only For Educational Purposes And Not For Investing | |
| 12Stocks.com: Top Performing Small Cap Index Stocks | ||||||||||||||||||||||||||||||||||||||||||||||||
 The top performing Small Cap Index stocks year to date are
Now, more recently, over last week, the top performing Small Cap Index stocks on the move are


|
||||||||||||||||||||||||||||||||||||||||||||||||
| 12Stocks.com: Investing in Smallcap Index using Exchange Traded Funds | |
|
The following table shows list of key exchange traded funds (ETF) that
help investors track Smallcap index. The following list also includes leveraged ETF funds that track twice or thrice the daily returns of Smallcap indices. Short or inverse ETF funds move in the opposite direction to the index they track and are useful during market pullbacks or during bear markets. Quick View: Move mouse or cursor over ETF symbol (ticker) to view short-term technical chart and over ETF name to view long term chart. Click on ticker or stock name for detailed view. Click on to add stock symbol to your watchlist and to view watchlist. |
12Stocks.com List of ETFs that track Smallcap Index
| Ticker | ETF Name | Watchlist | Recent Price | Smart Investing & Trading Score | Change % | Week % | Year-to-date % |
| IWM | iShares Russell 2000 | | 196.48 | 44 | -0.61 | 1.73 | -2.11% |
| IJR | iShares Core S&P Small-Cap | | 104.86 | 78 | -0.80 | 1.59 | -3.13% |
| VTWO | Vanguard Russell 2000 ETF | | 79.45 | 63 | -0.60 | 1.75 | -2.03% |
| IWN | iShares Russell 2000 Value | | 150.18 | 68 | -0.73 | 1.62 | -3.32% |
| IWO | iShares Russell 2000 Growth | | 249.86 | 51 | -0.56 | 1.86 | -0.94% |
| IJS | iShares S&P Small-Cap 600 Value | | 96.69 | 60 | -1.04 | 1.13 | -6.19% |
| IJT | iShares S&P Small-Cap 600 Growth | | 125.06 | 63 | -0.25 | 2.33 | -0.06% |
| XSLV | PowerShares S&P SmallCap Low Volatil ETF | | 42.54 | 73 | -0.93 | 0.85 | -3.65% |
| SDD | ProShares UltraShort SmallCap600 | | 19.58 | 42 | 0.46 | -3.74 | 6.26% |
| SBB | ProShares Short SmallCap600 | | 16.50 | 40 | 0.79 | -2.02 | 3.58% |
| SMLV | SPDR SSGA US Small Cap Low Volatil ETF | | 107.33 | 73 | -1.01 | 1.17 | -4.61% |
| SAA | ProShares Ultra SmallCap600 | | 22.66 | 58 | -1.52 | 3.94 | -9.18% |
| 12Stocks.com: Charts, Trends, Fundamental Data and Performances of SmallCap Stocks | |
|
We now take in-depth look at all SmallCap stocks including charts, multi-period performances and overall trends (as measured by Smart Investing & Trading Score). One can sort SmallCap stocks (click link to choose) by Daily, Weekly and by Year-to-Date performances. Also, one can sort by size of the company or by market capitalization. |
| Select Your Default Chart Type: | |||||
| |||||
| Click on stock symbol or name for detailed view. Click on to add stock symbol to your watchlist and to view watchlist. Quick View: Move mouse or cursor over "Daily" to quickly view daily technical stock chart and over "Weekly" to view weekly technical stock chart. | |||||

 | FTCI FTC Solar, Inc. |
| Sector: Technology | |
| SubSector: Solar | |
| MarketCap: 345 Millions | |
| Recent Price: 0.40 Smart Investing & Trading Score: 40 | |
| Day Percent Change: -11.79% Day Change: -0.05 | |
| Week Change: 2.82% Year-to-date Change: -41.8% | |
| FTCI Links: Profile News Message Board | |
| Charts:- Daily , Weekly | |
| Add FTCI to Watchlist: View: Get Complete FTCI Trend Analysis ➞ | |
 | ZIMV ZimVie Inc. |
| Sector: Health Care | |
| SubSector: Medical Devices | |
| MarketCap: 303 Millions | |
| Recent Price: 15.48 Smart Investing & Trading Score: 40 | |
| Day Percent Change: -1.84% Day Change: -0.29 | |
| Week Change: 0.32% Year-to-date Change: -12.6% | |
| ZIMV Links: Profile News Message Board | |
| Charts:- Daily , Weekly | |
| Add ZIMV to Watchlist: View: Get Complete ZIMV Trend Analysis ➞ | |
 | SPCE Virgin Galactic Holdings, Inc. |
| Sector: Industrials | |
| SubSector: Conglomerates | |
| MarketCap: 2612.48 Millions | |
| Recent Price: 0.86 Smart Investing & Trading Score: 40 | |
| Day Percent Change: -1.09% Day Change: -0.01 | |
| Week Change: 0.5% Year-to-date Change: -64.9% | |
| SPCE Links: Profile News Message Board | |
| Charts:- Daily , Weekly | |
| Add SPCE to Watchlist: View: Get Complete SPCE Trend Analysis ➞ | |
 | ONTF ON24, Inc. |
| Sector: Technology | |
| SubSector: Software - Application | |
| MarketCap: 386 Millions | |
| Recent Price: 6.66 Smart Investing & Trading Score: 40 | |
| Day Percent Change: -0.89% Day Change: -0.06 | |
| Week Change: 0.45% Year-to-date Change: -15.5% | |
| ONTF Links: Profile News Message Board | |
| Charts:- Daily , Weekly | |
| Add ONTF to Watchlist: View: Get Complete ONTF Trend Analysis ➞ | |
 | PAR PAR Technology Corporation |
| Sector: Technology | |
| SubSector: Application Software | |
| MarketCap: 255.862 Millions | |
| Recent Price: 41.76 Smart Investing & Trading Score: 40 | |
| Day Percent Change: -0.57% Day Change: -0.24 | |
| Week Change: 4.17% Year-to-date Change: -4.1% | |
| PAR Links: Profile News Message Board | |
| Charts:- Daily , Weekly | |
| Add PAR to Watchlist: View: Get Complete PAR Trend Analysis ➞ | |
 | INSW International Seaways, Inc. |
| Sector: Services & Goods | |
| SubSector: Business Services | |
| MarketCap: 521.582 Millions | |
| Recent Price: 54.58 Smart Investing & Trading Score: 40 | |
| Day Percent Change: 1.87% Day Change: 1.00 | |
| Week Change: 2.92% Year-to-date Change: 20.0% | |
| INSW Links: Profile News Message Board | |
| Charts:- Daily , Weekly | |
| Add INSW to Watchlist: View: Get Complete INSW Trend Analysis ➞ | |
 | BOH Bank of Hawaii Corporation |
| Sector: Financials | |
| SubSector: Regional - Pacific Banks | |
| MarketCap: 2305.19 Millions | |
| Recent Price: 59.11 Smart Investing & Trading Score: 40 | |
| Day Percent Change: 0.75% Day Change: 0.44 | |
| Week Change: 1.22% Year-to-date Change: -18.4% | |
| BOH Links: Profile News Message Board | |
| Charts:- Daily , Weekly | |
| Add BOH to Watchlist: View: Get Complete BOH Trend Analysis ➞ | |
 | EVCM EverCommerce Inc. |
| Sector: Technology | |
| SubSector: Software - Infrastructure | |
| MarketCap: 2210 Millions | |
| Recent Price: 9.18 Smart Investing & Trading Score: 40 | |
| Day Percent Change: -2.91% Day Change: -0.28 | |
| Week Change: 3.96% Year-to-date Change: -17.5% | |
| EVCM Links: Profile News Message Board | |
| Charts:- Daily , Weekly | |
| Add EVCM to Watchlist: View: Get Complete EVCM Trend Analysis ➞ | |
 | HBCP Home Bancorp, Inc. |
| Sector: Financials | |
| SubSector: Savings & Loans | |
| MarketCap: 206.83 Millions | |
| Recent Price: 35.50 Smart Investing & Trading Score: 40 | |
| Day Percent Change: -2.69% Day Change: -0.98 | |
| Week Change: -1.63% Year-to-date Change: -15.5% | |
| HBCP Links: Profile News Message Board | |
| Charts:- Daily , Weekly | |
| Add HBCP to Watchlist: View: Get Complete HBCP Trend Analysis ➞ | |
 | FISI Financial Institutions, Inc. |
| Sector: Financials | |
| SubSector: Regional - Mid-Atlantic Banks | |
| MarketCap: 253.459 Millions | |
| Recent Price: 17.42 Smart Investing & Trading Score: 40 | |
| Day Percent Change: -1.97% Day Change: -0.35 | |
| Week Change: 0.35% Year-to-date Change: -18.2% | |
| FISI Links: Profile News Message Board | |
| Charts:- Daily , Weekly | |
| Add FISI to Watchlist: View: Get Complete FISI Trend Analysis ➞ | |
 | AROW Arrow Financial Corporation |
| Sector: Financials | |
| SubSector: Regional - Northeast Banks | |
| MarketCap: 413.999 Millions | |
| Recent Price: 22.67 Smart Investing & Trading Score: 40 | |
| Day Percent Change: -1.31% Day Change: -0.30 | |
| Week Change: -0.53% Year-to-date Change: -18.9% | |
| AROW Links: Profile News Message Board | |
| Charts:- Daily , Weekly | |
| Add AROW to Watchlist: View: Get Complete AROW Trend Analysis ➞ | |
 | ENR Energizer Holdings, Inc. |
| Sector: Consumer Staples | |
| SubSector: Personal Products | |
| MarketCap: 2469.55 Millions | |
| Recent Price: 28.40 Smart Investing & Trading Score: 40 | |
| Day Percent Change: -1.15% Day Change: -0.33 | |
| Week Change: -0.04% Year-to-date Change: -10.4% | |
| ENR Links: Profile News Message Board | |
| Charts:- Daily , Weekly | |
| Add ENR to Watchlist: View: Get Complete ENR Trend Analysis ➞ | |
 | MSBI Midland States Bancorp, Inc. |
| Sector: Financials | |
| SubSector: Regional - Midwest Banks | |
| MarketCap: 400.27 Millions | |
| Recent Price: 24.05 Smart Investing & Trading Score: 40 | |
| Day Percent Change: -1.15% Day Change: -0.28 | |
| Week Change: 1.43% Year-to-date Change: -12.7% | |
| MSBI Links: Profile News Message Board | |
| Charts:- Daily , Weekly | |
| Add MSBI to Watchlist: View: Get Complete MSBI Trend Analysis ➞ | |
 | GNE Genie Energy Ltd. |
| Sector: Energy | |
| SubSector: Independent Oil & Gas | |
| MarketCap: 177.293 Millions | |
| Recent Price: 15.70 Smart Investing & Trading Score: 40 | |
| Day Percent Change: -0.88% Day Change: -0.14 | |
| Week Change: -1.26% Year-to-date Change: -44.2% | |
| GNE Links: Profile News Message Board | |
| Charts:- Daily , Weekly | |
| Add GNE to Watchlist: View: Get Complete GNE Trend Analysis ➞ | |
 | MTH Meritage Homes Corporation |
| Sector: Industrials | |
| SubSector: Residential Construction | |
| MarketCap: 1440.36 Millions | |
| Recent Price: 165.07 Smart Investing & Trading Score: 39 | |
| Day Percent Change: 6.71% Day Change: 10.38 | |
| Week Change: 9.73% Year-to-date Change: -5.2% | |
| MTH Links: Profile News Message Board | |
| Charts:- Daily , Weekly | |
| Add MTH to Watchlist: View: Get Complete MTH Trend Analysis ➞ | |
 | PMT PennyMac Mortgage Investment Trust |
| Sector: Financials | |
| SubSector: Mortgage Investment | |
| MarketCap: 917.639 Millions | |
| Recent Price: 14.14 Smart Investing & Trading Score: 39 | |
| Day Percent Change: 3.06% Day Change: 0.42 | |
| Week Change: 4.28% Year-to-date Change: -5.4% | |
| PMT Links: Profile News Message Board | |
| Charts:- Daily , Weekly | |
| Add PMT to Watchlist: View: Get Complete PMT Trend Analysis ➞ | |
 | ASC Ardmore Shipping Corporation |
| Sector: Transports | |
| SubSector: Shipping | |
| MarketCap: 147.014 Millions | |
| Recent Price: 16.62 Smart Investing & Trading Score: 39 | |
| Day Percent Change: 1.53% Day Change: 0.25 | |
| Week Change: 4.66% Year-to-date Change: 18.0% | |
| ASC Links: Profile News Message Board | |
| Charts:- Daily , Weekly | |
| Add ASC to Watchlist: View: Get Complete ASC Trend Analysis ➞ | |
 | MOND Mondee Holdings, Inc. |
| Sector: Services & Goods | |
| SubSector: Travel Services | |
| MarketCap: 744 Millions | |
| Recent Price: 2.14 Smart Investing & Trading Score: 39 | |
| Day Percent Change: 0.47% Day Change: 0.01 | |
| Week Change: -2.28% Year-to-date Change: -23.0% | |
| MOND Links: Profile News Message Board | |
| Charts:- Daily , Weekly | |
| Add MOND to Watchlist: View: Get Complete MOND Trend Analysis ➞ | |
 | ARCB ArcBest Corporation |
| Sector: Transports | |
| SubSector: Trucking | |
| MarketCap: 515.415 Millions | |
| Recent Price: 138.08 Smart Investing & Trading Score: 39 | |
| Day Percent Change: 0.79% Day Change: 1.08 | |
| Week Change: 0.04% Year-to-date Change: 14.9% | |
| ARCB Links: Profile News Message Board | |
| Charts:- Daily , Weekly | |
| Add ARCB to Watchlist: View: Get Complete ARCB Trend Analysis ➞ | |
 | HQY HealthEquity, Inc. |
| Sector: Technology | |
| SubSector: Healthcare Information Services | |
| MarketCap: 3369.75 Millions | |
| Recent Price: 79.04 Smart Investing & Trading Score: 39 | |
| Day Percent Change: -0.20% Day Change: -0.16 | |
| Week Change: -2.29% Year-to-date Change: 19.2% | |
| HQY Links: Profile News Message Board | |
| Charts:- Daily , Weekly | |
| Add HQY to Watchlist: View: Get Complete HQY Trend Analysis ➞ | |
 | IIIN Insteel Industries, Inc. |
| Sector: Materials | |
| SubSector: Steel & Iron | |
| MarketCap: 269.488 Millions | |
| Recent Price: 31.73 Smart Investing & Trading Score: 38 | |
| Day Percent Change: -7.00% Day Change: -2.39 | |
| Week Change: -5.42% Year-to-date Change: -17.1% | |
| IIIN Links: Profile News Message Board | |
| Charts:- Daily , Weekly | |
| Add IIIN to Watchlist: View: Get Complete IIIN Trend Analysis ➞ | |
 | TRVI Trevi Therapeutics, Inc. |
| Sector: Health Care | |
| SubSector: Biotechnology | |
| MarketCap: 50.6785 Millions | |
| Recent Price: 2.53 Smart Investing & Trading Score: 38 | |
| Day Percent Change: -5.60% Day Change: -0.15 | |
| Week Change: -10.28% Year-to-date Change: 88.8% | |
| TRVI Links: Profile News Message Board | |
| Charts:- Daily , Weekly | |
| Add TRVI to Watchlist: View: Get Complete TRVI Trend Analysis ➞ | |
 | KIND Nextdoor Holdings, Inc. |
| Sector: Services & Goods | |
| SubSector: Internet Content & Information | |
| MarketCap: 1170 Millions | |
| Recent Price: 2.00 Smart Investing & Trading Score: 38 | |
| Day Percent Change: -5.44% Day Change: -0.12 | |
| Week Change: 1.01% Year-to-date Change: 8.1% | |
| KIND Links: Profile News Message Board | |
| Charts:- Daily , Weekly | |
| Add KIND to Watchlist: View: Get Complete KIND Trend Analysis ➞ | |
 | DSP Viant Technology Inc. |
| Sector: Technology | |
| SubSector: Software - Application | |
| MarketCap: 279 Millions | |
| Recent Price: 8.30 Smart Investing & Trading Score: 38 | |
| Day Percent Change: -3.15% Day Change: -0.27 | |
| Week Change: -2.35% Year-to-date Change: 19.6% | |
| DSP Links: Profile News Message Board | |
| Charts:- Daily , Weekly | |
| Add DSP to Watchlist: View: Get Complete DSP Trend Analysis ➞ | |
 | KAI Kadant Inc. |
| Sector: Industrials | |
| SubSector: Diversified Machinery | |
| MarketCap: 787.116 Millions | |
| Recent Price: 279.58 Smart Investing & Trading Score: 38 | |
| Day Percent Change: -2.21% Day Change: -6.31 | |
| Week Change: -0.85% Year-to-date Change: -0.3% | |
| KAI Links: Profile News Message Board | |
| Charts:- Daily , Weekly | |
| Add KAI to Watchlist: View: Get Complete KAI Trend Analysis ➞ | |
| Too many stocks? View smallcap stocks filtered by marketcap & sector |
| Marketcap: All SmallCap Stocks (default-no microcap), Large, Mid-Range, Small & MicroCap |
| Sector: Tech, Finance, Energy, Staples, Retail, Industrial, Materials, Utilities & Medical |
|
Best Stocks Today 12Stocks.com |
© 2024 12Stocks.com Terms & Conditions Privacy Contact Us
All Information Provided Only For Education And Not To Be Used For Investing or Trading. See Terms & Conditions


One More Thing ... Get Best Stocks Delivered Daily!
Never Ever Miss A Move With Our Top Ten Stocks Lists
Find Best Stocks In Any Market - Bull or Bear Market
Take A Peek At Our Top Ten Stocks Lists: Daily, Weekly, Year-to-Date & Top Trends
Find Best Stocks In Any Market - Bull or Bear Market
Take A Peek At Our Top Ten Stocks Lists: Daily, Weekly, Year-to-Date & Top Trends
Smallcap Stocks With Best Up Trends [0-bearish to 100-bullish]: B. Riley[100], Central Pacific[100], California Water[100], Cricut [100], Carpenter [100], Haemonetics [100], Sanmina [100], Trustmark [100], Comstock Resources[100], EchoStar [100], Mueller Industries[100]
Best Smallcap Stocks Year-to-Date:
CareMax [490.72%], Janux [338.34%], Viking [270.02%], Alpine Immune[239.52%], Longboard [218%], Super Micro[177%], Arcutis Bio[166.56%], Avidity Biosciences[159.79%], Vera [149.94%], Hippo [128.87%], Stoke [122.15%] Best Smallcap Stocks This Week:
Matterport [168.97%], B. Riley[73.54%], Impinj [33.73%], ProKidney [32.84%], Seres [32.65%], Riot Blockchain[32.64%], Ribbon [25.58%], Cullinan Oncology[22.92%], P.A.M. Transportation[22.85%], NuScale Power[21.44%], Hibbett Sports[21.03%] Best Smallcap Stocks Daily:
Impinj [28.65%], P.A.M. Transportation[17.95%], B. Riley[16.61%], Strategic Education[16.28%], OptiNose [14.56%], JELD-WEN Holding[11.54%], Sonic Automotive[10.86%], Intevac [10.54%], SiTime [8.84%], Noodles & [8.08%], ProKidney [7.75%]