
 Login Sign Up


| |||||
 |  | ||||

| 12Stocks.com Market Intelligence |
Best SmallCap Stocks
|
| In a hurry? Small Cap Stock Lists: Performance Trends Table, Stock Charts
Sort Small Cap stocks: Daily, Weekly, Year-to-Date, Market Cap & Trends. Filter Small Cap stocks list by sector: Show all, Tech, Finance, Energy, Staples, Retail, Industrial, Materials, Utilities and HealthCare Filter Small Cap stocks list by size: All Large Medium Small and MicroCap |
| 12Stocks.com Small Cap Stocks Performances & Trends Daily | |||||||||
|
|  The overall Smart Investing & Trading Score is 23 (0-bearish to 100-bullish) which puts Small Cap index in short term bearish to neutral trend. The Smart Investing & Trading Score from previous trading session is 13 and an improvement of trend continues.
| ||||||||
Here are the Smart Investing & Trading Scores of the most requested small cap stocks at 12Stocks.com (click stock name for detailed review):
|


| 12Stocks.com: Investing in Smallcap Index with Stocks | |
|
The following table helps investors and traders sort through current performance and trends (as measured by Smart Investing & Trading Score) of various
stocks in the Smallcap Index. Quick View: Move mouse or cursor over stock symbol (ticker) to view short-term technical chart and over stock name to view long term chart. Click on  to add stock symbol to your watchlist and to add stock symbol to your watchlist and  to view watchlist. Click on any ticker or stock name for detailed market intelligence report for that stock. to view watchlist. Click on any ticker or stock name for detailed market intelligence report for that stock. |
12Stocks.com Performance of Stocks in Smallcap Index
| Ticker | Stock Name | Watchlist | Category | Recent Price | Smart Investing & Trading Score | Change % | YTD Change% |
| NTST | NetSTREIT |   | Financials | 16.70 | 42 | 0.94% | -6.47% |
| GMRE | Global Medical | | Industrials | 8.19 | 42 | 0.86% | -26.22% |
| NREF | NexPoint Real | | Financials | 13.10 | 42 | 0.65% | -16.78% |
| PRTH | Priority | | Industrials | 3.19 | 42 | 0.47% | -10.25% |
| EMBC | Embecta | | Health Care | 10.57 | 42 | 0.33% | -44.67% |
| LUNG | Pulmonx | | Health Care | 7.52 | 42 | 0.27% | -41.02% |
| METCB | Ramaco Resources | | Materials | 11.43 | 42 | 0.13% | -13.77% |
| GAMB | Gambling.com Group | | Services & Goods | 8.60 | 42 | 0.12% | -11.89% |
| IRTC | iRhythm | | Health Care | 112.18 | 42 | 0.05% | 4.80% |
| AVNS | Avanos Medical | | Health Care | 18.71 | 42 | 0.05% | -16.58% |
| IKNA | Ikena Oncology | | Health Care | 1.28 | 42 | 0.00% | -36.00% |
| SLDP | Solid Power | | Industrials | 1.62 | 42 | 0.00% | 13.33% |
| FNA | Paragon 28 | | Health Care | 9.65 | 42 | -2.03% | -22.61% |
| CMTG | Claros Mortgage | | Financials | 8.84 | 42 | -1.89% | -36.29% |
| TWKS | Thoughtworks Holding | | Technology | 2.31 | 42 | -1.50% | -52.57% |
| PLCE | Children s | | Services & Goods | 8.26 | 42 | -1.43% | -64.43% |
| UPWK | Upwork | | Technology | 11.13 | 42 | -0.89% | -25.15% |
| ADTN | ADTRAN | | Technology | 4.69 | 42 | -0.85% | -36.10% |
| NBR | Nabors Industries | | Energy | 76.53 | 42 | -0.66% | -6.25% |
| COUR | Coursera | | Consumer Staples | 11.95 | 42 | -0.62% | -39.23% |
| VRA | Vera Bradley | | Consumer Staples | 6.44 | 42 | -0.46% | -16.36% |
| BLKB | Blackbaud | | Technology | 76.48 | 42 | -0.30% | -11.79% |
| BTU | Peabody Energy | | Materials | 24.08 | 42 | -0.04% | -0.99% |
| UTI | Universal Technical | | Services & Goods | 14.58 | 41 | 2.46% | 16.45% |
| CDLX | Cardlytics | | Technology | 12.21 | 41 | 2.26% | 32.57% |


| Too many stocks? View smallcap stocks filtered by marketcap & sector |
| Marketcap: All SmallCap Stocks (default-no microcap), Large, Mid-Range, Small |
| Smallcap Sector: Tech, Finance, Energy, Staples, Retail, Industrial, Materials, & Medical |
|
Get the most comprehensive stock market coverage daily at 12Stocks.com ➞ Best Stocks Today ➞ Best Stocks Weekly ➞ Best Stocks Year-to-Date ➞ Best Stocks Trends ➞  Best Stocks Today 12Stocks.com Best Nasdaq Stocks ➞ Best S&P 500 Stocks ➞ Best Tech Stocks ➞ Best Biotech Stocks ➞ |
| Detailed Overview of SmallCap Stocks |
| SmallCap Technical Overview, Leaders & Laggards, Top SmallCap ETF Funds & Detailed SmallCap Stocks List, Charts, Trends & More |
| Smallcap: Technical Analysis, Trends & YTD Performance | |
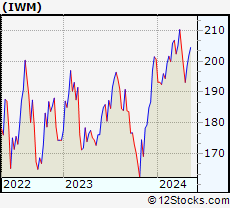
| SmallCap segment as represented by
IWM, an exchange-traded fund [ETF], holds basket of thousands of smallcap stocks from across all major sectors of the US stock market. The smallcap index (contains stocks like Riverbed & Sotheby's) is down by -3.77% and is currently underperforming the overall market by -7.15% year-to-date. Below is a quick view of technical charts and trends: | |
 IWM Weekly Chart |
|
| Long Term Trend: Not Good | |
| Medium Term Trend: Not Good | |
 IWM Daily Chart |
|
| Short Term Trend: Not Good | |
| Overall Trend Score: 23 | |
| YTD Performance: -3.77% | |
| **Trend Scores & Views Are Only For Educational Purposes And Not For Investing | |
| 12Stocks.com: Top Performing Small Cap Index Stocks | ||||||||||||||||||||||||||||||||||||||||||||||||
 The top performing Small Cap Index stocks year to date are
Now, more recently, over last week, the top performing Small Cap Index stocks on the move are


|
||||||||||||||||||||||||||||||||||||||||||||||||
| 12Stocks.com: Investing in Smallcap Index using Exchange Traded Funds | |
|
The following table shows list of key exchange traded funds (ETF) that
help investors track Smallcap index. The following list also includes leveraged ETF funds that track twice or thrice the daily returns of Smallcap indices. Short or inverse ETF funds move in the opposite direction to the index they track and are useful during market pullbacks or during bear markets. Quick View: Move mouse or cursor over ETF symbol (ticker) to view short-term technical chart and over ETF name to view long term chart. Click on ticker or stock name for detailed view. Click on to add stock symbol to your watchlist and to view watchlist. |
12Stocks.com List of ETFs that track Smallcap Index
| Ticker | ETF Name | Watchlist | Recent Price | Smart Investing & Trading Score | Change % | Week % | Year-to-date % |
| IWM | iShares Russell 2000 | | 193.14 | 23 | 0.16 | -2.79 | -3.77% |
| IJR | iShares Core S&P Small-Cap | | 103.22 | 10 | 0.86 | -1.23 | -4.65% |
| IWN | iShares Russell 2000 Value | | 147.78 | 10 | 0.99 | -1.73 | -4.86% |
| VTWO | Vanguard Russell 2000 ETF | | 78.06 | 23 | 0.14 | -2.81 | -3.75% |
| IWO | iShares Russell 2000 Growth | | 245.29 | 36 | -0.67 | -3.94 | -2.75% |
| IJS | iShares S&P Small-Cap 600 Value | | 95.61 | 17 | 1.16 | -0.58 | -7.24% |
| IJT | iShares S&P Small-Cap 600 Growth | | 121.96 | 23 | 0.32 | -2.26 | -2.54% |
| XSLV | PowerShares S&P SmallCap Low Volatil ETF | | 42.30 | 17 | 1.56 | 0.5 | -4.19% |
| SAA | ProShares Ultra SmallCap600 | | 21.80 | 18 | 0.83 | -3.37 | -12.63% |
| SMLV | SPDR SSGA US Small Cap Low Volatil ETF | | 106.09 | 32 | 2.18 | 1.03 | -5.71% |
| SDD | ProShares UltraShort SmallCap600 | | 20.34 | 76 | -1.69 | 2.57 | 10.38% |
| SBB | ProShares Short SmallCap600 | | 16.84 | 76 | -0.82 | 1.77 | 5.71% |
| 12Stocks.com: Charts, Trends, Fundamental Data and Performances of SmallCap Stocks | |
|
We now take in-depth look at all SmallCap stocks including charts, multi-period performances and overall trends (as measured by Smart Investing & Trading Score). One can sort SmallCap stocks (click link to choose) by Daily, Weekly and by Year-to-Date performances. Also, one can sort by size of the company or by market capitalization. |
| Select Your Default Chart Type: | |||||
| |||||
| Click on stock symbol or name for detailed view. Click on to add stock symbol to your watchlist and to view watchlist. Quick View: Move mouse or cursor over "Daily" to quickly view daily technical stock chart and over "Weekly" to view weekly technical stock chart. | |||||

 | NTST NetSTREIT Corp. |
| Sector: Financials | |
| SubSector: REIT Retail | |
| MarketCap: 51267 Millions | |
| Recent Price: 16.70 Smart Investing & Trading Score: 42 | |
| Day Percent Change: 0.94% Day Change: 0.15 | |
| Week Change: -1.97% Year-to-date Change: -6.5% | |
| NTST Links: Profile News Message Board | |
| Charts:- Daily , Weekly | |
| Add NTST to Watchlist: View: Get Complete NTST Trend Analysis ➞ | |
 | GMRE Global Medical REIT Inc. |
| Sector: Industrials | |
| SubSector: Conglomerates | |
| MarketCap: 529.748 Millions | |
| Recent Price: 8.19 Smart Investing & Trading Score: 42 | |
| Day Percent Change: 0.86% Day Change: 0.07 | |
| Week Change: -1.44% Year-to-date Change: -26.2% | |
| GMRE Links: Profile News Message Board | |
| Charts:- Daily , Weekly | |
| Add GMRE to Watchlist: View: Get Complete GMRE Trend Analysis ➞ | |
 | NREF NexPoint Real Estate Finance, Inc. |
| Sector: Financials | |
| SubSector: REIT Diversified | |
| MarketCap: 97267 Millions | |
| Recent Price: 13.10 Smart Investing & Trading Score: 42 | |
| Day Percent Change: 0.65% Day Change: 0.09 | |
| Week Change: 0.19% Year-to-date Change: -16.8% | |
| NREF Links: Profile News Message Board | |
| Charts:- Daily , Weekly | |
| Add NREF to Watchlist: View: Get Complete NREF Trend Analysis ➞ | |
 | PRTH Priority Technology Holdings, Inc. |
| Sector: Industrials | |
| SubSector: Conglomerates | |
| MarketCap: 116.548 Millions | |
| Recent Price: 3.19 Smart Investing & Trading Score: 42 | |
| Day Percent Change: 0.47% Day Change: 0.01 | |
| Week Change: 1.43% Year-to-date Change: -10.3% | |
| PRTH Links: Profile News Message Board | |
| Charts:- Daily , Weekly | |
| Add PRTH to Watchlist: View: Get Complete PRTH Trend Analysis ➞ | |
 | EMBC Embecta Corp. |
| Sector: Health Care | |
| SubSector: Medical Instruments & Supplies | |
| MarketCap: 1260 Millions | |
| Recent Price: 10.57 Smart Investing & Trading Score: 42 | |
| Day Percent Change: 0.33% Day Change: 0.04 | |
| Week Change: 3.12% Year-to-date Change: -44.7% | |
| EMBC Links: Profile News Message Board | |
| Charts:- Daily , Weekly | |
| Add EMBC to Watchlist: View: Get Complete EMBC Trend Analysis ➞ | |
 | LUNG Pulmonx Corporation |
| Sector: Health Care | |
| SubSector: Medical Devices | |
| MarketCap: 18187 Millions | |
| Recent Price: 7.52 Smart Investing & Trading Score: 42 | |
| Day Percent Change: 0.27% Day Change: 0.02 | |
| Week Change: -4.69% Year-to-date Change: -41.0% | |
| LUNG Links: Profile News Message Board | |
| Charts:- Daily , Weekly | |
| Add LUNG to Watchlist: View: Get Complete LUNG Trend Analysis ➞ | |
 | METCB Ramaco Resources, Inc. |
| Sector: Materials | |
| SubSector: Coking Coal | |
| MarketCap: 469 Millions | |
| Recent Price: 11.43 Smart Investing & Trading Score: 42 | |
| Day Percent Change: 0.13% Day Change: 0.02 | |
| Week Change: 0.13% Year-to-date Change: -13.8% | |
| METCB Links: Profile News Message Board | |
| Charts:- Daily , Weekly | |
| Add METCB to Watchlist: View: Get Complete METCB Trend Analysis ➞ | |
 | GAMB Gambling.com Group Limited |
| Sector: Services & Goods | |
| SubSector: Gambling | |
| MarketCap: 376 Millions | |
| Recent Price: 8.60 Smart Investing & Trading Score: 42 | |
| Day Percent Change: 0.12% Day Change: 0.01 | |
| Week Change: -5.49% Year-to-date Change: -11.9% | |
| GAMB Links: Profile News Message Board | |
| Charts:- Daily , Weekly | |
| Add GAMB to Watchlist: View: Get Complete GAMB Trend Analysis ➞ | |
 | IRTC iRhythm Technologies, Inc. |
| Sector: Health Care | |
| SubSector: Medical Instruments & Supplies | |
| MarketCap: 2167.9 Millions | |
| Recent Price: 112.18 Smart Investing & Trading Score: 42 | |
| Day Percent Change: 0.05% Day Change: 0.06 | |
| Week Change: -0.83% Year-to-date Change: 4.8% | |
| IRTC Links: Profile News Message Board | |
| Charts:- Daily , Weekly | |
| Add IRTC to Watchlist: View: Get Complete IRTC Trend Analysis ➞ | |
 | AVNS Avanos Medical, Inc. |
| Sector: Health Care | |
| SubSector: Medical Instruments & Supplies | |
| MarketCap: 1229.6 Millions | |
| Recent Price: 18.71 Smart Investing & Trading Score: 42 | |
| Day Percent Change: 0.05% Day Change: 0.01 | |
| Week Change: 1.08% Year-to-date Change: -16.6% | |
| AVNS Links: Profile News Message Board | |
| Charts:- Daily , Weekly | |
| Add AVNS to Watchlist: View: Get Complete AVNS Trend Analysis ➞ | |
 | IKNA Ikena Oncology, Inc. |
| Sector: Health Care | |
| SubSector: Biotechnology | |
| MarketCap: 277 Millions | |
| Recent Price: 1.28 Smart Investing & Trading Score: 42 | |
| Day Percent Change: 0.00% Day Change: 0.00 | |
| Week Change: -3.76% Year-to-date Change: -36.0% | |
| IKNA Links: Profile News Message Board | |
| Charts:- Daily , Weekly | |
| Add IKNA to Watchlist: View: Get Complete IKNA Trend Analysis ➞ | |
 | SLDP Solid Power, Inc. |
| Sector: Industrials | |
| SubSector: Electrical Equipment & Parts | |
| MarketCap: 445 Millions | |
| Recent Price: 1.62 Smart Investing & Trading Score: 42 | |
| Day Percent Change: 0.00% Day Change: 0.00 | |
| Week Change: 0.31% Year-to-date Change: 13.3% | |
| SLDP Links: Profile News Message Board | |
| Charts:- Daily , Weekly | |
| Add SLDP to Watchlist: View: Get Complete SLDP Trend Analysis ➞ | |
 | FNA Paragon 28, Inc. |
| Sector: Health Care | |
| SubSector: Medical Devices | |
| MarketCap: 1420 Millions | |
| Recent Price: 9.65 Smart Investing & Trading Score: 42 | |
| Day Percent Change: -2.03% Day Change: -0.20 | |
| Week Change: -5.85% Year-to-date Change: -22.6% | |
| FNA Links: Profile News Message Board | |
| Charts:- Daily , Weekly | |
| Add FNA to Watchlist: View: Get Complete FNA Trend Analysis ➞ | |
 | CMTG Claros Mortgage Trust, Inc. |
| Sector: Financials | |
| SubSector: REIT - Mortgage | |
| MarketCap: 1610 Millions | |
| Recent Price: 8.84 Smart Investing & Trading Score: 42 | |
| Day Percent Change: -1.89% Day Change: -0.17 | |
| Week Change: 1.84% Year-to-date Change: -36.3% | |
| CMTG Links: Profile News Message Board | |
| Charts:- Daily , Weekly | |
| Add CMTG to Watchlist: View: Get Complete CMTG Trend Analysis ➞ | |
 | TWKS Thoughtworks Holding, Inc. |
| Sector: Technology | |
| SubSector: Information Technology Services | |
| MarketCap: 2370 Millions | |
| Recent Price: 2.31 Smart Investing & Trading Score: 42 | |
| Day Percent Change: -1.50% Day Change: -0.03 | |
| Week Change: -3.56% Year-to-date Change: -52.6% | |
| TWKS Links: Profile News Message Board | |
| Charts:- Daily , Weekly | |
| Add TWKS to Watchlist: View: Get Complete TWKS Trend Analysis ➞ | |
 | PLCE The Children s Place, Inc. |
| Sector: Services & Goods | |
| SubSector: Apparel Stores | |
| MarketCap: 303.608 Millions | |
| Recent Price: 8.26 Smart Investing & Trading Score: 42 | |
| Day Percent Change: -1.43% Day Change: -0.12 | |
| Week Change: 6.44% Year-to-date Change: -64.4% | |
| PLCE Links: Profile News Message Board | |
| Charts:- Daily , Weekly | |
| Add PLCE to Watchlist: View: Get Complete PLCE Trend Analysis ➞ | |
 | UPWK Upwork Inc. |
| Sector: Technology | |
| SubSector: Internet Information Providers | |
| MarketCap: 815.98 Millions | |
| Recent Price: 11.13 Smart Investing & Trading Score: 42 | |
| Day Percent Change: -0.89% Day Change: -0.10 | |
| Week Change: -4.3% Year-to-date Change: -25.2% | |
| UPWK Links: Profile News Message Board | |
| Charts:- Daily , Weekly | |
| Add UPWK to Watchlist: View: Get Complete UPWK Trend Analysis ➞ | |
 | ADTN ADTRAN, Inc. |
| Sector: Technology | |
| SubSector: Communication Equipment | |
| MarketCap: 303.539 Millions | |
| Recent Price: 4.69 Smart Investing & Trading Score: 42 | |
| Day Percent Change: -0.85% Day Change: -0.04 | |
| Week Change: -0.64% Year-to-date Change: -36.1% | |
| ADTN Links: Profile News Message Board | |
| Charts:- Daily , Weekly | |
| Add ADTN to Watchlist: View: Get Complete ADTN Trend Analysis ➞ | |
 | NBR Nabors Industries Ltd. |
| Sector: Energy | |
| SubSector: Oil & Gas Drilling & Exploration | |
| MarketCap: 240.539 Millions | |
| Recent Price: 76.53 Smart Investing & Trading Score: 42 | |
| Day Percent Change: -0.66% Day Change: -0.51 | |
| Week Change: -3.6% Year-to-date Change: -6.3% | |
| NBR Links: Profile News Message Board | |
| Charts:- Daily , Weekly | |
| Add NBR to Watchlist: View: Get Complete NBR Trend Analysis ➞ | |
 | COUR Coursera, Inc. |
| Sector: Consumer Staples | |
| SubSector: Education & Training Services | |
| MarketCap: 1990 Millions | |
| Recent Price: 11.95 Smart Investing & Trading Score: 42 | |
| Day Percent Change: -0.62% Day Change: -0.08 | |
| Week Change: -8.78% Year-to-date Change: -39.2% | |
| COUR Links: Profile News Message Board | |
| Charts:- Daily , Weekly | |
| Add COUR to Watchlist: View: Get Complete COUR Trend Analysis ➞ | |
 | VRA Vera Bradley, Inc. |
| Sector: Consumer Staples | |
| SubSector: Textile - Apparel Footwear & Accessories | |
| MarketCap: 151.17 Millions | |
| Recent Price: 6.44 Smart Investing & Trading Score: 42 | |
| Day Percent Change: -0.46% Day Change: -0.03 | |
| Week Change: 1.42% Year-to-date Change: -16.4% | |
| VRA Links: Profile News Message Board | |
| Charts:- Daily , Weekly | |
| Add VRA to Watchlist: View: Get Complete VRA Trend Analysis ➞ | |
 | BLKB Blackbaud, Inc. |
| Sector: Technology | |
| SubSector: Business Software & Services | |
| MarketCap: 2838.48 Millions | |
| Recent Price: 76.48 Smart Investing & Trading Score: 42 | |
| Day Percent Change: -0.30% Day Change: -0.23 | |
| Week Change: -0.31% Year-to-date Change: -11.8% | |
| BLKB Links: Profile News Message Board | |
| Charts:- Daily , Weekly | |
| Add BLKB to Watchlist: View: Get Complete BLKB Trend Analysis ➞ | |
 | BTU Peabody Energy Corporation |
| Sector: Materials | |
| SubSector: Industrial Metals & Minerals | |
| MarketCap: 355.11 Millions | |
| Recent Price: 24.08 Smart Investing & Trading Score: 42 | |
| Day Percent Change: -0.04% Day Change: -0.01 | |
| Week Change: 4.29% Year-to-date Change: -1.0% | |
| BTU Links: Profile News Message Board | |
| Charts:- Daily , Weekly | |
| Add BTU to Watchlist: View: Get Complete BTU Trend Analysis ➞ | |
 | UTI Universal Technical Institute, Inc. |
| Sector: Services & Goods | |
| SubSector: Education & Training Services | |
| MarketCap: 163.506 Millions | |
| Recent Price: 14.58 Smart Investing & Trading Score: 41 | |
| Day Percent Change: 2.46% Day Change: 0.35 | |
| Week Change: -2.54% Year-to-date Change: 16.5% | |
| UTI Links: Profile News Message Board | |
| Charts:- Daily , Weekly | |
| Add UTI to Watchlist: View: Get Complete UTI Trend Analysis ➞ | |
 | CDLX Cardlytics, Inc. |
| Sector: Technology | |
| SubSector: Internet Information Providers | |
| MarketCap: 855.48 Millions | |
| Recent Price: 12.21 Smart Investing & Trading Score: 41 | |
| Day Percent Change: 2.26% Day Change: 0.27 | |
| Week Change: -10.02% Year-to-date Change: 32.6% | |
| CDLX Links: Profile News Message Board | |
| Charts:- Daily , Weekly | |
| Add CDLX to Watchlist: View: Get Complete CDLX Trend Analysis ➞ | |
| Too many stocks? View smallcap stocks filtered by marketcap & sector |
| Marketcap: All SmallCap Stocks (default-no microcap), Large, Mid-Range, Small & MicroCap |
| Sector: Tech, Finance, Energy, Staples, Retail, Industrial, Materials, Utilities & Medical |
|
Best Stocks Today 12Stocks.com |
© 2024 12Stocks.com Terms & Conditions Privacy Contact Us
All Information Provided Only For Education And Not To Be Used For Investing or Trading. See Terms & Conditions


One More Thing ... Get Best Stocks Delivered Daily!
Never Ever Miss A Move With Our Top Ten Stocks Lists
Find Best Stocks In Any Market - Bull or Bear Market
Take A Peek At Our Top Ten Stocks Lists: Daily, Weekly, Year-to-Date & Top Trends
Find Best Stocks In Any Market - Bull or Bear Market
Take A Peek At Our Top Ten Stocks Lists: Daily, Weekly, Year-to-Date & Top Trends
Smallcap Stocks With Best Up Trends [0-bearish to 100-bullish]: Humacyte [100], Old Second[100], Gannett Co[100], Tejon Ranch[100], Cricut [100], Victory Capital[100], United Fire[100], Century Aluminum[100], Portland General[100], Lantheus [100], Oscar Health[100]
Best Smallcap Stocks Year-to-Date:
Agenus [540.17%], CareMax [423.71%], Janux [336.95%], Viking [240.57%], Alpine Immune[238.94%], Longboard [194.11%], Arcutis Bio[181.42%], Avidity Biosciences[153.65%], Super Micro[151.19%], Vera [138.18%], Stoke [129.66%] Best Smallcap Stocks This Week:
Macatawa Bank[46.82%], Vertex Energy[43.27%], Snap One[29.61%], Vanda [24.03%], Humacyte [23.78%], ALX Oncology[22.49%], ContextLogic [20%], ProKidney [16.57%], Calavo Growers[16.33%], Badger Meter[15.61%], Accolade [13.45%] Best Smallcap Stocks Daily:
Tellurian [28.11%], Origin Materials[20.44%], Metropolitan Bank[18.01%], Vertex Energy[13.74%], Genelux [10.37%], Gevo [10.14%], Riot Blockchain[10.07%], Humacyte [9.86%], Marathon Patent[9.78%], Emergent BioSolutions[9.68%], Fossil Group[9.64%]