
 Login Sign Up


| |||||
 |  | ||||

| 12Stocks.com Market Intelligence |
Best SmallCap Stocks
|
| In a hurry? Small Cap Stock Lists: Performance Trends Table, Stock Charts
Sort Small Cap stocks: Daily, Weekly, Year-to-Date, Market Cap & Trends. Filter Small Cap stocks list by sector: Show all, Tech, Finance, Energy, Staples, Retail, Industrial, Materials, Utilities and HealthCare Filter Small Cap stocks list by size: All Large Medium Small and MicroCap |
| 12Stocks.com Small Cap Stocks Performances & Trends Daily | |||||||||
|
|  The overall Smart Investing & Trading Score is 56 (0-bearish to 100-bullish) which puts Small Cap index in short term neutral trend. The Smart Investing & Trading Score from previous trading session is 44 and hence an improvement of trend.
| ||||||||
Here are the Smart Investing & Trading Scores of the most requested small cap stocks at 12Stocks.com (click stock name for detailed review):
|


| 12Stocks.com: Investing in Smallcap Index with Stocks | |
|
The following table helps investors and traders sort through current performance and trends (as measured by Smart Investing & Trading Score) of various
stocks in the Smallcap Index. Quick View: Move mouse or cursor over stock symbol (ticker) to view short-term technical chart and over stock name to view long term chart. Click on  to add stock symbol to your watchlist and to add stock symbol to your watchlist and  to view watchlist. Click on any ticker or stock name for detailed market intelligence report for that stock. to view watchlist. Click on any ticker or stock name for detailed market intelligence report for that stock. |
12Stocks.com Performance of Stocks in Smallcap Index
| Ticker | Stock Name | Watchlist | Category | Recent Price | Smart Investing & Trading Score | Change % | YTD Change% |
| UVE | Universal Insurance |   | Financials | 19.54 | 93 | -3.74% | 22.28% |
| RBBN | Ribbon | | Technology | 3.13 | 93 | -3.40% | 7.93% |
| FIP | FTAI Infrastructure | | Industrials | 7.24 | 93 | -2.36% | 85.99% |
| FBP | First Ban | | Financials | 17.24 | 93 | -1.93% | 4.80% |
| MLI | Mueller Industries | | Industrials | 57.33 | 93 | -1.85% | 21.59% |
| ASGN | ASGN | | Services & Goods | 97.51 | 93 | -1.23% | 1.39% |
| MWA | Mueller Water | | Industrials | 15.98 | 93 | -1.05% | 10.97% |
| POR | Portland General | | Utilities | 42.80 | 93 | -1.04% | -1.25% |
| FRME | First Merchants | | Financials | 34.13 | 93 | -0.96% | -7.96% |
| NWE | NorthWestern | | Utilities | 49.55 | 93 | -0.72% | -2.63% |
| KRG | Kite Realty | | Financials | 21.26 | 93 | -0.65% | -7.00% |
| AGIO | Agios | | Health Care | 31.49 | 93 | -0.57% | 41.40% |
| TCBX | Third Coast | | Financials | 19.73 | 93 | -0.48% | -1.37% |
| BANF | BancFirst | | Financials | 89.08 | 93 | -0.27% | -8.48% |
| PEB | Pebblebrook Hotel | | Financials | 14.96 | 93 | -0.27% | -6.38% |
| DCO | Ducommun | | Industrials | 53.94 | 93 | -0.20% | 3.61% |
| CVBF | CVB Financial | | Financials | 16.48 | 93 | -0.18% | -18.38% |
| HMN | Horace Mann | | Financials | 36.74 | 93 | -0.05% | 12.35% |
| BLFS | BioLife Solutions | | Health Care | 17.53 | 93 | 3.97% | 7.88% |
| TTMI | TTM | | Technology | 15.13 | 93 | 2.37% | -4.30% |
| PLXS | Plexus | | Technology | 100.28 | 93 | 1.20% | -7.26% |
| TSQ | Townsquare Media | | Services & Goods | 12.24 | 93 | 0.91% | 15.91% |
| NBTB | NBT Bancorp | | Financials | 35.97 | 93 | 0.64% | -14.17% |
| NPK | National Presto | | Industrials | 82.98 | 93 | 0.04% | 3.36% |
| CHCO | City Holding | | Financials | 104.11 | 93 | -1.05% | -5.58% |


| Too many stocks? View smallcap stocks filtered by marketcap & sector |
| Marketcap: All SmallCap Stocks (default-no microcap), Large, Mid-Range, Small |
| Smallcap Sector: Tech, Finance, Energy, Staples, Retail, Industrial, Materials, & Medical |
|
Get the most comprehensive stock market coverage daily at 12Stocks.com ➞ Best Stocks Today ➞ Best Stocks Weekly ➞ Best Stocks Year-to-Date ➞ Best Stocks Trends ➞  Best Stocks Today 12Stocks.com Best Nasdaq Stocks ➞ Best S&P 500 Stocks ➞ Best Tech Stocks ➞ Best Biotech Stocks ➞ |
| Detailed Overview of SmallCap Stocks |
| SmallCap Technical Overview, Leaders & Laggards, Top SmallCap ETF Funds & Detailed SmallCap Stocks List, Charts, Trends & More |
| Smallcap: Technical Analysis, Trends & YTD Performance | |
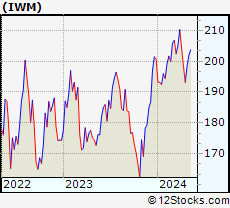
| SmallCap segment as represented by
IWM, an exchange-traded fund [ETF], holds basket of thousands of smallcap stocks from across all major sectors of the US stock market. The smallcap index (contains stocks like Riverbed & Sotheby's) is down by -1.16% and is currently underperforming the overall market by -7.3% year-to-date. Below is a quick view of technical charts and trends: | |
 IWM Weekly Chart |
|
| Long Term Trend: Good | |
| Medium Term Trend: Not Good | |
 IWM Daily Chart |
|
| Short Term Trend: Very Good | |
| Overall Trend Score: 56 | |
| YTD Performance: -1.16% | |
| **Trend Scores & Views Are Only For Educational Purposes And Not For Investing | |
| 12Stocks.com: Top Performing Small Cap Index Stocks | ||||||||||||||||||||||||||||||||||||||||||||||||
 The top performing Small Cap Index stocks year to date are
Now, more recently, over last week, the top performing Small Cap Index stocks on the move are


|
||||||||||||||||||||||||||||||||||||||||||||||||
| 12Stocks.com: Investing in Smallcap Index using Exchange Traded Funds | |
|
The following table shows list of key exchange traded funds (ETF) that
help investors track Smallcap index. The following list also includes leveraged ETF funds that track twice or thrice the daily returns of Smallcap indices. Short or inverse ETF funds move in the opposite direction to the index they track and are useful during market pullbacks or during bear markets. Quick View: Move mouse or cursor over ETF symbol (ticker) to view short-term technical chart and over ETF name to view long term chart. Click on ticker or stock name for detailed view. Click on to add stock symbol to your watchlist and to view watchlist. |
12Stocks.com List of ETFs that track Smallcap Index
| Ticker | ETF Name | Watchlist | Recent Price | Smart Investing & Trading Score | Change % | Week % | Year-to-date % |
| IWM | iShares Russell 2000 | | 198.39 | 56 | 0.97 | 2.72 | -1.16% |
| IJR | iShares Core S&P Small-Cap | | 105.65 | 85 | 0.75 | 2.35 | -2.4% |
| VTWO | Vanguard Russell 2000 ETF | | 80.22 | 70 | 0.97 | 2.74 | -1.09% |
| IWN | iShares Russell 2000 Value | | 151.14 | 75 | 0.64 | 2.27 | -2.7% |
| IWO | iShares Russell 2000 Growth | | 253.09 | 58 | 1.29 | 3.18 | 0.34% |
| IJS | iShares S&P Small-Cap 600 Value | | 97.19 | 67 | 0.52 | 1.65 | -5.7% |
| IJT | iShares S&P Small-Cap 600 Growth | | 126.09 | 70 | 0.82 | 3.17 | 0.76% |
| XSLV | PowerShares S&P SmallCap Low Volatil ETF | | 42.72 | 80 | 0.42 | 1.28 | -3.24% |
| SAA | ProShares Ultra SmallCap600 | | 23.04 | 65 | 1.68 | 5.69 | -7.66% |
| SBB | ProShares Short SmallCap600 | | 16.39 | 33 | -0.70 | -2.7 | 2.86% |
| SDD | ProShares UltraShort SmallCap600 | | 19.35 | 35 | -1.17 | -4.87 | 5.01% |
| SMLV | SPDR SSGA US Small Cap Low Volatil ETF | | 107.52 | 80 | 0.18 | 1.35 | -4.44% |
| 12Stocks.com: Charts, Trends, Fundamental Data and Performances of SmallCap Stocks | |
|
We now take in-depth look at all SmallCap stocks including charts, multi-period performances and overall trends (as measured by Smart Investing & Trading Score). One can sort SmallCap stocks (click link to choose) by Daily, Weekly and by Year-to-Date performances. Also, one can sort by size of the company or by market capitalization. |
| Select Your Default Chart Type: | |||||
| |||||
| Click on stock symbol or name for detailed view. Click on to add stock symbol to your watchlist and to view watchlist. Quick View: Move mouse or cursor over "Daily" to quickly view daily technical stock chart and over "Weekly" to view weekly technical stock chart. | |||||

 | UVE Universal Insurance Holdings, Inc. |
| Sector: Financials | |
| SubSector: Property & Casualty Insurance | |
| MarketCap: 616.212 Millions | |
| Recent Price: 19.54 Smart Investing & Trading Score: 93 | |
| Day Percent Change: -3.74% Day Change: -0.76 | |
| Week Change: -0.41% Year-to-date Change: 22.3% | |
| UVE Links: Profile News Message Board | |
| Charts:- Daily , Weekly | |
| Add UVE to Watchlist: View: Get Complete UVE Trend Analysis ➞ | |
 | RBBN Ribbon Communications Inc. |
| Sector: Technology | |
| SubSector: Telecom Services - Domestic | |
| MarketCap: 284.577 Millions | |
| Recent Price: 3.13 Smart Investing & Trading Score: 93 | |
| Day Percent Change: -3.40% Day Change: -0.11 | |
| Week Change: 21.32% Year-to-date Change: 7.9% | |
| RBBN Links: Profile News Message Board | |
| Charts:- Daily , Weekly | |
| Add RBBN to Watchlist: View: Get Complete RBBN Trend Analysis ➞ | |
 | FIP FTAI Infrastructure Inc. |
| Sector: Industrials | |
| SubSector: Industrials | |
| MarketCap: 368 Millions | |
| Recent Price: 7.24 Smart Investing & Trading Score: 93 | |
| Day Percent Change: -2.36% Day Change: -0.17 | |
| Week Change: 8.47% Year-to-date Change: 86.0% | |
| FIP Links: Profile News Message Board | |
| Charts:- Daily , Weekly | |
| Add FIP to Watchlist: View: Get Complete FIP Trend Analysis ➞ | |
 | FBP First BanCorp. |
| Sector: Financials | |
| SubSector: Foreign Regional Banks | |
| MarketCap: 913.079 Millions | |
| Recent Price: 17.24 Smart Investing & Trading Score: 93 | |
| Day Percent Change: -1.93% Day Change: -0.34 | |
| Week Change: 1.95% Year-to-date Change: 4.8% | |
| FBP Links: Profile News Message Board | |
| Charts:- Daily , Weekly | |
| Add FBP to Watchlist: View: Get Complete FBP Trend Analysis ➞ | |
 | MLI Mueller Industries, Inc. |
| Sector: Industrials | |
| SubSector: Metal Fabrication | |
| MarketCap: 1259.5 Millions | |
| Recent Price: 57.33 Smart Investing & Trading Score: 93 | |
| Day Percent Change: -1.85% Day Change: -1.08 | |
| Week Change: 9.66% Year-to-date Change: 21.6% | |
| MLI Links: Profile News Message Board | |
| Charts:- Daily , Weekly | |
| Add MLI to Watchlist: View: Get Complete MLI Trend Analysis ➞ | |
 | ASGN ASGN Incorporated |
| Sector: Services & Goods | |
| SubSector: Staffing & Outsourcing Services | |
| MarketCap: 2035.88 Millions | |
| Recent Price: 97.51 Smart Investing & Trading Score: 93 | |
| Day Percent Change: -1.23% Day Change: -1.21 | |
| Week Change: -0.28% Year-to-date Change: 1.4% | |
| ASGN Links: Profile News Message Board | |
| Charts:- Daily , Weekly | |
| Add ASGN to Watchlist: View: Get Complete ASGN Trend Analysis ➞ | |
 | MWA Mueller Water Products, Inc. |
| Sector: Industrials | |
| SubSector: Industrial Equipment & Components | |
| MarketCap: 1321.09 Millions | |
| Recent Price: 15.98 Smart Investing & Trading Score: 93 | |
| Day Percent Change: -1.05% Day Change: -0.17 | |
| Week Change: 0.06% Year-to-date Change: 11.0% | |
| MWA Links: Profile News Message Board | |
| Charts:- Daily , Weekly | |
| Add MWA to Watchlist: View: Get Complete MWA Trend Analysis ➞ | |
 | POR Portland General Electric Company |
| Sector: Utilities | |
| SubSector: Electric Utilities | |
| MarketCap: 4291.84 Millions | |
| Recent Price: 42.80 Smart Investing & Trading Score: 93 | |
| Day Percent Change: -1.04% Day Change: -0.45 | |
| Week Change: 0% Year-to-date Change: -1.3% | |
| POR Links: Profile News Message Board | |
| Charts:- Daily , Weekly | |
| Add POR to Watchlist: View: Get Complete POR Trend Analysis ➞ | |
 | FRME First Merchants Corporation |
| Sector: Financials | |
| SubSector: Regional - Midwest Banks | |
| MarketCap: 1490.4 Millions | |
| Recent Price: 34.13 Smart Investing & Trading Score: 93 | |
| Day Percent Change: -0.96% Day Change: -0.33 | |
| Week Change: 0.18% Year-to-date Change: -8.0% | |
| FRME Links: Profile News Message Board | |
| Charts:- Daily , Weekly | |
| Add FRME to Watchlist: View: Get Complete FRME Trend Analysis ➞ | |
 | NWE NorthWestern Corporation |
| Sector: Utilities | |
| SubSector: Diversified Utilities | |
| MarketCap: 2801.8 Millions | |
| Recent Price: 49.55 Smart Investing & Trading Score: 93 | |
| Day Percent Change: -0.72% Day Change: -0.36 | |
| Week Change: -1.16% Year-to-date Change: -2.6% | |
| NWE Links: Profile News Message Board | |
| Charts:- Daily , Weekly | |
| Add NWE to Watchlist: View: Get Complete NWE Trend Analysis ➞ | |
 | KRG Kite Realty Group Trust |
| Sector: Financials | |
| SubSector: REIT - Retail | |
| MarketCap: 1030.14 Millions | |
| Recent Price: 21.26 Smart Investing & Trading Score: 93 | |
| Day Percent Change: -0.65% Day Change: -0.14 | |
| Week Change: 1.77% Year-to-date Change: -7.0% | |
| KRG Links: Profile News Message Board | |
| Charts:- Daily , Weekly | |
| Add KRG to Watchlist: View: Get Complete KRG Trend Analysis ➞ | |
 | AGIO Agios Pharmaceuticals, Inc. |
| Sector: Health Care | |
| SubSector: Biotechnology | |
| MarketCap: 2613.35 Millions | |
| Recent Price: 31.49 Smart Investing & Trading Score: 93 | |
| Day Percent Change: -0.57% Day Change: -0.18 | |
| Week Change: 6.64% Year-to-date Change: 41.4% | |
| AGIO Links: Profile News Message Board | |
| Charts:- Daily , Weekly | |
| Add AGIO to Watchlist: View: Get Complete AGIO Trend Analysis ➞ | |
 | TCBX Third Coast Bancshares, Inc. |
| Sector: Financials | |
| SubSector: Banks - Regional | |
| MarketCap: 212 Millions | |
| Recent Price: 19.73 Smart Investing & Trading Score: 93 | |
| Day Percent Change: -0.48% Day Change: -0.09 | |
| Week Change: 3.11% Year-to-date Change: -1.4% | |
| TCBX Links: Profile News Message Board | |
| Charts:- Daily , Weekly | |
| Add TCBX to Watchlist: View: Get Complete TCBX Trend Analysis ➞ | |
 | BANF BancFirst Corporation |
| Sector: Financials | |
| SubSector: Regional - Southwest Banks | |
| MarketCap: 1068.65 Millions | |
| Recent Price: 89.08 Smart Investing & Trading Score: 93 | |
| Day Percent Change: -0.27% Day Change: -0.24 | |
| Week Change: -0.22% Year-to-date Change: -8.5% | |
| BANF Links: Profile News Message Board | |
| Charts:- Daily , Weekly | |
| Add BANF to Watchlist: View: Get Complete BANF Trend Analysis ➞ | |
 | PEB Pebblebrook Hotel Trust |
| Sector: Financials | |
| SubSector: REIT - Hotel/Motel | |
| MarketCap: 1472.84 Millions | |
| Recent Price: 14.96 Smart Investing & Trading Score: 93 | |
| Day Percent Change: -0.27% Day Change: -0.04 | |
| Week Change: 2.26% Year-to-date Change: -6.4% | |
| PEB Links: Profile News Message Board | |
| Charts:- Daily , Weekly | |
| Add PEB to Watchlist: View: Get Complete PEB Trend Analysis ➞ | |
 | DCO Ducommun Incorporated |
| Sector: Industrials | |
| SubSector: Aerospace/Defense Products & Services | |
| MarketCap: 261.101 Millions | |
| Recent Price: 53.94 Smart Investing & Trading Score: 93 | |
| Day Percent Change: -0.20% Day Change: -0.11 | |
| Week Change: 3.69% Year-to-date Change: 3.6% | |
| DCO Links: Profile News Message Board | |
| Charts:- Daily , Weekly | |
| Add DCO to Watchlist: View: Get Complete DCO Trend Analysis ➞ | |
 | CVBF CVB Financial Corp. |
| Sector: Financials | |
| SubSector: Regional - Pacific Banks | |
| MarketCap: 2699.99 Millions | |
| Recent Price: 16.48 Smart Investing & Trading Score: 93 | |
| Day Percent Change: -0.18% Day Change: -0.03 | |
| Week Change: -0.9% Year-to-date Change: -18.4% | |
| CVBF Links: Profile News Message Board | |
| Charts:- Daily , Weekly | |
| Add CVBF to Watchlist: View: Get Complete CVBF Trend Analysis ➞ | |
 | HMN Horace Mann Educators Corporation |
| Sector: Financials | |
| SubSector: Property & Casualty Insurance | |
| MarketCap: 1545.52 Millions | |
| Recent Price: 36.74 Smart Investing & Trading Score: 93 | |
| Day Percent Change: -0.05% Day Change: -0.02 | |
| Week Change: 1.05% Year-to-date Change: 12.4% | |
| HMN Links: Profile News Message Board | |
| Charts:- Daily , Weekly | |
| Add HMN to Watchlist: View: Get Complete HMN Trend Analysis ➞ | |
 | BLFS BioLife Solutions, Inc. |
| Sector: Health Care | |
| SubSector: Medical Instruments & Supplies | |
| MarketCap: 264.36 Millions | |
| Recent Price: 17.53 Smart Investing & Trading Score: 93 | |
| Day Percent Change: 3.97% Day Change: 0.67 | |
| Week Change: 10.53% Year-to-date Change: 7.9% | |
| BLFS Links: Profile News Message Board | |
| Charts:- Daily , Weekly | |
| Add BLFS to Watchlist: View: Get Complete BLFS Trend Analysis ➞ | |
 | TTMI TTM Technologies, Inc. |
| Sector: Technology | |
| SubSector: Printed Circuit Boards | |
| MarketCap: 1028.35 Millions | |
| Recent Price: 15.13 Smart Investing & Trading Score: 93 | |
| Day Percent Change: 2.37% Day Change: 0.35 | |
| Week Change: 7.69% Year-to-date Change: -4.3% | |
| TTMI Links: Profile News Message Board | |
| Charts:- Daily , Weekly | |
| Add TTMI to Watchlist: View: Get Complete TTMI Trend Analysis ➞ | |
 | PLXS Plexus Corp. |
| Sector: Technology | |
| SubSector: Printed Circuit Boards | |
| MarketCap: 1457.15 Millions | |
| Recent Price: 100.28 Smart Investing & Trading Score: 93 | |
| Day Percent Change: 1.20% Day Change: 1.19 | |
| Week Change: 7.55% Year-to-date Change: -7.3% | |
| PLXS Links: Profile News Message Board | |
| Charts:- Daily , Weekly | |
| Add PLXS to Watchlist: View: Get Complete PLXS Trend Analysis ➞ | |
 | TSQ Townsquare Media, Inc. |
| Sector: Services & Goods | |
| SubSector: Broadcasting - Radio | |
| MarketCap: 101.795 Millions | |
| Recent Price: 12.24 Smart Investing & Trading Score: 93 | |
| Day Percent Change: 0.91% Day Change: 0.11 | |
| Week Change: 2.77% Year-to-date Change: 15.9% | |
| TSQ Links: Profile News Message Board | |
| Charts:- Daily , Weekly | |
| Add TSQ to Watchlist: View: Get Complete TSQ Trend Analysis ➞ | |
 | NBTB NBT Bancorp Inc. |
| Sector: Financials | |
| SubSector: Regional - Northeast Banks | |
| MarketCap: 1451.89 Millions | |
| Recent Price: 35.97 Smart Investing & Trading Score: 93 | |
| Day Percent Change: 0.64% Day Change: 0.23 | |
| Week Change: 3.93% Year-to-date Change: -14.2% | |
| NBTB Links: Profile News Message Board | |
| Charts:- Daily , Weekly | |
| Add NBTB to Watchlist: View: Get Complete NBTB Trend Analysis ➞ | |
 | NPK National Presto Industries, Inc. |
| Sector: Industrials | |
| SubSector: Aerospace/Defense Products & Services | |
| MarketCap: 540.401 Millions | |
| Recent Price: 82.98 Smart Investing & Trading Score: 93 | |
| Day Percent Change: 0.04% Day Change: 0.03 | |
| Week Change: 1.69% Year-to-date Change: 3.4% | |
| NPK Links: Profile News Message Board | |
| Charts:- Daily , Weekly | |
| Add NPK to Watchlist: View: Get Complete NPK Trend Analysis ➞ | |
 | CHCO City Holding Company |
| Sector: Financials | |
| SubSector: Regional - Mid-Atlantic Banks | |
| MarketCap: 1059.59 Millions | |
| Recent Price: 104.11 Smart Investing & Trading Score: 93 | |
| Day Percent Change: -1.05% Day Change: -1.10 | |
| Week Change: 1.07% Year-to-date Change: -5.6% | |
| CHCO Links: Profile News Message Board | |
| Charts:- Daily , Weekly | |
| Add CHCO to Watchlist: View: Get Complete CHCO Trend Analysis ➞ | |
| Too many stocks? View smallcap stocks filtered by marketcap & sector |
| Marketcap: All SmallCap Stocks (default-no microcap), Large, Mid-Range, Small & MicroCap |
| Sector: Tech, Finance, Energy, Staples, Retail, Industrial, Materials, Utilities & Medical |
|
Best Stocks Today 12Stocks.com |
© 2024 12Stocks.com Terms & Conditions Privacy Contact Us
All Information Provided Only For Education And Not To Be Used For Investing or Trading. See Terms & Conditions


One More Thing ... Get Best Stocks Delivered Daily!
Never Ever Miss A Move With Our Top Ten Stocks Lists
Find Best Stocks In Any Market - Bull or Bear Market
Take A Peek At Our Top Ten Stocks Lists: Daily, Weekly, Year-to-Date & Top Trends
Find Best Stocks In Any Market - Bull or Bear Market
Take A Peek At Our Top Ten Stocks Lists: Daily, Weekly, Year-to-Date & Top Trends
Smallcap Stocks With Best Up Trends [0-bearish to 100-bullish]: Cullinan Oncology[100], NextNav [100], MBIA [100], Reservoir Media[100], B. Riley[100], Braemar Hotels[100], Pactiv Evergreen[100], Wolverine World[100], Haemonetics [100], Benchmark Electronics[100], Uniti Group[100]
Best Smallcap Stocks Year-to-Date:
CareMax [568.04%], Janux [341.65%], Viking [299.3%], Alpine Immune[239.21%], Longboard [222.09%], Super Micro[201.64%], Avidity Biosciences[166.81%], Arcutis Bio[162.23%], Vera [156.27%], Cullinan Oncology[147.08%], Hippo [141.6%] Best Smallcap Stocks This Week:
Matterport [170.98%], B. Riley[84.19%], Cullinan Oncology[60.86%], Seres [47.35%], Zura Bio[38.67%], Universal Logistics[36.84%], Tutor Perini[33.89%], Riot Blockchain[30.67%], IGM Biosciences[30.56%], Impinj [29.74%], Sonic Automotive[28.14%] Best Smallcap Stocks Daily:
Universal Logistics[39.37%], Zura Bio[31.90%], Cullinan Oncology[30.86%], Tutor Perini[28.01%], IGM Biosciences[23.36%], U.S. Silica[21.67%], Maxeon Solar[20.17%], Exponent [19.49%], TPI Composites[16.32%], OptimizeRx [14.84%], Solaris Oilfield[13.95%]