
 Login Sign Up


| |||||
 |  | ||||

| 12Stocks.com Market Intelligence |
Best SmallCap Stocks
|
| In a hurry? Small Cap Stock Lists: Performance Trends Table, Stock Charts
Sort Small Cap stocks: Daily, Weekly, Year-to-Date, Market Cap & Trends. Filter Small Cap stocks list by sector: Show all, Tech, Finance, Energy, Staples, Retail, Industrial, Materials, Utilities and HealthCare Filter Small Cap stocks list by size: All Large Medium Small and MicroCap |
| 12Stocks.com Small Cap Stocks Performances & Trends Daily | |||||||||
|
|  The overall Smart Investing & Trading Score is 70 (0-bearish to 100-bullish) which puts Small Cap index in short term neutral to bullish trend. The Smart Investing & Trading Score from previous trading session is 87 and hence a deterioration of trend.
| ||||||||
Here are the Smart Investing & Trading Scores of the most requested small cap stocks at 12Stocks.com (click stock name for detailed review):
|


| 12Stocks.com: Investing in Smallcap Index with Stocks | |
|
The following table helps investors and traders sort through current performance and trends (as measured by Smart Investing & Trading Score) of various
stocks in the Smallcap Index. Quick View: Move mouse or cursor over stock symbol (ticker) to view short-term technical chart and over stock name to view long term chart. Click on  to add stock symbol to your watchlist and to add stock symbol to your watchlist and  to view watchlist. Click on any ticker or stock name for detailed market intelligence report for that stock. to view watchlist. Click on any ticker or stock name for detailed market intelligence report for that stock. |
12Stocks.com Performance of Stocks in Smallcap Index
| Ticker | Stock Name | Watchlist | Category | Recent Price | Smart Investing & Trading Score | Change % | YTD Change% |
| CMAX | CareMax |   | Health Care | 3.24 | 25 | -0.31% | 568.04% |
| RICK | RCI Hospitality | | Services & Goods | 50.72 | 25 | -0.08% | -23.45% |
| ANNX | Annexon | | Health Care | 4.85 | 25 | 2.54% | 6.36% |
| BCC | Boise Cascade | | Industrials | 133.49 | 25 | 2.15% | 3.19% |
| TIPT | Tiptree | | Financials | 16.54 | 25 | 1.91% | -12.76% |
| PFIS | Peoples Financial | | Financials | 38.30 | 25 | 1.06% | -21.36% |
| KWR | Quaker Chemical | | Materials | 188.82 | 25 | 0.88% | -11.52% |
| WMK | Weis Markets | | Services & Goods | 63.42 | 25 | 0.47% | -0.84% |
| PLAY | Dave & Buster s Entertainment | | Services & Goods | 52.72 | 25 | 0.24% | -2.11% |
| ALG | Alamo Group | | Industrials | 194.54 | 25 | 0.24% | -7.45% |
| MTRN | Materion | | Materials | 109.47 | 25 | 0.05% | -15.88% |
| UBSI | United Bankshares | | Financials | 33.93 | 25 | 0.03% | -9.64% |
| GIII | G-III Apparel | | Consumer Staples | 27.83 | 25 | -2.01% | -18.10% |
| VVI | Viad Corp | | Services & Goods | 34.14 | 25 | -1.33% | -5.69% |
| EVH | Evolent Health | | Technology | 27.38 | 25 | -0.83% | -17.11% |
| MLNK | MeridianLink | | Technology | 17.39 | 24 | 0.72% | -29.81% |
| CNK | Cinemark | | Services & Goods | 17.39 | 23 | 0.03% | 23.39% |
| RGR | Sturm Ruger | | Industrials | 42.99 | 23 | -7.20% | -5.40% |
| CFFN | Capitol Federal | | Financials | 5.12 | 23 | 1.09% | -20.70% |
| WISH | ContextLogic | | Services & Goods | 5.32 | 23 | -1.66% | -10.51% |
| ATEX | Anterix | | Technology | 31.61 | 23 | -0.63% | -5.15% |
| HBI | Hanesbrands | | Consumer Staples | 4.47 | 23 | -0.45% | 0.22% |
| VZIO | VIZIO Holding | | Technology | 10.51 | 23 | -0.24% | 36.25% |
| IMRX | Immuneering | | Health Care | 1.63 | 22 | 4.17% | -78.59% |
| JBLU | JetBlue Airways | | Transports | 5.71 | 22 | 0.88% | 2.88% |


| Too many stocks? View smallcap stocks filtered by marketcap & sector |
| Marketcap: All SmallCap Stocks (default-no microcap), Large, Mid-Range, Small |
| Smallcap Sector: Tech, Finance, Energy, Staples, Retail, Industrial, Materials, & Medical |
|
Get the most comprehensive stock market coverage daily at 12Stocks.com ➞ Best Stocks Today ➞ Best Stocks Weekly ➞ Best Stocks Year-to-Date ➞ Best Stocks Trends ➞  Best Stocks Today 12Stocks.com Best Nasdaq Stocks ➞ Best S&P 500 Stocks ➞ Best Tech Stocks ➞ Best Biotech Stocks ➞ |
| Detailed Overview of SmallCap Stocks |
| SmallCap Technical Overview, Leaders & Laggards, Top SmallCap ETF Funds & Detailed SmallCap Stocks List, Charts, Trends & More |
| Smallcap: Technical Analysis, Trends & YTD Performance | |
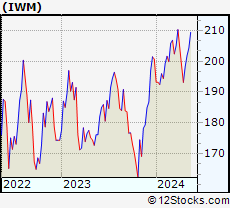
| SmallCap segment as represented by
IWM, an exchange-traded fund [ETF], holds basket of thousands of smallcap stocks from across all major sectors of the US stock market. The smallcap index (contains stocks like Riverbed & Sotheby's) is up by 1.45% and is currently underperforming the overall market by -6.57% year-to-date. Below is a quick view of technical charts and trends: | |
 IWM Weekly Chart |
|
| Long Term Trend: Deteriorating | |
| Medium Term Trend: Very Good | |
 IWM Daily Chart |
|
| Short Term Trend: Good | |
| Overall Trend Score: 70 | |
| YTD Performance: 1.45% | |
| **Trend Scores & Views Are Only For Educational Purposes And Not For Investing | |
| 12Stocks.com: Top Performing Small Cap Index Stocks | ||||||||||||||||||||||||||||||||||||||||||||||||
 The top performing Small Cap Index stocks year to date are
Now, more recently, over last week, the top performing Small Cap Index stocks on the move are


|
||||||||||||||||||||||||||||||||||||||||||||||||
| 12Stocks.com: Investing in Smallcap Index using Exchange Traded Funds | |
|
The following table shows list of key exchange traded funds (ETF) that
help investors track Smallcap index. The following list also includes leveraged ETF funds that track twice or thrice the daily returns of Smallcap indices. Short or inverse ETF funds move in the opposite direction to the index they track and are useful during market pullbacks or during bear markets. Quick View: Move mouse or cursor over ETF symbol (ticker) to view short-term technical chart and over ETF name to view long term chart. Click on ticker or stock name for detailed view. Click on to add stock symbol to your watchlist and to view watchlist. |
12Stocks.com List of ETFs that track Smallcap Index
| Ticker | ETF Name | Watchlist | Recent Price | Smart Investing & Trading Score | Change % | Week % | Year-to-date % |
| IWM | iShares Russell 2000 | | 203.62 | 70 | -0.66 | 0.85 | 1.45% |
| IJR | iShares Core S&P Small-Cap | | 108.15 | 58 | -0.44 | 0.95 | -0.1% |
| IWN | iShares Russell 2000 Value | | 155.08 | 76 | -0.35 | 0.56 | -0.16% |
| VTWO | Vanguard Russell 2000 ETF | | 82.27 | 57 | -0.69 | 0.81 | 1.44% |
| IWO | iShares Russell 2000 Growth | | 259.82 | 57 | -0.95 | 1.15 | 3.01% |
| IJS | iShares S&P Small-Cap 600 Value | | 99.06 | 40 | -0.62 | 0.34 | -3.89% |
| IJT | iShares S&P Small-Cap 600 Growth | | 128.54 | 71 | -1.00 | 0.61 | 2.72% |
| XSLV | PowerShares S&P SmallCap Low Volatil ETF | | 43.77 | 95 | -0.52 | 1.27 | -0.86% |
| SDD | ProShares UltraShort SmallCap600 | | 18.66 | 40 | 2.43 | -0.98 | 1.27% |
| SMLV | SPDR SSGA US Small Cap Low Volatil ETF | | 109.87 | 63 | -0.55 | 0.17 | -2.36% |
| SBB | ProShares Short SmallCap600 | | 16.11 | 25 | 0.91 | -0.28 | 1.16% |
| SAA | ProShares Ultra SmallCap600 | | 24.21 | 70 | -0.75 | 2.62 | -2.98% |
| 12Stocks.com: Charts, Trends, Fundamental Data and Performances of SmallCap Stocks | |
|
We now take in-depth look at all SmallCap stocks including charts, multi-period performances and overall trends (as measured by Smart Investing & Trading Score). One can sort SmallCap stocks (click link to choose) by Daily, Weekly and by Year-to-Date performances. Also, one can sort by size of the company or by market capitalization. |
| Select Your Default Chart Type: | |||||
| |||||
| Click on stock symbol or name for detailed view. Click on to add stock symbol to your watchlist and to view watchlist. Quick View: Move mouse or cursor over "Daily" to quickly view daily technical stock chart and over "Weekly" to view weekly technical stock chart. | |||||

 | CMAX CareMax, Inc. |
| Sector: Health Care | |
| SubSector: Health Information Services | |
| MarketCap: 371 Millions | |
| Recent Price: 3.24 Smart Investing & Trading Score: 25 | |
| Day Percent Change: -0.31% Day Change: -0.01 | |
| Week Change: -6.09% Year-to-date Change: 568.0% | |
| CMAX Links: Profile News Message Board | |
| Charts:- Daily , Weekly | |
| Add CMAX to Watchlist: View: Get Complete CMAX Trend Analysis ➞ | |
 | RICK RCI Hospitality Holdings, Inc. |
| Sector: Services & Goods | |
| SubSector: Restaurants | |
| MarketCap: 93 Millions | |
| Recent Price: 50.72 Smart Investing & Trading Score: 25 | |
| Day Percent Change: -0.08% Day Change: -0.04 | |
| Week Change: -0.49% Year-to-date Change: -23.5% | |
| RICK Links: Profile News Message Board | |
| Charts:- Daily , Weekly | |
| Add RICK to Watchlist: View: Get Complete RICK Trend Analysis ➞ | |
 | ANNX Annexon, Inc. |
| Sector: Health Care | |
| SubSector: Biotechnology | |
| MarketCap: 94487 Millions | |
| Recent Price: 4.85 Smart Investing & Trading Score: 25 | |
| Day Percent Change: 2.54% Day Change: 0.12 | |
| Week Change: -0.82% Year-to-date Change: 6.4% | |
| ANNX Links: Profile News Message Board | |
| Charts:- Daily , Weekly | |
| Add ANNX to Watchlist: View: Get Complete ANNX Trend Analysis ➞ | |
 | BCC Boise Cascade Company |
| Sector: Industrials | |
| SubSector: Lumber, Wood Production | |
| MarketCap: 963.938 Millions | |
| Recent Price: 133.49 Smart Investing & Trading Score: 25 | |
| Day Percent Change: 2.15% Day Change: 2.82 | |
| Week Change: -1.89% Year-to-date Change: 3.2% | |
| BCC Links: Profile News Message Board | |
| Charts:- Daily , Weekly | |
| Add BCC to Watchlist: View: Get Complete BCC Trend Analysis ➞ | |
 | TIPT Tiptree Inc. |
| Sector: Financials | |
| SubSector: Life Insurance | |
| MarketCap: 183.486 Millions | |
| Recent Price: 16.54 Smart Investing & Trading Score: 25 | |
| Day Percent Change: 1.91% Day Change: 0.31 | |
| Week Change: -0.66% Year-to-date Change: -12.8% | |
| TIPT Links: Profile News Message Board | |
| Charts:- Daily , Weekly | |
| Add TIPT to Watchlist: View: Get Complete TIPT Trend Analysis ➞ | |
 | PFIS Peoples Financial Services Corp. |
| Sector: Financials | |
| SubSector: Regional - Northeast Banks | |
| MarketCap: 305.499 Millions | |
| Recent Price: 38.30 Smart Investing & Trading Score: 25 | |
| Day Percent Change: 1.06% Day Change: 0.40 | |
| Week Change: -3.28% Year-to-date Change: -21.4% | |
| PFIS Links: Profile News Message Board | |
| Charts:- Daily , Weekly | |
| Add PFIS to Watchlist: View: Get Complete PFIS Trend Analysis ➞ | |
 | KWR Quaker Chemical Corporation |
| Sector: Materials | |
| SubSector: Specialty Chemicals | |
| MarketCap: 2411.67 Millions | |
| Recent Price: 188.82 Smart Investing & Trading Score: 25 | |
| Day Percent Change: 0.88% Day Change: 1.64 | |
| Week Change: 1.76% Year-to-date Change: -11.5% | |
| KWR Links: Profile News Message Board | |
| Charts:- Daily , Weekly | |
| Add KWR to Watchlist: View: Get Complete KWR Trend Analysis ➞ | |
 | WMK Weis Markets, Inc. |
| Sector: Services & Goods | |
| SubSector: Grocery Stores | |
| MarketCap: 1148.75 Millions | |
| Recent Price: 63.42 Smart Investing & Trading Score: 25 | |
| Day Percent Change: 0.47% Day Change: 0.29 | |
| Week Change: 0.4% Year-to-date Change: -0.8% | |
| WMK Links: Profile News Message Board | |
| Charts:- Daily , Weekly | |
| Add WMK to Watchlist: View: Get Complete WMK Trend Analysis ➞ | |
 | PLAY Dave & Buster s Entertainment, Inc. |
| Sector: Services & Goods | |
| SubSector: Restaurants | |
| MarketCap: 283.07 Millions | |
| Recent Price: 52.72 Smart Investing & Trading Score: 25 | |
| Day Percent Change: 0.24% Day Change: 0.13 | |
| Week Change: -0.2% Year-to-date Change: -2.1% | |
| PLAY Links: Profile News Message Board | |
| Charts:- Daily , Weekly | |
| Add PLAY to Watchlist: View: Get Complete PLAY Trend Analysis ➞ | |
 | ALG Alamo Group Inc. |
| Sector: Industrials | |
| SubSector: Farm & Construction Machinery | |
| MarketCap: 964.107 Millions | |
| Recent Price: 194.54 Smart Investing & Trading Score: 25 | |
| Day Percent Change: 0.24% Day Change: 0.47 | |
| Week Change: 0.29% Year-to-date Change: -7.5% | |
| ALG Links: Profile News Message Board | |
| Charts:- Daily , Weekly | |
| Add ALG to Watchlist: View: Get Complete ALG Trend Analysis ➞ | |
 | MTRN Materion Corporation |
| Sector: Materials | |
| SubSector: Industrial Metals & Minerals | |
| MarketCap: 703.71 Millions | |
| Recent Price: 109.47 Smart Investing & Trading Score: 25 | |
| Day Percent Change: 0.05% Day Change: 0.05 | |
| Week Change: 2.09% Year-to-date Change: -15.9% | |
| MTRN Links: Profile News Message Board | |
| Charts:- Daily , Weekly | |
| Add MTRN to Watchlist: View: Get Complete MTRN Trend Analysis ➞ | |
 | UBSI United Bankshares, Inc. |
| Sector: Financials | |
| SubSector: Regional - Mid-Atlantic Banks | |
| MarketCap: 2286.79 Millions | |
| Recent Price: 33.93 Smart Investing & Trading Score: 25 | |
| Day Percent Change: 0.03% Day Change: 0.01 | |
| Week Change: -0.09% Year-to-date Change: -9.6% | |
| UBSI Links: Profile News Message Board | |
| Charts:- Daily , Weekly | |
| Add UBSI to Watchlist: View: Get Complete UBSI Trend Analysis ➞ | |
 | GIII G-III Apparel Group, Ltd. |
| Sector: Consumer Staples | |
| SubSector: Textile - Apparel Clothing | |
| MarketCap: 354.365 Millions | |
| Recent Price: 27.83 Smart Investing & Trading Score: 25 | |
| Day Percent Change: -2.01% Day Change: -0.57 | |
| Week Change: -2.66% Year-to-date Change: -18.1% | |
| GIII Links: Profile News Message Board | |
| Charts:- Daily , Weekly | |
| Add GIII to Watchlist: View: Get Complete GIII Trend Analysis ➞ | |
 | VVI Viad Corp |
| Sector: Services & Goods | |
| SubSector: Business Services | |
| MarketCap: 270.682 Millions | |
| Recent Price: 34.14 Smart Investing & Trading Score: 25 | |
| Day Percent Change: -1.33% Day Change: -0.46 | |
| Week Change: -0.18% Year-to-date Change: -5.7% | |
| VVI Links: Profile News Message Board | |
| Charts:- Daily , Weekly | |
| Add VVI to Watchlist: View: Get Complete VVI Trend Analysis ➞ | |
 | EVH Evolent Health, Inc. |
| Sector: Technology | |
| SubSector: Healthcare Information Services | |
| MarketCap: 486.755 Millions | |
| Recent Price: 27.38 Smart Investing & Trading Score: 25 | |
| Day Percent Change: -0.83% Day Change: -0.23 | |
| Week Change: 1.03% Year-to-date Change: -17.1% | |
| EVH Links: Profile News Message Board | |
| Charts:- Daily , Weekly | |
| Add EVH to Watchlist: View: Get Complete EVH Trend Analysis ➞ | |
 | MLNK MeridianLink, Inc. |
| Sector: Technology | |
| SubSector: Software - Application | |
| MarketCap: 1630 Millions | |
| Recent Price: 17.39 Smart Investing & Trading Score: 24 | |
| Day Percent Change: 0.72% Day Change: 0.13 | |
| Week Change: 0.9% Year-to-date Change: -29.8% | |
| MLNK Links: Profile News Message Board | |
| Charts:- Daily , Weekly | |
| Add MLNK to Watchlist: View: Get Complete MLNK Trend Analysis ➞ | |
 | CNK Cinemark Holdings, Inc. |
| Sector: Services & Goods | |
| SubSector: Movie Production, Theaters | |
| MarketCap: 1776.29 Millions | |
| Recent Price: 17.39 Smart Investing & Trading Score: 23 | |
| Day Percent Change: 0.03% Day Change: 0.01 | |
| Week Change: -1.89% Year-to-date Change: 23.4% | |
| CNK Links: Profile News Message Board | |
| Charts:- Daily , Weekly | |
| Add CNK to Watchlist: View: Get Complete CNK Trend Analysis ➞ | |
 | RGR Sturm, Ruger & Company, Inc. |
| Sector: Industrials | |
| SubSector: Aerospace/Defense Products & Services | |
| MarketCap: 752 Millions | |
| Recent Price: 42.99 Smart Investing & Trading Score: 23 | |
| Day Percent Change: -7.20% Day Change: -3.34 | |
| Week Change: -8.37% Year-to-date Change: -5.4% | |
| RGR Links: Profile News Message Board | |
| Charts:- Daily , Weekly | |
| Add RGR to Watchlist: View: Get Complete RGR Trend Analysis ➞ | |
 | CFFN Capitol Federal Financial, Inc. |
| Sector: Financials | |
| SubSector: Savings & Loans | |
| MarketCap: 1639.1 Millions | |
| Recent Price: 5.12 Smart Investing & Trading Score: 23 | |
| Day Percent Change: 1.09% Day Change: 0.06 | |
| Week Change: 0.89% Year-to-date Change: -20.7% | |
| CFFN Links: Profile News Message Board | |
| Charts:- Daily , Weekly | |
| Add CFFN to Watchlist: View: Get Complete CFFN Trend Analysis ➞ | |
 | WISH ContextLogic Inc. |
| Sector: Services & Goods | |
| SubSector: Internet Retail | |
| MarketCap: 165 Millions | |
| Recent Price: 5.32 Smart Investing & Trading Score: 23 | |
| Day Percent Change: -1.66% Day Change: -0.09 | |
| Week Change: 0.19% Year-to-date Change: -10.5% | |
| WISH Links: Profile News Message Board | |
| Charts:- Daily , Weekly | |
| Add WISH to Watchlist: View: Get Complete WISH Trend Analysis ➞ | |
 | ATEX Anterix Inc. |
| Sector: Technology | |
| SubSector: Telecom Services - Domestic | |
| MarketCap: 694.077 Millions | |
| Recent Price: 31.61 Smart Investing & Trading Score: 23 | |
| Day Percent Change: -0.63% Day Change: -0.20 | |
| Week Change: -1.17% Year-to-date Change: -5.2% | |
| ATEX Links: Profile News Message Board | |
| Charts:- Daily , Weekly | |
| Add ATEX to Watchlist: View: Get Complete ATEX Trend Analysis ➞ | |
 | HBI Hanesbrands Inc. |
| Sector: Consumer Staples | |
| SubSector: Textile - Apparel Clothing | |
| MarketCap: 3559.75 Millions | |
| Recent Price: 4.47 Smart Investing & Trading Score: 23 | |
| Day Percent Change: -0.45% Day Change: -0.02 | |
| Week Change: 0.68% Year-to-date Change: 0.2% | |
| HBI Links: Profile News Message Board | |
| Charts:- Daily , Weekly | |
| Add HBI to Watchlist: View: Get Complete HBI Trend Analysis ➞ | |
 | VZIO VIZIO Holding Corp. |
| Sector: Technology | |
| SubSector: Consumer Electronics | |
| MarketCap: 1300 Millions | |
| Recent Price: 10.51 Smart Investing & Trading Score: 23 | |
| Day Percent Change: -0.24% Day Change: -0.02 | |
| Week Change: -0.85% Year-to-date Change: 36.3% | |
| VZIO Links: Profile News Message Board | |
| Charts:- Daily , Weekly | |
| Add VZIO to Watchlist: View: Get Complete VZIO Trend Analysis ➞ | |
 | IMRX Immuneering Corporation |
| Sector: Health Care | |
| SubSector: Biotechnology | |
| MarketCap: 303 Millions | |
| Recent Price: 1.63 Smart Investing & Trading Score: 22 | |
| Day Percent Change: 4.17% Day Change: 0.06 | |
| Week Change: 0.31% Year-to-date Change: -78.6% | |
| IMRX Links: Profile News Message Board | |
| Charts:- Daily , Weekly | |
| Add IMRX to Watchlist: View: Get Complete IMRX Trend Analysis ➞ | |
 | JBLU JetBlue Airways Corporation |
| Sector: Transports | |
| SubSector: Regional Airlines | |
| MarketCap: 2383.1 Millions | |
| Recent Price: 5.71 Smart Investing & Trading Score: 22 | |
| Day Percent Change: 0.88% Day Change: 0.05 | |
| Week Change: -1.55% Year-to-date Change: 2.9% | |
| JBLU Links: Profile News Message Board | |
| Charts:- Daily , Weekly | |
| Add JBLU to Watchlist: View: Get Complete JBLU Trend Analysis ➞ | |
| Too many stocks? View smallcap stocks filtered by marketcap & sector |
| Marketcap: All SmallCap Stocks (default-no microcap), Large, Mid-Range, Small & MicroCap |
| Sector: Tech, Finance, Energy, Staples, Retail, Industrial, Materials, Utilities & Medical |
|
Best Stocks Today 12Stocks.com |
© 2024 12Stocks.com Terms & Conditions Privacy Contact Us
All Information Provided Only For Education And Not To Be Used For Investing or Trading. See Terms & Conditions


One More Thing ... Get Best Stocks Delivered Daily!
Never Ever Miss A Move With Our Top Ten Stocks Lists
Find Best Stocks In Any Market - Bull or Bear Market
Take A Peek At Our Top Ten Stocks Lists: Daily, Weekly, Year-to-Date & Top Trends
Find Best Stocks In Any Market - Bull or Bear Market
Take A Peek At Our Top Ten Stocks Lists: Daily, Weekly, Year-to-Date & Top Trends
Smallcap Stocks With Best Up Trends [0-bearish to 100-bullish]: Cricut [100], DASAN Zhone[100], Hyster-Yale Materials[100], Latham Group[100], Alpha and[100], Vigil Neuroscience[100], Myriad Genetics[100], Hannon Armstrong[100], Ardmore Shipping[100], Pacira BioSciences[100], Wolverine World[100]
Best Smallcap Stocks Year-to-Date:
CareMax [568.04%], Janux [398.37%], Viking [325.04%], Bakkt [273.09%], Longboard [253.85%], Alpine Immune[239.73%], Super Micro[190.86%], Avidity Biosciences[186.17%], Vera [183.88%], Cullinan Oncology[174.2%], Arcutis Bio[146.28%] Best Smallcap Stocks This Week:
DASAN Zhone[64.32%], Perficient [52.7%], Innodata [49.03%], Vigil Neuroscience[37.87%], Latham Group[37.73%], Cricut [37.35%], Thoughtworks Holding[34.67%], Children s[31.88%], Great Lakes[31.03%], Outset Medical[30.19%], Hyster-Yale Materials[26.56%] Best Smallcap Stocks Daily:
Innodata [48.59%], Cricut [42.31%], DASAN Zhone[30.11%], Hyster-Yale Materials[26.08%], Latham Group[25.75%], Ameresco [21.54%], Alpha and[20.06%], iRobot [19.18%], Vigil Neuroscience[17.55%], Myriad Genetics[17.09%], PowerSchool [16.53%]