
 Login Sign Up


| |||||
 |  | ||||

| 12Stocks.com Market Intelligence |
Best SmallCap Stocks
|
| In a hurry? Small Cap Stock Lists: Performance Trends Table, Stock Charts
Sort Small Cap stocks: Daily, Weekly, Year-to-Date, Market Cap & Trends. Filter Small Cap stocks list by sector: Show all, Tech, Finance, Energy, Staples, Retail, Industrial, Materials, Utilities and HealthCare Filter Small Cap stocks list by size: All Large Medium Small and MicroCap |
| 12Stocks.com Small Cap Stocks Performances & Trends Daily | |||||||||
|
|  The overall Smart Investing & Trading Score is 83 (0-bearish to 100-bullish) which puts Small Cap index in short term bullish trend. The Smart Investing & Trading Score from previous trading session is 76 and hence an improvement of trend.
| ||||||||
Here are the Smart Investing & Trading Scores of the most requested small cap stocks at 12Stocks.com (click stock name for detailed review):
|


| 12Stocks.com: Investing in Smallcap Index with Stocks | |
|
The following table helps investors and traders sort through current performance and trends (as measured by Smart Investing & Trading Score) of various
stocks in the Smallcap Index. Quick View: Move mouse or cursor over stock symbol (ticker) to view short-term technical chart and over stock name to view long term chart. Click on  to add stock symbol to your watchlist and to add stock symbol to your watchlist and  to view watchlist. Click on any ticker or stock name for detailed market intelligence report for that stock. to view watchlist. Click on any ticker or stock name for detailed market intelligence report for that stock. |
12Stocks.com Performance of Stocks in Smallcap Index
| Ticker | Stock Name | Watchlist | Category | Recent Price | Smart Investing & Trading Score | Change % | YTD Change% |
| RAPT | RAPT |   | Health Care | 3.99 | 20 | -1.24% | -83.94% |
| NOVA | Sunnova Energy | | Services & Goods | 4.15 | 20 | -1.19% | -72.79% |
| IRWD | Ironwood | | Health Care | 6.42 | 20 | -0.93% | -43.88% |
| LNN | Lindsay | | Industrials | 116.04 | 20 | -0.86% | -10.16% |
| RLJ | RLJ Lodging | | Financials | 10.31 | 20 | -0.58% | -12.03% |
| VIR | Vir | | Health Care | 9.69 | 20 | -0.41% | -3.68% |
| INFU | InfuSystem | | Health Care | 6.49 | 20 | -0.31% | -38.43% |
| PBPB | Potbelly | | Services & Goods | 8.71 | 20 | -0.23% | -16.41% |
| SHLS | Shoals | | Technology | 6.40 | 20 | -0.16% | -58.71% |
| DRH | DiamondRock Hospitality | | Financials | 8.43 | 20 | -0.12% | -10.22% |
| EOSE | Eos Energy | | Industrials | 0.71 | 20 | -0.06% | -34.86% |
| DNOW | NOW | | Energy | 13.96 | 18 | 2.50% | 23.32% |
| IPAR | Inter Parfums | | Consumer Staples | 118.98 | 18 | -4.43% | -17.38% |
| SBH | Sally Beauty | | Services & Goods | 10.72 | 18 | -3.16% | -19.28% |
| HVT | Haverty Furniture | | Services & Goods | 28.80 | 18 | -2.11% | -18.87% |
| ESRT | Empire State | | Financials | 9.35 | 18 | -1.99% | -3.51% |
| CBNK | Capital Bancorp | | Financials | 20.11 | 18 | -1.71% | -16.90% |
| NABL | N-able | | Technology | 12.63 | 18 | -1.17% | -5.07% |
| CLDT | Chatham Lodging | | Financials | 8.95 | 18 | -0.78% | -16.51% |
| PSTL | Postal Realty | | Financials | 13.69 | 18 | -0.29% | -5.98% |
| SES | SES AI | | Services & Goods | 1.32 | 17 | 4.76% | -26.26% |
| RRGB | Red Robin | | Services & Goods | 7.01 | 17 | 3.70% | -43.79% |
| GAMB | Gambling.com Group | | Services & Goods | 8.25 | 17 | 3.13% | -15.47% |
| PEPG | PepGen | | Health Care | 13.56 | 17 | 3.00% | 98.17% |
| BKE | Buckle | | Services & Goods | 37.58 | 17 | 1.62% | -20.92% |


| Too many stocks? View smallcap stocks filtered by marketcap & sector |
| Marketcap: All SmallCap Stocks (default-no microcap), Large, Mid-Range, Small |
| Smallcap Sector: Tech, Finance, Energy, Staples, Retail, Industrial, Materials, & Medical |
|
Get the most comprehensive stock market coverage daily at 12Stocks.com ➞ Best Stocks Today ➞ Best Stocks Weekly ➞ Best Stocks Year-to-Date ➞ Best Stocks Trends ➞  Best Stocks Today 12Stocks.com Best Nasdaq Stocks ➞ Best S&P 500 Stocks ➞ Best Tech Stocks ➞ Best Biotech Stocks ➞ |
| Detailed Overview of SmallCap Stocks |
| SmallCap Technical Overview, Leaders & Laggards, Top SmallCap ETF Funds & Detailed SmallCap Stocks List, Charts, Trends & More |
| Smallcap: Technical Analysis, Trends & YTD Performance | |
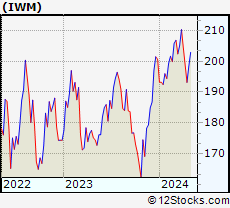
| SmallCap segment as represented by
IWM, an exchange-traded fund [ETF], holds basket of thousands of smallcap stocks from across all major sectors of the US stock market. The smallcap index (contains stocks like Riverbed & Sotheby's) is up by 3.9% and is currently underperforming the overall market by -6.79% year-to-date. Below is a quick view of technical charts and trends: | |
 IWM Weekly Chart |
|
| Long Term Trend: Very Good | |
| Medium Term Trend: Very Good | |
 IWM Daily Chart |
|
| Short Term Trend: Not Good | |
| Overall Trend Score: 83 | |
| YTD Performance: 3.9% | |
| **Trend Scores & Views Are Only For Educational Purposes And Not For Investing | |
| 12Stocks.com: Top Performing Small Cap Index Stocks | ||||||||||||||||||||||||||||||||||||||||||||||||
 The top performing Small Cap Index stocks year to date are
Now, more recently, over last week, the top performing Small Cap Index stocks on the move are


|
||||||||||||||||||||||||||||||||||||||||||||||||
| 12Stocks.com: Investing in Smallcap Index using Exchange Traded Funds | |
|
The following table shows list of key exchange traded funds (ETF) that
help investors track Smallcap index. The following list also includes leveraged ETF funds that track twice or thrice the daily returns of Smallcap indices. Short or inverse ETF funds move in the opposite direction to the index they track and are useful during market pullbacks or during bear markets. Quick View: Move mouse or cursor over ETF symbol (ticker) to view short-term technical chart and over ETF name to view long term chart. Click on ticker or stock name for detailed view. Click on to add stock symbol to your watchlist and to view watchlist. |
12Stocks.com List of ETFs that track Smallcap Index
| Ticker | ETF Name | Watchlist | Recent Price | Smart Investing & Trading Score | Change % | Week % | Year-to-date % |
| IWM | iShares Russell 2000 | | 208.54 | 83 | 0.22 | 0.22 | 3.9% |
| IJR | iShares Core S&P Small-Cap | | 110.22 | 76 | -0.15 | -0.15 | 1.82% |
| IWN | iShares Russell 2000 Value | | 158.19 | 76 | -0.33 | -0.33 | 1.84% |
| VTWO | Vanguard Russell 2000 ETF | | 84.35 | 71 | 0.29 | 0.29 | 4.01% |
| IWO | iShares Russell 2000 Growth | | 267.35 | 76 | 0.83 | 0.83 | 6% |
| IJS | iShares S&P Small-Cap 600 Value | | 101.20 | 69 | -0.66 | -0.66 | -1.81% |
| IJT | iShares S&P Small-Cap 600 Growth | | 131.76 | 83 | 0.32 | 0.32 | 5.29% |
| XSLV | PowerShares S&P SmallCap Low Volatil ETF | | 44.31 | 69 | -0.37 | -0.37 | 0.36% |
| SMLV | SPDR SSGA US Small Cap Low Volatil ETF | | 113.00 | 69 | -0.25 | -0.25 | 0.43% |
| SAA | ProShares Ultra SmallCap600 | | 25.10 | 71 | 0.79 | 0.79 | 0.6% |
| SBB | ProShares Short SmallCap600 | | 15.72 | 18 | -0.34 | -0.34 | -1.32% |
| SDD | ProShares UltraShort SmallCap600 | | 17.73 | 28 | -0.61 | -0.61 | -3.78% |
| 12Stocks.com: Charts, Trends, Fundamental Data and Performances of SmallCap Stocks | |
|
We now take in-depth look at all SmallCap stocks including charts, multi-period performances and overall trends (as measured by Smart Investing & Trading Score). One can sort SmallCap stocks (click link to choose) by Daily, Weekly and by Year-to-Date performances. Also, one can sort by size of the company or by market capitalization. |
| Select Your Default Chart Type: | |||||
| |||||
| Click on stock symbol or name for detailed view. Click on to add stock symbol to your watchlist and to view watchlist. Quick View: Move mouse or cursor over "Daily" to quickly view daily technical stock chart and over "Weekly" to view weekly technical stock chart. | |||||

 | RAPT RAPT Therapeutics, Inc. |
| Sector: Health Care | |
| SubSector: Biotechnology | |
| MarketCap: 368.785 Millions | |
| Recent Price: 3.99 Smart Investing & Trading Score: 20 | |
| Day Percent Change: -1.24% Day Change: -0.05 | |
| Week Change: -1.24% Year-to-date Change: -83.9% | |
| RAPT Links: Profile News Message Board | |
| Charts:- Daily , Weekly | |
| Add RAPT to Watchlist: View: Get Complete RAPT Trend Analysis ➞ | |
 | NOVA Sunnova Energy International Inc. |
| Sector: Services & Goods | |
| SubSector: Management Services | |
| MarketCap: 1180.45 Millions | |
| Recent Price: 4.15 Smart Investing & Trading Score: 20 | |
| Day Percent Change: -1.19% Day Change: -0.05 | |
| Week Change: -1.19% Year-to-date Change: -72.8% | |
| NOVA Links: Profile News Message Board | |
| Charts:- Daily , Weekly | |
| Add NOVA to Watchlist: View: Get Complete NOVA Trend Analysis ➞ | |
 | IRWD Ironwood Pharmaceuticals, Inc. |
| Sector: Health Care | |
| SubSector: Drugs - Generic | |
| MarketCap: 1616.35 Millions | |
| Recent Price: 6.42 Smart Investing & Trading Score: 20 | |
| Day Percent Change: -0.93% Day Change: -0.06 | |
| Week Change: -0.93% Year-to-date Change: -43.9% | |
| IRWD Links: Profile News Message Board | |
| Charts:- Daily , Weekly | |
| Add IRWD to Watchlist: View: Get Complete IRWD Trend Analysis ➞ | |
 | LNN Lindsay Corporation |
| Sector: Industrials | |
| SubSector: Farm & Construction Machinery | |
| MarketCap: 1097.57 Millions | |
| Recent Price: 116.04 Smart Investing & Trading Score: 20 | |
| Day Percent Change: -0.86% Day Change: -1.01 | |
| Week Change: -0.86% Year-to-date Change: -10.2% | |
| LNN Links: Profile News Message Board | |
| Charts:- Daily , Weekly | |
| Add LNN to Watchlist: View: Get Complete LNN Trend Analysis ➞ | |
 | RLJ RLJ Lodging Trust |
| Sector: Financials | |
| SubSector: REIT - Hotel/Motel | |
| MarketCap: 1019.34 Millions | |
| Recent Price: 10.31 Smart Investing & Trading Score: 20 | |
| Day Percent Change: -0.58% Day Change: -0.06 | |
| Week Change: -0.58% Year-to-date Change: -12.0% | |
| RLJ Links: Profile News Message Board | |
| Charts:- Daily , Weekly | |
| Add RLJ to Watchlist: View: Get Complete RLJ Trend Analysis ➞ | |
 | VIR Vir Biotechnology, Inc. |
| Sector: Health Care | |
| SubSector: Biotechnology | |
| MarketCap: 3916.75 Millions | |
| Recent Price: 9.69 Smart Investing & Trading Score: 20 | |
| Day Percent Change: -0.41% Day Change: -0.04 | |
| Week Change: -0.41% Year-to-date Change: -3.7% | |
| VIR Links: Profile News Message Board | |
| Charts:- Daily , Weekly | |
| Add VIR to Watchlist: View: Get Complete VIR Trend Analysis ➞ | |
 | INFU InfuSystem Holdings Inc. |
| Sector: Health Care | |
| SubSector: Medical Instruments & Supplies | |
| MarketCap: 136.76 Millions | |
| Recent Price: 6.49 Smart Investing & Trading Score: 20 | |
| Day Percent Change: -0.31% Day Change: -0.02 | |
| Week Change: -0.31% Year-to-date Change: -38.4% | |
| INFU Links: Profile News Message Board | |
| Charts:- Daily , Weekly | |
| Add INFU to Watchlist: View: Get Complete INFU Trend Analysis ➞ | |
 | PBPB Potbelly Corporation |
| Sector: Services & Goods | |
| SubSector: Specialty Eateries | |
| MarketCap: 58.8 Millions | |
| Recent Price: 8.71 Smart Investing & Trading Score: 20 | |
| Day Percent Change: -0.23% Day Change: -0.02 | |
| Week Change: -0.23% Year-to-date Change: -16.4% | |
| PBPB Links: Profile News Message Board | |
| Charts:- Daily , Weekly | |
| Add PBPB to Watchlist: View: Get Complete PBPB Trend Analysis ➞ | |
 | SHLS Shoals Technologies Group, Inc. |
| Sector: Technology | |
| SubSector: Solar | |
| MarketCap: 4360 Millions | |
| Recent Price: 6.40 Smart Investing & Trading Score: 20 | |
| Day Percent Change: -0.16% Day Change: -0.01 | |
| Week Change: -0.16% Year-to-date Change: -58.7% | |
| SHLS Links: Profile News Message Board | |
| Charts:- Daily , Weekly | |
| Add SHLS to Watchlist: View: Get Complete SHLS Trend Analysis ➞ | |
 | DRH DiamondRock Hospitality Company |
| Sector: Financials | |
| SubSector: REIT - Hotel/Motel | |
| MarketCap: 964 Millions | |
| Recent Price: 8.43 Smart Investing & Trading Score: 20 | |
| Day Percent Change: -0.12% Day Change: -0.01 | |
| Week Change: -0.12% Year-to-date Change: -10.2% | |
| DRH Links: Profile News Message Board | |
| Charts:- Daily , Weekly | |
| Add DRH to Watchlist: View: Get Complete DRH Trend Analysis ➞ | |
 | EOSE Eos Energy Enterprises, Inc. |
| Sector: Industrials | |
| SubSector: Electrical Equipment & Parts | |
| MarketCap: 76627 Millions | |
| Recent Price: 0.71 Smart Investing & Trading Score: 20 | |
| Day Percent Change: -0.06% Day Change: 0.00 | |
| Week Change: -0.06% Year-to-date Change: -34.9% | |
| EOSE Links: Profile News Message Board | |
| Charts:- Daily , Weekly | |
| Add EOSE to Watchlist: View: Get Complete EOSE Trend Analysis ➞ | |
 | DNOW NOW Inc. |
| Sector: Energy | |
| SubSector: Oil & Gas Equipment & Services | |
| MarketCap: 679.661 Millions | |
| Recent Price: 13.96 Smart Investing & Trading Score: 18 | |
| Day Percent Change: 2.50% Day Change: 0.34 | |
| Week Change: 2.5% Year-to-date Change: 23.3% | |
| DNOW Links: Profile News Message Board | |
| Charts:- Daily , Weekly | |
| Add DNOW to Watchlist: View: Get Complete DNOW Trend Analysis ➞ | |
 | IPAR Inter Parfums, Inc. |
| Sector: Consumer Staples | |
| SubSector: Personal Products | |
| MarketCap: 1302.55 Millions | |
| Recent Price: 118.98 Smart Investing & Trading Score: 18 | |
| Day Percent Change: -4.43% Day Change: -5.52 | |
| Week Change: -4.43% Year-to-date Change: -17.4% | |
| IPAR Links: Profile News Message Board | |
| Charts:- Daily , Weekly | |
| Add IPAR to Watchlist: View: Get Complete IPAR Trend Analysis ➞ | |
 | SBH Sally Beauty Holdings, Inc. |
| Sector: Services & Goods | |
| SubSector: Specialty Retail, Other | |
| MarketCap: 1229.44 Millions | |
| Recent Price: 10.72 Smart Investing & Trading Score: 18 | |
| Day Percent Change: -3.16% Day Change: -0.35 | |
| Week Change: -3.16% Year-to-date Change: -19.3% | |
| SBH Links: Profile News Message Board | |
| Charts:- Daily , Weekly | |
| Add SBH to Watchlist: View: Get Complete SBH Trend Analysis ➞ | |
 | HVT Haverty Furniture Companies, Inc. |
| Sector: Services & Goods | |
| SubSector: Home Furnishing Stores | |
| MarketCap: 253.125 Millions | |
| Recent Price: 28.80 Smart Investing & Trading Score: 18 | |
| Day Percent Change: -2.11% Day Change: -0.62 | |
| Week Change: -2.11% Year-to-date Change: -18.9% | |
| HVT Links: Profile News Message Board | |
| Charts:- Daily , Weekly | |
| Add HVT to Watchlist: View: Get Complete HVT Trend Analysis ➞ | |
 | ESRT Empire State Realty Trust, Inc. |
| Sector: Financials | |
| SubSector: REIT - Diversified | |
| MarketCap: 1632.13 Millions | |
| Recent Price: 9.35 Smart Investing & Trading Score: 18 | |
| Day Percent Change: -1.99% Day Change: -0.19 | |
| Week Change: -1.99% Year-to-date Change: -3.5% | |
| ESRT Links: Profile News Message Board | |
| Charts:- Daily , Weekly | |
| Add ESRT to Watchlist: View: Get Complete ESRT Trend Analysis ➞ | |
 | CBNK Capital Bancorp, Inc. |
| Sector: Financials | |
| SubSector: Savings & Loans | |
| MarketCap: 174.93 Millions | |
| Recent Price: 20.11 Smart Investing & Trading Score: 18 | |
| Day Percent Change: -1.71% Day Change: -0.35 | |
| Week Change: -1.71% Year-to-date Change: -16.9% | |
| CBNK Links: Profile News Message Board | |
| Charts:- Daily , Weekly | |
| Add CBNK to Watchlist: View: Get Complete CBNK Trend Analysis ➞ | |
 | NABL N-able, Inc. |
| Sector: Technology | |
| SubSector: Information Technology Services | |
| MarketCap: 2590 Millions | |
| Recent Price: 12.63 Smart Investing & Trading Score: 18 | |
| Day Percent Change: -1.17% Day Change: -0.15 | |
| Week Change: -1.17% Year-to-date Change: -5.1% | |
| NABL Links: Profile News Message Board | |
| Charts:- Daily , Weekly | |
| Add NABL to Watchlist: View: Get Complete NABL Trend Analysis ➞ | |
 | CLDT Chatham Lodging Trust |
| Sector: Financials | |
| SubSector: REIT - Hotel/Motel | |
| MarketCap: 274.734 Millions | |
| Recent Price: 8.95 Smart Investing & Trading Score: 18 | |
| Day Percent Change: -0.78% Day Change: -0.07 | |
| Week Change: -0.78% Year-to-date Change: -16.5% | |
| CLDT Links: Profile News Message Board | |
| Charts:- Daily , Weekly | |
| Add CLDT to Watchlist: View: Get Complete CLDT Trend Analysis ➞ | |
 | PSTL Postal Realty Trust, Inc. |
| Sector: Financials | |
| SubSector: REIT - Office | |
| MarketCap: 82.9866 Millions | |
| Recent Price: 13.69 Smart Investing & Trading Score: 18 | |
| Day Percent Change: -0.29% Day Change: -0.04 | |
| Week Change: -0.29% Year-to-date Change: -6.0% | |
| PSTL Links: Profile News Message Board | |
| Charts:- Daily , Weekly | |
| Add PSTL to Watchlist: View: Get Complete PSTL Trend Analysis ➞ | |
 | SES SES AI Corporation |
| Sector: Services & Goods | |
| SubSector: Auto Parts | |
| MarketCap: 893 Millions | |
| Recent Price: 1.32 Smart Investing & Trading Score: 17 | |
| Day Percent Change: 4.76% Day Change: 0.06 | |
| Week Change: 4.76% Year-to-date Change: -26.3% | |
| SES Links: Profile News Message Board | |
| Charts:- Daily , Weekly | |
| Add SES to Watchlist: View: Get Complete SES Trend Analysis ➞ | |
 | RRGB Red Robin Gourmet Burgers, Inc. |
| Sector: Services & Goods | |
| SubSector: Restaurants | |
| MarketCap: 121.57 Millions | |
| Recent Price: 7.01 Smart Investing & Trading Score: 17 | |
| Day Percent Change: 3.70% Day Change: 0.25 | |
| Week Change: 3.7% Year-to-date Change: -43.8% | |
| RRGB Links: Profile News Message Board | |
| Charts:- Daily , Weekly | |
| Add RRGB to Watchlist: View: Get Complete RRGB Trend Analysis ➞ | |
 | GAMB Gambling.com Group Limited |
| Sector: Services & Goods | |
| SubSector: Gambling | |
| MarketCap: 376 Millions | |
| Recent Price: 8.25 Smart Investing & Trading Score: 17 | |
| Day Percent Change: 3.13% Day Change: 0.25 | |
| Week Change: 3.13% Year-to-date Change: -15.5% | |
| GAMB Links: Profile News Message Board | |
| Charts:- Daily , Weekly | |
| Add GAMB to Watchlist: View: Get Complete GAMB Trend Analysis ➞ | |
 | PEPG PepGen Inc. |
| Sector: Health Care | |
| SubSector: Biotechnology | |
| MarketCap: 216 Millions | |
| Recent Price: 13.56 Smart Investing & Trading Score: 17 | |
| Day Percent Change: 3.00% Day Change: 0.39 | |
| Week Change: 3% Year-to-date Change: 98.2% | |
| PEPG Links: Profile News Message Board | |
| Charts:- Daily , Weekly | |
| Add PEPG to Watchlist: View: Get Complete PEPG Trend Analysis ➞ | |
 | BKE The Buckle, Inc. |
| Sector: Services & Goods | |
| SubSector: Apparel Stores | |
| MarketCap: 913.808 Millions | |
| Recent Price: 37.58 Smart Investing & Trading Score: 17 | |
| Day Percent Change: 1.62% Day Change: 0.60 | |
| Week Change: 1.62% Year-to-date Change: -20.9% | |
| BKE Links: Profile News Message Board | |
| Charts:- Daily , Weekly | |
| Add BKE to Watchlist: View: Get Complete BKE Trend Analysis ➞ | |
| Too many stocks? View smallcap stocks filtered by marketcap & sector |
| Marketcap: All SmallCap Stocks (default-no microcap), Large, Mid-Range, Small & MicroCap |
| Sector: Tech, Finance, Energy, Staples, Retail, Industrial, Materials, Utilities & Medical |
|
Best Stocks Today 12Stocks.com |
© 2024 12Stocks.com Terms & Conditions Privacy Contact Us
All Information Provided Only For Education And Not To Be Used For Investing or Trading. See Terms & Conditions


One More Thing ... Get Best Stocks Delivered Daily!
Never Ever Miss A Move With Our Top Ten Stocks Lists
Find Best Stocks In Any Market - Bull or Bear Market
Take A Peek At Our Top Ten Stocks Lists: Daily, Weekly, Year-to-Date & Top Trends
Find Best Stocks In Any Market - Bull or Bear Market
Take A Peek At Our Top Ten Stocks Lists: Daily, Weekly, Year-to-Date & Top Trends
Smallcap Stocks With Best Up Trends [0-bearish to 100-bullish]: Overseas Shipholding[100], PTC [100], Stoke [100], NuScale Power[100], NextDecade [100], Centrus Energy[100], Humacyte [100], Fossil Group[100], MicroStrategy [100], Riot Blockchain[100], Reneo [100]
Best Smallcap Stocks Year-to-Date:
CareMax [497.94%], Janux [347.18%], Viking [262.79%], Alpine Immune[241.23%], Longboard [240.67%], Avidity Biosciences[223.12%], Super Micro[218%], Novavax [208.13%], Stoke [206.08%], Sweetgreen [199.38%], Arcutis Bio[189.47%] Best Smallcap Stocks This Week:
Scilex Holding[34.44%], Dyne [27.82%], Comtech Tele[23.04%], Overseas Shipholding[22.74%], PTC [21.23%], Genelux [17.53%], Sutro Biopharma[16.71%], Tellurian [16.41%], Atara Bio[16.39%], Urban One[16.13%], Stoke [15.83%] Best Smallcap Stocks Daily:
Scilex Holding[34.44%], Dyne [27.82%], Comtech Tele[23.04%], Overseas Shipholding[22.74%], PTC [21.23%], Genelux [17.53%], Sutro Biopharma[16.71%], Tellurian [16.41%], Atara Bio[16.39%], Urban One[16.13%], Stoke [15.83%]