
 Login Sign Up


| |||||
 |  | ||||

| 12Stocks.com Market Intelligence |
Best SmallCap Stocks
|
| In a hurry? Small Cap Stock Lists: Performance Trends Table, Stock Charts
Sort Small Cap stocks: Daily, Weekly, Year-to-Date, Market Cap & Trends. Filter Small Cap stocks list by sector: Show all, Tech, Finance, Energy, Staples, Retail, Industrial, Materials, Utilities and HealthCare Filter Small Cap stocks list by size: All Large Medium Small and MicroCap |
| 12Stocks.com Small Cap Stocks Performances & Trends Daily | |||||||||
|
|  The overall Smart Investing & Trading Score is 49 (0-bearish to 100-bullish) which puts Small Cap index in short term neutral trend. The Smart Investing & Trading Score from previous trading session is 14 and hence an improvement of trend.
| ||||||||
Here are the Smart Investing & Trading Scores of the most requested small cap stocks at 12Stocks.com (click stock name for detailed review):
|


| 12Stocks.com: Investing in Smallcap Index with Stocks | |
|
The following table helps investors and traders sort through current performance and trends (as measured by Smart Investing & Trading Score) of various
stocks in the Smallcap Index. Quick View: Move mouse or cursor over stock symbol (ticker) to view short-term technical chart and over stock name to view long term chart. Click on  to add stock symbol to your watchlist and to add stock symbol to your watchlist and  to view watchlist. Click on any ticker or stock name for detailed market intelligence report for that stock. to view watchlist. Click on any ticker or stock name for detailed market intelligence report for that stock. |
12Stocks.com Performance of Stocks in Smallcap Index
| Ticker | Stock Name | Watchlist | Category | Recent Price | Smart Investing & Trading Score | Change % | YTD Change% |
| DORM | Dorman Products |   | Consumer Staples | 90.61 | 57 | 1.79% | 8.63% |
| WD | Walker & Dunlop | | Financials | 94.23 | 57 | 1.58% | -15.12% |
| WMK | Weis Markets | | Services & Goods | 63.85 | 57 | 1.37% | -0.17% |
| ALRM | Alarm.com | | Technology | 67.80 | 57 | 1.35% | 4.92% |
| MRTN | Marten Transport | | Transports | 17.23 | 57 | 1.32% | -17.85% |
| MMS | MAXIMUS | | Services & Goods | 81.80 | 57 | 1.31% | -2.46% |
| VPG | Vishay Precision | | Technology | 33.80 | 57 | 1.26% | -0.79% |
| NRC | National Research | | Health Care | 34.98 | 57 | 0.98% | -11.58% |
| INDB | Independent Bank | | Financials | 51.36 | 57 | 0.96% | -21.96% |
| BOH | Bank of Hawaii | | Financials | 58.49 | 57 | 0.84% | -19.28% |
| GIII | G-III Apparel | | Consumer Staples | 28.51 | 57 | 0.81% | -16.10% |
| IDYA | IDEAYA Biosciences | | Health Care | 41.47 | 57 | 0.70% | 16.55% |
| RXRX | Recursion | | Health Care | 8.38 | 57 | 0.60% | -14.40% |
| ACAD | ACADIA | | Health Care | 17.07 | 57 | 0.12% | -45.48% |
| THRM | Gentherm | | Consumer Staples | 51.42 | 57 | -0.96% | -1.80% |
| SNDX | Syndax | | Health Care | 21.87 | 57 | -0.46% | 1.20% |
| AROC | Archrock | | Energy | 20.03 | 56 | 2.72% | 30.06% |
| SCVL | Shoe Carnival | | Services & Goods | 34.01 | 56 | 1.98% | 12.58% |
| ALVR | AlloVir | | Health Care | 0.81 | 56 | 0.14% | 19.33% |
| GEO | GEO Group | | Financials | 14.98 | 56 | 1.63% | 38.32% |
| BL | BlackLine | | Technology | 59.72 | 55 | 3.07% | -4.36% |
| LYTS | LSI Industries | | Industrials | 14.92 | 55 | 1.36% | 5.97% |
| MD | MEDNAX | | Health Care | 9.12 | 55 | 1.22% | -1.94% |
| NWLI | National Western | | Financials | 488.44 | 55 | 0.05% | 1.12% |
| LOVE | Lovesac | | Consumer Staples | 22.29 | 55 | 1.18% | -12.76% |


| Too many stocks? View smallcap stocks filtered by marketcap & sector |
| Marketcap: All SmallCap Stocks (default-no microcap), Large, Mid-Range, Small |
| Smallcap Sector: Tech, Finance, Energy, Staples, Retail, Industrial, Materials, & Medical |
|
Get the most comprehensive stock market coverage daily at 12Stocks.com ➞ Best Stocks Today ➞ Best Stocks Weekly ➞ Best Stocks Year-to-Date ➞ Best Stocks Trends ➞  Best Stocks Today 12Stocks.com Best Nasdaq Stocks ➞ Best S&P 500 Stocks ➞ Best Tech Stocks ➞ Best Biotech Stocks ➞ |
| Detailed Overview of SmallCap Stocks |
| SmallCap Technical Overview, Leaders & Laggards, Top SmallCap ETF Funds & Detailed SmallCap Stocks List, Charts, Trends & More |
| Smallcap: Technical Analysis, Trends & YTD Performance | |
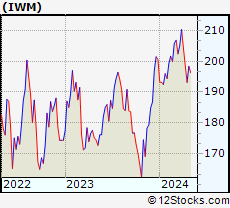
| SmallCap segment as represented by
IWM, an exchange-traded fund [ETF], holds basket of thousands of smallcap stocks from across all major sectors of the US stock market. The smallcap index (contains stocks like Riverbed & Sotheby's) is down by -0.39% and is currently underperforming the overall market by -6.01% year-to-date. Below is a quick view of technical charts and trends: | |
 IWM Weekly Chart |
|
| Long Term Trend: Not Good | |
| Medium Term Trend: Good | |
 IWM Daily Chart |
|
| Short Term Trend: Deteriorating | |
| Overall Trend Score: 49 | |
| YTD Performance: -0.39% | |
| **Trend Scores & Views Are Only For Educational Purposes And Not For Investing | |
| 12Stocks.com: Top Performing Small Cap Index Stocks | ||||||||||||||||||||||||||||||||||||||||||||||||
 The top performing Small Cap Index stocks year to date are
Now, more recently, over last week, the top performing Small Cap Index stocks on the move are


|
||||||||||||||||||||||||||||||||||||||||||||||||
| 12Stocks.com: Investing in Smallcap Index using Exchange Traded Funds | |
|
The following table shows list of key exchange traded funds (ETF) that
help investors track Smallcap index. The following list also includes leveraged ETF funds that track twice or thrice the daily returns of Smallcap indices. Short or inverse ETF funds move in the opposite direction to the index they track and are useful during market pullbacks or during bear markets. Quick View: Move mouse or cursor over ETF symbol (ticker) to view short-term technical chart and over ETF name to view long term chart. Click on ticker or stock name for detailed view. Click on to add stock symbol to your watchlist and to view watchlist. |
12Stocks.com List of ETFs that track Smallcap Index
| Ticker | ETF Name | Watchlist | Recent Price | Smart Investing & Trading Score | Change % | Week % | Year-to-date % |
| IWM | iShares Russell 2000 | | 199.92 | 49 | 1.84 | 0.77 | -0.39% |
| IJR | iShares Core S&P Small-Cap | | 106.33 | 50 | 1.52 | 0.64 | -1.77% |
| VTWO | Vanguard Russell 2000 ETF | | 80.83 | 7 | 1.85 | 0.76 | -0.33% |
| IWN | iShares Russell 2000 Value | | 152.88 | 57 | 2.04 | 1.15 | -1.58% |
| IWO | iShares Russell 2000 Growth | | 254.34 | 17 | 1.91 | 0.49 | 0.84% |
| IJS | iShares S&P Small-Cap 600 Value | | 98.02 | 13 | 1.68 | 0.85 | -4.9% |
| IJT | iShares S&P Small-Cap 600 Growth | | 126.47 | 20 | 1.22 | 0.3 | 1.06% |
| XSLV | PowerShares S&P SmallCap Low Volatil ETF | | 43.19 | 42 | 0.84 | 1.1 | -2.17% |
| SDD | ProShares UltraShort SmallCap600 | | 19.31 | 61 | -2.02 | -0.21 | 4.79% |
| SMLV | SPDR SSGA US Small Cap Low Volatil ETF | | 108.83 | 44 | 1.30 | 1.22 | -3.27% |
| SAA | ProShares Ultra SmallCap600 | | 22.93 | 32 | 1.56 | -0.46 | -8.08% |
| SBB | ProShares Short SmallCap600 | | 16.37 | 71 | -1.14 | -0.09 | 2.76% |
| 12Stocks.com: Charts, Trends, Fundamental Data and Performances of SmallCap Stocks | |
|
We now take in-depth look at all SmallCap stocks including charts, multi-period performances and overall trends (as measured by Smart Investing & Trading Score). One can sort SmallCap stocks (click link to choose) by Daily, Weekly and by Year-to-Date performances. Also, one can sort by size of the company or by market capitalization. |
| Select Your Default Chart Type: | |||||
| |||||
| Click on stock symbol or name for detailed view. Click on to add stock symbol to your watchlist and to view watchlist. Quick View: Move mouse or cursor over "Daily" to quickly view daily technical stock chart and over "Weekly" to view weekly technical stock chart. | |||||

 | DORM Dorman Products, Inc. |
| Sector: Consumer Staples | |
| SubSector: Auto Parts | |
| MarketCap: 2028.79 Millions | |
| Recent Price: 90.61 Smart Investing & Trading Score: 57 | |
| Day Percent Change: 1.79% Day Change: 1.59 | |
| Week Change: 1.55% Year-to-date Change: 8.6% | |
| DORM Links: Profile News Message Board | |
| Charts:- Daily , Weekly | |
| Add DORM to Watchlist: View: Get Complete DORM Trend Analysis ➞ | |
 | WD Walker & Dunlop, Inc. |
| Sector: Financials | |
| SubSector: Mortgage Investment | |
| MarketCap: 1312.99 Millions | |
| Recent Price: 94.23 Smart Investing & Trading Score: 57 | |
| Day Percent Change: 1.58% Day Change: 1.47 | |
| Week Change: 1.09% Year-to-date Change: -15.1% | |
| WD Links: Profile News Message Board | |
| Charts:- Daily , Weekly | |
| Add WD to Watchlist: View: Get Complete WD Trend Analysis ➞ | |
 | WMK Weis Markets, Inc. |
| Sector: Services & Goods | |
| SubSector: Grocery Stores | |
| MarketCap: 1148.75 Millions | |
| Recent Price: 63.85 Smart Investing & Trading Score: 57 | |
| Day Percent Change: 1.37% Day Change: 0.86 | |
| Week Change: 0.3% Year-to-date Change: -0.2% | |
| WMK Links: Profile News Message Board | |
| Charts:- Daily , Weekly | |
| Add WMK to Watchlist: View: Get Complete WMK Trend Analysis ➞ | |
 | ALRM Alarm.com Holdings, Inc. |
| Sector: Technology | |
| SubSector: Application Software | |
| MarketCap: 2035.62 Millions | |
| Recent Price: 67.80 Smart Investing & Trading Score: 57 | |
| Day Percent Change: 1.35% Day Change: 0.90 | |
| Week Change: 2.77% Year-to-date Change: 4.9% | |
| ALRM Links: Profile News Message Board | |
| Charts:- Daily , Weekly | |
| Add ALRM to Watchlist: View: Get Complete ALRM Trend Analysis ➞ | |
 | MRTN Marten Transport, Ltd. |
| Sector: Transports | |
| SubSector: Trucking | |
| MarketCap: 1012.15 Millions | |
| Recent Price: 17.23 Smart Investing & Trading Score: 57 | |
| Day Percent Change: 1.32% Day Change: 0.22 | |
| Week Change: 1.74% Year-to-date Change: -17.9% | |
| MRTN Links: Profile News Message Board | |
| Charts:- Daily , Weekly | |
| Add MRTN to Watchlist: View: Get Complete MRTN Trend Analysis ➞ | |
 | MMS MAXIMUS, Inc. |
| Sector: Services & Goods | |
| SubSector: Business Services | |
| MarketCap: 3833.02 Millions | |
| Recent Price: 81.80 Smart Investing & Trading Score: 57 | |
| Day Percent Change: 1.31% Day Change: 1.06 | |
| Week Change: 1.7% Year-to-date Change: -2.5% | |
| MMS Links: Profile News Message Board | |
| Charts:- Daily , Weekly | |
| Add MMS to Watchlist: View: Get Complete MMS Trend Analysis ➞ | |
 | VPG Vishay Precision Group, Inc. |
| Sector: Technology | |
| SubSector: Scientific & Technical Instruments | |
| MarketCap: 261.553 Millions | |
| Recent Price: 33.80 Smart Investing & Trading Score: 57 | |
| Day Percent Change: 1.26% Day Change: 0.42 | |
| Week Change: 1.17% Year-to-date Change: -0.8% | |
| VPG Links: Profile News Message Board | |
| Charts:- Daily , Weekly | |
| Add VPG to Watchlist: View: Get Complete VPG Trend Analysis ➞ | |
 | NRC National Research Corporation |
| Sector: Health Care | |
| SubSector: Medical Laboratories & Research | |
| MarketCap: 1187.7 Millions | |
| Recent Price: 34.98 Smart Investing & Trading Score: 57 | |
| Day Percent Change: 0.98% Day Change: 0.34 | |
| Week Change: 3.46% Year-to-date Change: -11.6% | |
| NRC Links: Profile News Message Board | |
| Charts:- Daily , Weekly | |
| Add NRC to Watchlist: View: Get Complete NRC Trend Analysis ➞ | |
 | INDB Independent Bank Corp. |
| Sector: Financials | |
| SubSector: Regional - Northeast Banks | |
| MarketCap: 2347.09 Millions | |
| Recent Price: 51.36 Smart Investing & Trading Score: 57 | |
| Day Percent Change: 0.96% Day Change: 0.49 | |
| Week Change: -2.6% Year-to-date Change: -22.0% | |
| INDB Links: Profile News Message Board | |
| Charts:- Daily , Weekly | |
| Add INDB to Watchlist: View: Get Complete INDB Trend Analysis ➞ | |
 | BOH Bank of Hawaii Corporation |
| Sector: Financials | |
| SubSector: Regional - Pacific Banks | |
| MarketCap: 2305.19 Millions | |
| Recent Price: 58.49 Smart Investing & Trading Score: 57 | |
| Day Percent Change: 0.84% Day Change: 0.49 | |
| Week Change: -0.24% Year-to-date Change: -19.3% | |
| BOH Links: Profile News Message Board | |
| Charts:- Daily , Weekly | |
| Add BOH to Watchlist: View: Get Complete BOH Trend Analysis ➞ | |
 | GIII G-III Apparel Group, Ltd. |
| Sector: Consumer Staples | |
| SubSector: Textile - Apparel Clothing | |
| MarketCap: 354.365 Millions | |
| Recent Price: 28.51 Smart Investing & Trading Score: 57 | |
| Day Percent Change: 0.81% Day Change: 0.23 | |
| Week Change: 0.32% Year-to-date Change: -16.1% | |
| GIII Links: Profile News Message Board | |
| Charts:- Daily , Weekly | |
| Add GIII to Watchlist: View: Get Complete GIII Trend Analysis ➞ | |
 | IDYA IDEAYA Biosciences, Inc. |
| Sector: Health Care | |
| SubSector: Biotechnology | |
| MarketCap: 89.1785 Millions | |
| Recent Price: 41.47 Smart Investing & Trading Score: 57 | |
| Day Percent Change: 0.70% Day Change: 0.29 | |
| Week Change: 3.83% Year-to-date Change: 16.6% | |
| IDYA Links: Profile News Message Board | |
| Charts:- Daily , Weekly | |
| Add IDYA to Watchlist: View: Get Complete IDYA Trend Analysis ➞ | |
 | RXRX Recursion Pharmaceuticals, Inc. |
| Sector: Health Care | |
| SubSector: Biotechnology | |
| MarketCap: 1470 Millions | |
| Recent Price: 8.38 Smart Investing & Trading Score: 57 | |
| Day Percent Change: 0.60% Day Change: 0.05 | |
| Week Change: 3.27% Year-to-date Change: -14.4% | |
| RXRX Links: Profile News Message Board | |
| Charts:- Daily , Weekly | |
| Add RXRX to Watchlist: View: Get Complete RXRX Trend Analysis ➞ | |
 | ACAD ACADIA Pharmaceuticals Inc. |
| Sector: Health Care | |
| SubSector: Biotechnology | |
| MarketCap: 5400.35 Millions | |
| Recent Price: 17.07 Smart Investing & Trading Score: 57 | |
| Day Percent Change: 0.12% Day Change: 0.02 | |
| Week Change: 2.15% Year-to-date Change: -45.5% | |
| ACAD Links: Profile News Message Board | |
| Charts:- Daily , Weekly | |
| Add ACAD to Watchlist: View: Get Complete ACAD Trend Analysis ➞ | |
 | THRM Gentherm Incorporated |
| Sector: Consumer Staples | |
| SubSector: Auto Parts | |
| MarketCap: 1032.59 Millions | |
| Recent Price: 51.42 Smart Investing & Trading Score: 57 | |
| Day Percent Change: -0.96% Day Change: -0.50 | |
| Week Change: 1.64% Year-to-date Change: -1.8% | |
| THRM Links: Profile News Message Board | |
| Charts:- Daily , Weekly | |
| Add THRM to Watchlist: View: Get Complete THRM Trend Analysis ➞ | |
 | SNDX Syndax Pharmaceuticals, Inc. |
| Sector: Health Care | |
| SubSector: Biotechnology | |
| MarketCap: 365.985 Millions | |
| Recent Price: 21.87 Smart Investing & Trading Score: 57 | |
| Day Percent Change: -0.46% Day Change: -0.10 | |
| Week Change: 3.85% Year-to-date Change: 1.2% | |
| SNDX Links: Profile News Message Board | |
| Charts:- Daily , Weekly | |
| Add SNDX to Watchlist: View: Get Complete SNDX Trend Analysis ➞ | |
 | AROC Archrock, Inc. |
| Sector: Energy | |
| SubSector: Oil & Gas Equipment & Services | |
| MarketCap: 614.961 Millions | |
| Recent Price: 20.03 Smart Investing & Trading Score: 56 | |
| Day Percent Change: 2.72% Day Change: 0.53 | |
| Week Change: -0.84% Year-to-date Change: 30.1% | |
| AROC Links: Profile News Message Board | |
| Charts:- Daily , Weekly | |
| Add AROC to Watchlist: View: Get Complete AROC Trend Analysis ➞ | |
 | SCVL Shoe Carnival, Inc. |
| Sector: Services & Goods | |
| SubSector: Apparel Stores | |
| MarketCap: 252.508 Millions | |
| Recent Price: 34.01 Smart Investing & Trading Score: 56 | |
| Day Percent Change: 1.98% Day Change: 0.66 | |
| Week Change: -1.51% Year-to-date Change: 12.6% | |
| SCVL Links: Profile News Message Board | |
| Charts:- Daily , Weekly | |
| Add SCVL to Watchlist: View: Get Complete SCVL Trend Analysis ➞ | |
 | ALVR AlloVir, Inc. |
| Sector: Health Care | |
| SubSector: Biotechnology | |
| MarketCap: 25787 Millions | |
| Recent Price: 0.81 Smart Investing & Trading Score: 56 | |
| Day Percent Change: 0.14% Day Change: 0.00 | |
| Week Change: 1.76% Year-to-date Change: 19.3% | |
| ALVR Links: Profile News Message Board | |
| Charts:- Daily , Weekly | |
| Add ALVR to Watchlist: View: Get Complete ALVR Trend Analysis ➞ | |
 | GEO The GEO Group, Inc. |
| Sector: Financials | |
| SubSector: REIT - Healthcare Facilities | |
| MarketCap: 1678.34 Millions | |
| Recent Price: 14.98 Smart Investing & Trading Score: 56 | |
| Day Percent Change: 1.63% Day Change: 0.24 | |
| Week Change: 0.74% Year-to-date Change: 38.3% | |
| GEO Links: Profile News Message Board | |
| Charts:- Daily , Weekly | |
| Add GEO to Watchlist: View: Get Complete GEO Trend Analysis ➞ | |
 | BL BlackLine, Inc. |
| Sector: Technology | |
| SubSector: Application Software | |
| MarketCap: 2972.62 Millions | |
| Recent Price: 59.72 Smart Investing & Trading Score: 55 | |
| Day Percent Change: 3.07% Day Change: 1.78 | |
| Week Change: -1.82% Year-to-date Change: -4.4% | |
| BL Links: Profile News Message Board | |
| Charts:- Daily , Weekly | |
| Add BL to Watchlist: View: Get Complete BL Trend Analysis ➞ | |
 | LYTS LSI Industries Inc. |
| Sector: Industrials | |
| SubSector: Industrial Electrical Equipment | |
| MarketCap: 85.7879 Millions | |
| Recent Price: 14.92 Smart Investing & Trading Score: 55 | |
| Day Percent Change: 1.36% Day Change: 0.20 | |
| Week Change: 1.02% Year-to-date Change: 6.0% | |
| LYTS Links: Profile News Message Board | |
| Charts:- Daily , Weekly | |
| Add LYTS to Watchlist: View: Get Complete LYTS Trend Analysis ➞ | |
 | MD MEDNAX, Inc. |
| Sector: Health Care | |
| SubSector: Specialized Health Services | |
| MarketCap: 913.656 Millions | |
| Recent Price: 9.12 Smart Investing & Trading Score: 55 | |
| Day Percent Change: 1.22% Day Change: 0.11 | |
| Week Change: 0.88% Year-to-date Change: -1.9% | |
| MD Links: Profile News Message Board | |
| Charts:- Daily , Weekly | |
| Add MD to Watchlist: View: Get Complete MD Trend Analysis ➞ | |
 | NWLI National Western Life Group, Inc. |
| Sector: Financials | |
| SubSector: Life Insurance | |
| MarketCap: 529 Millions | |
| Recent Price: 488.44 Smart Investing & Trading Score: 55 | |
| Day Percent Change: 0.05% Day Change: 0.24 | |
| Week Change: 0.03% Year-to-date Change: 1.1% | |
| NWLI Links: Profile News Message Board | |
| Charts:- Daily , Weekly | |
| Add NWLI to Watchlist: View: Get Complete NWLI Trend Analysis ➞ | |
 | LOVE The Lovesac Company |
| Sector: Consumer Staples | |
| SubSector: Home Furnishings & Fixtures | |
| MarketCap: 112.835 Millions | |
| Recent Price: 22.29 Smart Investing & Trading Score: 55 | |
| Day Percent Change: 1.18% Day Change: 0.26 | |
| Week Change: 2.06% Year-to-date Change: -12.8% | |
| LOVE Links: Profile News Message Board | |
| Charts:- Daily , Weekly | |
| Add LOVE to Watchlist: View: Get Complete LOVE Trend Analysis ➞ | |
| Too many stocks? View smallcap stocks filtered by marketcap & sector |
| Marketcap: All SmallCap Stocks (default-no microcap), Large, Mid-Range, Small & MicroCap |
| Sector: Tech, Finance, Energy, Staples, Retail, Industrial, Materials, Utilities & Medical |
|
Best Stocks Today 12Stocks.com |
© 2024 12Stocks.com Terms & Conditions Privacy Contact Us
All Information Provided Only For Education And Not To Be Used For Investing or Trading. See Terms & Conditions


One More Thing ... Get Best Stocks Delivered Daily!
Never Ever Miss A Move With Our Top Ten Stocks Lists
Find Best Stocks In Any Market - Bull or Bear Market
Take A Peek At Our Top Ten Stocks Lists: Daily, Weekly, Year-to-Date & Top Trends
Find Best Stocks In Any Market - Bull or Bear Market
Take A Peek At Our Top Ten Stocks Lists: Daily, Weekly, Year-to-Date & Top Trends
Smallcap Stocks With Best Up Trends [0-bearish to 100-bullish]: Emergent BioSolutions[100], Aspen Aerogels[100], Perdoceo Education[100], Gannett Co[100], Pitney Bowes[100], Benchmark Electronics[100], Origin Materials[100], FormFactor [100], Lantheus [100], Q2 [100], Blueprint Medicines[100]
Best Smallcap Stocks Year-to-Date:
Janux [440.16%], Viking [307.15%], Longboard [273.98%], Alpine Immune[239.23%], Bakkt [187.89%], Avidity Biosciences[182.96%], Vera [170.74%], Cullinan Oncology[169.74%], Super Micro[168.13%], Arcutis Bio[166.1%], Y-mAbs [153.08%] Best Smallcap Stocks This Week:
Deciphera [73.17%], Emergent BioSolutions[71.88%], Eyenovia [48.36%], Aspen Aerogels[47.89%], P3 Health[38.51%], Carvana Co[38.18%], Cue Biopharma[36.26%], Origin Materials[36.24%], TransMedics Group[35.13%], Seres [33.33%], Enovix [32.07%] Best Smallcap Stocks Daily:
Emergent BioSolutions[70.98%], Aspen Aerogels[56.44%], Carvana Co[33.77%], Perdoceo Education[31.79%], Enovix [31.06%], Office Properties[29.00%], Gannett Co[26.97%], Sunnova Energy[25.21%], Pitney Bowes[24.70%], Pulmonx [21.37%], CommScope Holding[20.38%]