
 Login Sign Up


| |||||
 |  | ||||

| 12Stocks.com Market Intelligence |
Best SmallCap Stocks
|
| In a hurry? Small Cap Stock Lists: Performance Trends Table, Stock Charts
Sort Small Cap stocks: Daily, Weekly, Year-to-Date, Market Cap & Trends. Filter Small Cap stocks list by sector: Show all, Tech, Finance, Energy, Staples, Retail, Industrial, Materials, Utilities and HealthCare Filter Small Cap stocks list by size: All Large Medium Small and MicroCap |
| 12Stocks.com Small Cap Stocks Performances & Trends Daily | |||||||||
|
|  The overall Smart Investing & Trading Score is 69 (0-bearish to 100-bullish) which puts Small Cap index in short term neutral to bullish trend. The Smart Investing & Trading Score from previous trading session is 49 and hence an improvement of trend.
| ||||||||
Here are the Smart Investing & Trading Scores of the most requested small cap stocks at 12Stocks.com (click stock name for detailed review):
|


| 12Stocks.com: Investing in Smallcap Index with Stocks | |
|
The following table helps investors and traders sort through current performance and trends (as measured by Smart Investing & Trading Score) of various
stocks in the Smallcap Index. Quick View: Move mouse or cursor over stock symbol (ticker) to view short-term technical chart and over stock name to view long term chart. Click on  to add stock symbol to your watchlist and to add stock symbol to your watchlist and  to view watchlist. Click on any ticker or stock name for detailed market intelligence report for that stock. to view watchlist. Click on any ticker or stock name for detailed market intelligence report for that stock. |
12Stocks.com Performance of Stocks in Smallcap Index
| Ticker | Stock Name | Watchlist | Category | Recent Price | Smart Investing & Trading Score | Change % | YTD Change% |
| CMBM | Cambium s |   | Technology | 3.94 | 54 | 4.51% | -34.33% |
| AVIR | Atea | | Health Care | 3.96 | 54 | 3.39% | 29.84% |
| PHAT | Phathom | | Health Care | 10.04 | 54 | 2.87% | 9.97% |
| ADPT | Adaptive Bio | | Health Care | 3.01 | 54 | 2.73% | -38.57% |
| CLNE | Clean Energy | | Utilities | 2.38 | 54 | 2.15% | -37.86% |
| LPSN | LivePerson | | Technology | 0.58 | 54 | 1.71% | -84.82% |
| NDLS | Noodles & | | Services & Goods | 1.58 | 54 | 1.28% | -49.84% |
| AMLX | Amylyx | | Health Care | 2.06 | 54 | 1.23% | -85.79% |
| ALEC | Alector | | Health Care | 5.39 | 54 | 0.94% | -32.46% |
| GFF | Griffon | | Industrials | 69.13 | 54 | 0.61% | 13.42% |
| MEI | Methode Electronics | | Technology | 12.34 | 54 | 0.57% | -45.71% |
| SANM | Sanmina | | Technology | 61.76 | 54 | 0.44% | 20.23% |
| FEAM | 5E Advanced | | Materials | 1.27 | 54 | 0.40% | -9.93% |
| BARK | BARK | | Services & Goods | 1.16 | 54 | 0.00% | 44.96% |
| MPLN | MultiPlan | | Health Care | 0.65 | 54 | -1.71% | -54.56% |
| OPRX | OptimizeRx | | Technology | 10.62 | 54 | -0.75% | -25.79% |
| DOUG | Douglas Elliman | | Financials | 1.39 | 54 | -0.36% | -52.73% |
| WTTR | Select Energy | | Industrials | 9.16 | 54 | 1.22% | 20.69% |
| VHI | Valhi | | Materials | 14.85 | 54 | 0.95% | -2.24% |
| BOX | Box | | Technology | 26.14 | 54 | -0.27% | 2.07% |
| CHRD | Chord Energy | | Energy | 176.02 | 54 | -0.11% | 5.48% |
| MXL | MaxLinear | | Technology | 19.99 | 53 | 3.74% | -15.90% |
| SG | Sweetgreen | | Services & Goods | 22.10 | 53 | 3.56% | 95.58% |
| PX | P10 | | Financials | 7.55 | 53 | 2.58% | -26.13% |
| IIIV | i3 Verticals | | Technology | 22.40 | 53 | 0.63% | 5.81% |


| Too many stocks? View smallcap stocks filtered by marketcap & sector |
| Marketcap: All SmallCap Stocks (default-no microcap), Large, Mid-Range, Small |
| Smallcap Sector: Tech, Finance, Energy, Staples, Retail, Industrial, Materials, & Medical |
|
Get the most comprehensive stock market coverage daily at 12Stocks.com ➞ Best Stocks Today ➞ Best Stocks Weekly ➞ Best Stocks Year-to-Date ➞ Best Stocks Trends ➞  Best Stocks Today 12Stocks.com Best Nasdaq Stocks ➞ Best S&P 500 Stocks ➞ Best Tech Stocks ➞ Best Biotech Stocks ➞ |
| Detailed Overview of SmallCap Stocks |
| SmallCap Technical Overview, Leaders & Laggards, Top SmallCap ETF Funds & Detailed SmallCap Stocks List, Charts, Trends & More |
| Smallcap: Technical Analysis, Trends & YTD Performance | |
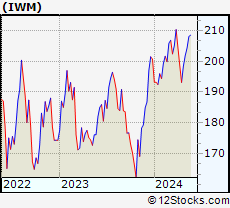
| SmallCap segment as represented by
IWM, an exchange-traded fund [ETF], holds basket of thousands of smallcap stocks from across all major sectors of the US stock market. The smallcap index (contains stocks like Riverbed & Sotheby's) is up by 0.59% and is currently underperforming the overall market by -6.29% year-to-date. Below is a quick view of technical charts and trends: | |
 IWM Weekly Chart |
|
| Long Term Trend: Not Good | |
| Medium Term Trend: Very Good | |
 IWM Daily Chart |
|
| Short Term Trend: Very Good | |
| Overall Trend Score: 69 | |
| YTD Performance: 0.59% | |
| **Trend Scores & Views Are Only For Educational Purposes And Not For Investing | |
| 12Stocks.com: Top Performing Small Cap Index Stocks | ||||||||||||||||||||||||||||||||||||||||||||||||
 The top performing Small Cap Index stocks year to date are
Now, more recently, over last week, the top performing Small Cap Index stocks on the move are


|
||||||||||||||||||||||||||||||||||||||||||||||||
| 12Stocks.com: Investing in Smallcap Index using Exchange Traded Funds | |
|
The following table shows list of key exchange traded funds (ETF) that
help investors track Smallcap index. The following list also includes leveraged ETF funds that track twice or thrice the daily returns of Smallcap indices. Short or inverse ETF funds move in the opposite direction to the index they track and are useful during market pullbacks or during bear markets. Quick View: Move mouse or cursor over ETF symbol (ticker) to view short-term technical chart and over ETF name to view long term chart. Click on ticker or stock name for detailed view. Click on to add stock symbol to your watchlist and to view watchlist. |
12Stocks.com List of ETFs that track Smallcap Index
| Ticker | ETF Name | Watchlist | Recent Price | Smart Investing & Trading Score | Change % | Week % | Year-to-date % |
| IWM | iShares Russell 2000 | | 201.90 | 69 | 0.99 | 1.77 | 0.59% |
| IJR | iShares Core S&P Small-Cap | | 107.13 | 82 | 0.75 | 1.4 | -1.03% |
| VTWO | Vanguard Russell 2000 ETF | | 81.61 | 69 | 0.94 | 1.73 | 0.63% |
| IWN | iShares Russell 2000 Value | | 154.21 | 100 | 0.87 | 2.03 | -0.72% |
| IJS | iShares S&P Small-Cap 600 Value | | 98.72 | 64 | 0.71 | 1.57 | -4.22% |
| IWO | iShares Russell 2000 Growth | | 256.87 | 57 | 0.99 | 1.49 | 1.84% |
| IJT | iShares S&P Small-Cap 600 Growth | | 127.76 | 95 | 0.82 | 1.32 | 2.09% |
| XSLV | PowerShares S&P SmallCap Low Volatil ETF | | 43.22 | 87 | 0.19 | 1.17 | -2.11% |
| SBB | ProShares Short SmallCap600 | | 16.16 | 13 | -1.28 | -1.37 | 1.44% |
| SDD | ProShares UltraShort SmallCap600 | | 18.84 | 23 | -2.41 | -2.61 | 2.27% |
| SAA | ProShares Ultra SmallCap600 | | 23.59 | 69 | 2.86 | 2.39 | -5.45% |
| SMLV | SPDR SSGA US Small Cap Low Volatil ETF | | 109.69 | 87 | 0.78 | 2.01 | -2.52% |
| 12Stocks.com: Charts, Trends, Fundamental Data and Performances of SmallCap Stocks | |
|
We now take in-depth look at all SmallCap stocks including charts, multi-period performances and overall trends (as measured by Smart Investing & Trading Score). One can sort SmallCap stocks (click link to choose) by Daily, Weekly and by Year-to-Date performances. Also, one can sort by size of the company or by market capitalization. |
| Select Your Default Chart Type: | |||||
| |||||
| Click on stock symbol or name for detailed view. Click on to add stock symbol to your watchlist and to view watchlist. Quick View: Move mouse or cursor over "Daily" to quickly view daily technical stock chart and over "Weekly" to view weekly technical stock chart. | |||||

 | CMBM Cambium Networks Corporation |
| Sector: Technology | |
| SubSector: Communication Equipment | |
| MarketCap: 143.739 Millions | |
| Recent Price: 3.94 Smart Investing & Trading Score: 54 | |
| Day Percent Change: 4.51% Day Change: 0.17 | |
| Week Change: 10.67% Year-to-date Change: -34.3% | |
| CMBM Links: Profile News Message Board | |
| Charts:- Daily , Weekly | |
| Add CMBM to Watchlist: View: Get Complete CMBM Trend Analysis ➞ | |
 | AVIR Atea Pharmaceuticals, Inc. |
| Sector: Health Care | |
| SubSector: Biotechnology | |
| MarketCap: 22587 Millions | |
| Recent Price: 3.96 Smart Investing & Trading Score: 54 | |
| Day Percent Change: 3.39% Day Change: 0.13 | |
| Week Change: 6.74% Year-to-date Change: 29.8% | |
| AVIR Links: Profile News Message Board | |
| Charts:- Daily , Weekly | |
| Add AVIR to Watchlist: View: Get Complete AVIR Trend Analysis ➞ | |
 | PHAT Phathom Pharmaceuticals, Inc. |
| Sector: Health Care | |
| SubSector: Biotechnology | |
| MarketCap: 728.785 Millions | |
| Recent Price: 10.04 Smart Investing & Trading Score: 54 | |
| Day Percent Change: 2.87% Day Change: 0.28 | |
| Week Change: 9.37% Year-to-date Change: 10.0% | |
| PHAT Links: Profile News Message Board | |
| Charts:- Daily , Weekly | |
| Add PHAT to Watchlist: View: Get Complete PHAT Trend Analysis ➞ | |
 | ADPT Adaptive Biotechnologies Corporation |
| Sector: Health Care | |
| SubSector: Biotechnology | |
| MarketCap: 3525.75 Millions | |
| Recent Price: 3.01 Smart Investing & Trading Score: 54 | |
| Day Percent Change: 2.73% Day Change: 0.08 | |
| Week Change: 15.77% Year-to-date Change: -38.6% | |
| ADPT Links: Profile News Message Board | |
| Charts:- Daily , Weekly | |
| Add ADPT to Watchlist: View: Get Complete ADPT Trend Analysis ➞ | |
 | CLNE Clean Energy Fuels Corp. |
| Sector: Utilities | |
| SubSector: Gas Utilities | |
| MarketCap: 371.977 Millions | |
| Recent Price: 2.38 Smart Investing & Trading Score: 54 | |
| Day Percent Change: 2.15% Day Change: 0.05 | |
| Week Change: -2.06% Year-to-date Change: -37.9% | |
| CLNE Links: Profile News Message Board | |
| Charts:- Daily , Weekly | |
| Add CLNE to Watchlist: View: Get Complete CLNE Trend Analysis ➞ | |
 | LPSN LivePerson, Inc. |
| Sector: Technology | |
| SubSector: Business Software & Services | |
| MarketCap: 1070.58 Millions | |
| Recent Price: 0.58 Smart Investing & Trading Score: 54 | |
| Day Percent Change: 1.71% Day Change: 0.01 | |
| Week Change: 9.37% Year-to-date Change: -84.8% | |
| LPSN Links: Profile News Message Board | |
| Charts:- Daily , Weekly | |
| Add LPSN to Watchlist: View: Get Complete LPSN Trend Analysis ➞ | |
 | NDLS Noodles & Company |
| Sector: Services & Goods | |
| SubSector: Restaurants | |
| MarketCap: 188.77 Millions | |
| Recent Price: 1.58 Smart Investing & Trading Score: 54 | |
| Day Percent Change: 1.28% Day Change: 0.02 | |
| Week Change: 12.86% Year-to-date Change: -49.8% | |
| NDLS Links: Profile News Message Board | |
| Charts:- Daily , Weekly | |
| Add NDLS to Watchlist: View: Get Complete NDLS Trend Analysis ➞ | |
 | AMLX Amylyx Pharmaceuticals, Inc. |
| Sector: Health Care | |
| SubSector: Biotechnology | |
| MarketCap: 1500 Millions | |
| Recent Price: 2.06 Smart Investing & Trading Score: 54 | |
| Day Percent Change: 1.23% Day Change: 0.03 | |
| Week Change: 17.43% Year-to-date Change: -85.8% | |
| AMLX Links: Profile News Message Board | |
| Charts:- Daily , Weekly | |
| Add AMLX to Watchlist: View: Get Complete AMLX Trend Analysis ➞ | |
 | ALEC Alector, Inc. |
| Sector: Health Care | |
| SubSector: Biotechnology | |
| MarketCap: 2719.35 Millions | |
| Recent Price: 5.39 Smart Investing & Trading Score: 54 | |
| Day Percent Change: 0.94% Day Change: 0.05 | |
| Week Change: 2.67% Year-to-date Change: -32.5% | |
| ALEC Links: Profile News Message Board | |
| Charts:- Daily , Weekly | |
| Add ALEC to Watchlist: View: Get Complete ALEC Trend Analysis ➞ | |
 | GFF Griffon Corporation |
| Sector: Industrials | |
| SubSector: General Building Materials | |
| MarketCap: 616 Millions | |
| Recent Price: 69.13 Smart Investing & Trading Score: 54 | |
| Day Percent Change: 0.61% Day Change: 0.42 | |
| Week Change: 1.26% Year-to-date Change: 13.4% | |
| GFF Links: Profile News Message Board | |
| Charts:- Daily , Weekly | |
| Add GFF to Watchlist: View: Get Complete GFF Trend Analysis ➞ | |
 | MEI Methode Electronics, Inc. |
| Sector: Technology | |
| SubSector: Diversified Electronics | |
| MarketCap: 941.896 Millions | |
| Recent Price: 12.34 Smart Investing & Trading Score: 54 | |
| Day Percent Change: 0.57% Day Change: 0.07 | |
| Week Change: 0.98% Year-to-date Change: -45.7% | |
| MEI Links: Profile News Message Board | |
| Charts:- Daily , Weekly | |
| Add MEI to Watchlist: View: Get Complete MEI Trend Analysis ➞ | |
 | SANM Sanmina Corporation |
| Sector: Technology | |
| SubSector: Diversified Electronics | |
| MarketCap: 1790.36 Millions | |
| Recent Price: 61.76 Smart Investing & Trading Score: 54 | |
| Day Percent Change: 0.44% Day Change: 0.27 | |
| Week Change: -1.92% Year-to-date Change: 20.2% | |
| SANM Links: Profile News Message Board | |
| Charts:- Daily , Weekly | |
| Add SANM to Watchlist: View: Get Complete SANM Trend Analysis ➞ | |
 | FEAM 5E Advanced Materials Inc. |
| Sector: Materials | |
| SubSector: Specialty Chemicals | |
| MarketCap: 247 Millions | |
| Recent Price: 1.27 Smart Investing & Trading Score: 54 | |
| Day Percent Change: 0.40% Day Change: 0.01 | |
| Week Change: 12.39% Year-to-date Change: -9.9% | |
| FEAM Links: Profile News Message Board | |
| Charts:- Daily , Weekly | |
| Add FEAM to Watchlist: View: Get Complete FEAM Trend Analysis ➞ | |
 | BARK BARK, Inc. |
| Sector: Services & Goods | |
| SubSector: Specialty Retail | |
| MarketCap: 234 Millions | |
| Recent Price: 1.16 Smart Investing & Trading Score: 54 | |
| Day Percent Change: 0.00% Day Change: 0.00 | |
| Week Change: 5.45% Year-to-date Change: 45.0% | |
| BARK Links: Profile News Message Board | |
| Charts:- Daily , Weekly | |
| Add BARK to Watchlist: View: Get Complete BARK Trend Analysis ➞ | |
 | MPLN MultiPlan Corporation |
| Sector: Health Care | |
| SubSector: Healthcare Plans | |
| MarketCap: 56087 Millions | |
| Recent Price: 0.65 Smart Investing & Trading Score: 54 | |
| Day Percent Change: -1.71% Day Change: -0.01 | |
| Week Change: 13.69% Year-to-date Change: -54.6% | |
| MPLN Links: Profile News Message Board | |
| Charts:- Daily , Weekly | |
| Add MPLN to Watchlist: View: Get Complete MPLN Trend Analysis ➞ | |
 | OPRX OptimizeRx Corporation |
| Sector: Technology | |
| SubSector: Healthcare Information Services | |
| MarketCap: 107.155 Millions | |
| Recent Price: 10.62 Smart Investing & Trading Score: 54 | |
| Day Percent Change: -0.75% Day Change: -0.08 | |
| Week Change: 4.94% Year-to-date Change: -25.8% | |
| OPRX Links: Profile News Message Board | |
| Charts:- Daily , Weekly | |
| Add OPRX to Watchlist: View: Get Complete OPRX Trend Analysis ➞ | |
 | DOUG Douglas Elliman Inc. |
| Sector: Financials | |
| SubSector: Financials Services | |
| MarketCap: 197 Millions | |
| Recent Price: 1.39 Smart Investing & Trading Score: 54 | |
| Day Percent Change: -0.36% Day Change: 0.00 | |
| Week Change: 16.39% Year-to-date Change: -52.7% | |
| DOUG Links: Profile News Message Board | |
| Charts:- Daily , Weekly | |
| Add DOUG to Watchlist: View: Get Complete DOUG Trend Analysis ➞ | |
 | WTTR Select Energy Services, Inc. |
| Sector: Industrials | |
| SubSector: Pollution & Treatment Controls | |
| MarketCap: 347.075 Millions | |
| Recent Price: 9.16 Smart Investing & Trading Score: 54 | |
| Day Percent Change: 1.22% Day Change: 0.11 | |
| Week Change: -3.38% Year-to-date Change: 20.7% | |
| WTTR Links: Profile News Message Board | |
| Charts:- Daily , Weekly | |
| Add WTTR to Watchlist: View: Get Complete WTTR Trend Analysis ➞ | |
 | VHI Valhi, Inc. |
| Sector: Materials | |
| SubSector: Chemicals - Major Diversified | |
| MarketCap: 394.336 Millions | |
| Recent Price: 14.85 Smart Investing & Trading Score: 54 | |
| Day Percent Change: 0.95% Day Change: 0.14 | |
| Week Change: -1% Year-to-date Change: -2.2% | |
| VHI Links: Profile News Message Board | |
| Charts:- Daily , Weekly | |
| Add VHI to Watchlist: View: Get Complete VHI Trend Analysis ➞ | |
 | BOX Box, Inc. |
| Sector: Technology | |
| SubSector: Application Software | |
| MarketCap: 2154.42 Millions | |
| Recent Price: 26.14 Smart Investing & Trading Score: 54 | |
| Day Percent Change: -0.27% Day Change: -0.07 | |
| Week Change: -2.64% Year-to-date Change: 2.1% | |
| BOX Links: Profile News Message Board | |
| Charts:- Daily , Weekly | |
| Add BOX to Watchlist: View: Get Complete BOX Trend Analysis ➞ | |
 | CHRD Chord Energy Corporation |
| Sector: Energy | |
| SubSector: Oil & Gas E&P | |
| MarketCap: 6280 Millions | |
| Recent Price: 176.02 Smart Investing & Trading Score: 54 | |
| Day Percent Change: -0.11% Day Change: -0.20 | |
| Week Change: -5.19% Year-to-date Change: 5.5% | |
| CHRD Links: Profile News Message Board | |
| Charts:- Daily , Weekly | |
| Add CHRD to Watchlist: View: Get Complete CHRD Trend Analysis ➞ | |
 | MXL MaxLinear, Inc. |
| Sector: Technology | |
| SubSector: Semiconductor - Integrated Circuits | |
| MarketCap: 751.31 Millions | |
| Recent Price: 19.99 Smart Investing & Trading Score: 53 | |
| Day Percent Change: 3.74% Day Change: 0.72 | |
| Week Change: -2.91% Year-to-date Change: -15.9% | |
| MXL Links: Profile News Message Board | |
| Charts:- Daily , Weekly | |
| Add MXL to Watchlist: View: Get Complete MXL Trend Analysis ➞ | |
 | SG Sweetgreen, Inc. |
| Sector: Services & Goods | |
| SubSector: Restaurants | |
| MarketCap: 1420 Millions | |
| Recent Price: 22.10 Smart Investing & Trading Score: 53 | |
| Day Percent Change: 3.56% Day Change: 0.76 | |
| Week Change: -9.87% Year-to-date Change: 95.6% | |
| SG Links: Profile News Message Board | |
| Charts:- Daily , Weekly | |
| Add SG to Watchlist: View: Get Complete SG Trend Analysis ➞ | |
 | PX P10, Inc. |
| Sector: Financials | |
| SubSector: Asset Management | |
| MarketCap: 1300 Millions | |
| Recent Price: 7.55 Smart Investing & Trading Score: 53 | |
| Day Percent Change: 2.58% Day Change: 0.19 | |
| Week Change: 1.21% Year-to-date Change: -26.1% | |
| PX Links: Profile News Message Board | |
| Charts:- Daily , Weekly | |
| Add PX to Watchlist: View: Get Complete PX Trend Analysis ➞ | |
 | IIIV i3 Verticals, Inc. |
| Sector: Technology | |
| SubSector: Business Software & Services | |
| MarketCap: 448.458 Millions | |
| Recent Price: 22.40 Smart Investing & Trading Score: 53 | |
| Day Percent Change: 0.63% Day Change: 0.14 | |
| Week Change: -3.03% Year-to-date Change: 5.8% | |
| IIIV Links: Profile News Message Board | |
| Charts:- Daily , Weekly | |
| Add IIIV to Watchlist: View: Get Complete IIIV Trend Analysis ➞ | |
| Too many stocks? View smallcap stocks filtered by marketcap & sector |
| Marketcap: All SmallCap Stocks (default-no microcap), Large, Mid-Range, Small & MicroCap |
| Sector: Tech, Finance, Energy, Staples, Retail, Industrial, Materials, Utilities & Medical |
|
Best Stocks Today 12Stocks.com |
© 2024 12Stocks.com Terms & Conditions Privacy Contact Us
All Information Provided Only For Education And Not To Be Used For Investing or Trading. See Terms & Conditions


One More Thing ... Get Best Stocks Delivered Daily!
Never Ever Miss A Move With Our Top Ten Stocks Lists
Find Best Stocks In Any Market - Bull or Bear Market
Take A Peek At Our Top Ten Stocks Lists: Daily, Weekly, Year-to-Date & Top Trends
Find Best Stocks In Any Market - Bull or Bear Market
Take A Peek At Our Top Ten Stocks Lists: Daily, Weekly, Year-to-Date & Top Trends
Smallcap Stocks With Best Up Trends [0-bearish to 100-bullish]: Twist Bioscience[100], WideOpenWest [100], Joint [100], FTC Solar[100], Origin Materials[100], Alignment Healthcare[100], Clarus [100], IES [100], Emergent BioSolutions[100], Enovix [100], El Pollo[100]
Best Smallcap Stocks Year-to-Date:
Janux [482.74%], Viking [313.59%], Longboard [272.5%], Alpine Immune[239.29%], Bakkt [199.55%], Avidity Biosciences[192.48%], Vera [189.47%], Cullinan Oncology[176.9%], Super Micro[175.35%], Y-mAbs [151.47%], Sana [149.33%] Best Smallcap Stocks This Week:
Emergent BioSolutions[102.6%], Deciphera [73.24%], Origin Materials[66.52%], Eyenovia [60.78%], Cue Biopharma[56.04%], Aspen Aerogels[55.96%], Enovix [54.02%], Luna Innovations[53.77%], Codexis [47.37%], Carvana Co[44.31%], Office Properties[42.79%] Best Smallcap Stocks Daily:
Luna Innovations[36.00%], Twist Bioscience[28.74%], Ardelyx [28.42%], WideOpenWest [28.23%], 2U [26.63%], Joint [25.35%], FTC Solar[25.09%], Origin Materials[22.23%], Alignment Healthcare[21.97%], Clarus [18.67%], Aurora Innovation[18.09%]