
 Login Sign Up


| |||||
 |  | ||||

| 12Stocks.com Market Intelligence |
Best SmallCap Stocks
|
| In a hurry? Small Cap Stock Lists: Performance Trends Table, Stock Charts
Sort Small Cap stocks: Daily, Weekly, Year-to-Date, Market Cap & Trends. Filter Small Cap stocks list by sector: Show all, Tech, Finance, Energy, Staples, Retail, Industrial, Materials, Utilities and HealthCare Filter Small Cap stocks list by size: All Large Medium Small and MicroCap |
| 12Stocks.com Small Cap Stocks Performances & Trends Daily | |||||||||
|
|  The overall Smart Investing & Trading Score is 69 (0-bearish to 100-bullish) which puts Small Cap index in short term neutral to bullish trend. The Smart Investing & Trading Score from previous trading session is 49 and hence an improvement of trend.
| ||||||||
Here are the Smart Investing & Trading Scores of the most requested small cap stocks at 12Stocks.com (click stock name for detailed review):
|


| 12Stocks.com: Investing in Smallcap Index with Stocks | |
|
The following table helps investors and traders sort through current performance and trends (as measured by Smart Investing & Trading Score) of various
stocks in the Smallcap Index. Quick View: Move mouse or cursor over stock symbol (ticker) to view short-term technical chart and over stock name to view long term chart. Click on  to add stock symbol to your watchlist and to add stock symbol to your watchlist and  to view watchlist. Click on any ticker or stock name for detailed market intelligence report for that stock. to view watchlist. Click on any ticker or stock name for detailed market intelligence report for that stock. |
12Stocks.com Performance of Stocks in Smallcap Index
| Ticker | Stock Name | Watchlist | Category | Recent Price | Smart Investing & Trading Score | Change % | YTD Change% |
| KLIC | Kulicke and |   | Technology | 47.00 | 42 | 2.13% | -14.11% |
| OPTN | OptiNose | | Health Care | 1.01 | 42 | 15.09% | -21.71% |
| EYE | National Vision | | Services & Goods | 17.90 | 42 | 1.88% | -14.48% |
| SHEN | Shenandoah Tele | | Technology | 13.47 | 42 | 1.66% | -37.70% |
| HELE | Helen of Troy | | Consumer Staples | 96.54 | 42 | 1.66% | -20.09% |
| LCII | LCI Industries | | Consumer Staples | 106.84 | 42 | 1.62% | -15.01% |
| SNCY | Sun Country | | Industrials | 13.86 | 42 | 1.61% | -12.36% |
| SSD | Simpson | | Industrials | 181.05 | 42 | 1.59% | -8.55% |
| SCLX | Scilex Holding | | Health Care | 0.87 | 42 | 1.59% | -55.44% |
| KOS | Kosmos Energy | | Energy | 5.81 | 42 | 1.57% | -13.41% |
| AVAH | Aveanna Healthcare | | Health Care | 2.27 | 42 | 1.57% | -15.77% |
| PCH | PotlatchDeltic | | Industrials | 42.00 | 42 | 1.42% | -14.46% |
| CRBU | Caribou Biosciences | | Health Care | 3.71 | 42 | 1.37% | -35.11% |
| BRKL | Brookline Bancorp | | Financials | 8.85 | 42 | 1.26% | -18.88% |
| MCRI | Monarch Casino | | Services & Goods | 69.01 | 42 | 1.26% | -0.20% |
| TMCI | Treace Medical | | Health Care | 10.85 | 42 | 1.21% | -14.84% |
| DMRC | Digimarc | | Technology | 22.88 | 42 | 1.19% | -36.66% |
| RDVT | Red Violet | | Technology | 17.63 | 42 | 1.15% | -11.72% |
| HLLY | Holley | | Services & Goods | 4.10 | 42 | 0.99% | -17.42% |
| HOFT | Hooker Furniture | | Consumer Staples | 17.60 | 42 | 0.98% | -32.52% |
| LZB | La-Z-Boy | | Consumer Staples | 33.21 | 42 | 0.70% | -10.05% |
| FRBA | First Bank | | Financials | 12.17 | 42 | 0.58% | -17.21% |
| FBNC | First Bancorp | | Financials | 31.85 | 42 | 0.47% | -13.94% |
| SSB | South State | | Financials | 78.57 | 42 | 0.41% | -6.96% |
| BTAI | BioXcel | | Health Care | 2.57 | 42 | 0.39% | -12.88% |


| Too many stocks? View smallcap stocks filtered by marketcap & sector |
| Marketcap: All SmallCap Stocks (default-no microcap), Large, Mid-Range, Small |
| Smallcap Sector: Tech, Finance, Energy, Staples, Retail, Industrial, Materials, & Medical |
|
Get the most comprehensive stock market coverage daily at 12Stocks.com ➞ Best Stocks Today ➞ Best Stocks Weekly ➞ Best Stocks Year-to-Date ➞ Best Stocks Trends ➞  Best Stocks Today 12Stocks.com Best Nasdaq Stocks ➞ Best S&P 500 Stocks ➞ Best Tech Stocks ➞ Best Biotech Stocks ➞ |
| Detailed Overview of SmallCap Stocks |
| SmallCap Technical Overview, Leaders & Laggards, Top SmallCap ETF Funds & Detailed SmallCap Stocks List, Charts, Trends & More |
| Smallcap: Technical Analysis, Trends & YTD Performance | |
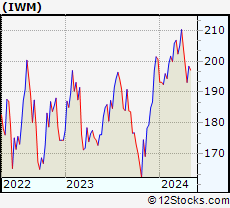
| SmallCap segment as represented by
IWM, an exchange-traded fund [ETF], holds basket of thousands of smallcap stocks from across all major sectors of the US stock market. The smallcap index (contains stocks like Riverbed & Sotheby's) is up by 0.59% and is currently underperforming the overall market by -6.29% year-to-date. Below is a quick view of technical charts and trends: | |
 IWM Weekly Chart |
|
| Long Term Trend: Not Good | |
| Medium Term Trend: Very Good | |
 IWM Daily Chart |
|
| Short Term Trend: Very Good | |
| Overall Trend Score: 69 | |
| YTD Performance: 0.59% | |
| **Trend Scores & Views Are Only For Educational Purposes And Not For Investing | |
| 12Stocks.com: Top Performing Small Cap Index Stocks | ||||||||||||||||||||||||||||||||||||||||||||||||
 The top performing Small Cap Index stocks year to date are
Now, more recently, over last week, the top performing Small Cap Index stocks on the move are


|
||||||||||||||||||||||||||||||||||||||||||||||||
| 12Stocks.com: Investing in Smallcap Index using Exchange Traded Funds | |
|
The following table shows list of key exchange traded funds (ETF) that
help investors track Smallcap index. The following list also includes leveraged ETF funds that track twice or thrice the daily returns of Smallcap indices. Short or inverse ETF funds move in the opposite direction to the index they track and are useful during market pullbacks or during bear markets. Quick View: Move mouse or cursor over ETF symbol (ticker) to view short-term technical chart and over ETF name to view long term chart. Click on ticker or stock name for detailed view. Click on to add stock symbol to your watchlist and to view watchlist. |
12Stocks.com List of ETFs that track Smallcap Index
| Ticker | ETF Name | Watchlist | Recent Price | Smart Investing & Trading Score | Change % | Week % | Year-to-date % |
| IWM | iShares Russell 2000 | | 201.90 | 69 | 0.99 | 1.77 | 0.59% |
| IJR | iShares Core S&P Small-Cap | | 107.13 | 82 | 0.75 | 1.4 | -1.03% |
| VTWO | Vanguard Russell 2000 ETF | | 81.61 | 69 | 0.94 | 1.73 | 0.63% |
| IWN | iShares Russell 2000 Value | | 154.21 | 100 | 0.87 | 2.03 | -0.72% |
| IJS | iShares S&P Small-Cap 600 Value | | 98.72 | 64 | 0.71 | 1.57 | -4.22% |
| IWO | iShares Russell 2000 Growth | | 256.87 | 57 | 0.99 | 1.49 | 1.84% |
| IJT | iShares S&P Small-Cap 600 Growth | | 127.76 | 95 | 0.82 | 1.32 | 2.09% |
| XSLV | PowerShares S&P SmallCap Low Volatil ETF | | 43.22 | 87 | 0.19 | 1.17 | -2.11% |
| SBB | ProShares Short SmallCap600 | | 16.16 | 13 | -1.28 | -1.37 | 1.44% |
| SDD | ProShares UltraShort SmallCap600 | | 18.84 | 23 | -2.41 | -2.61 | 2.27% |
| SAA | ProShares Ultra SmallCap600 | | 23.59 | 69 | 2.86 | 2.39 | -5.45% |
| SMLV | SPDR SSGA US Small Cap Low Volatil ETF | | 109.69 | 87 | 0.78 | 2.01 | -2.52% |
| 12Stocks.com: Charts, Trends, Fundamental Data and Performances of SmallCap Stocks | |
|
We now take in-depth look at all SmallCap stocks including charts, multi-period performances and overall trends (as measured by Smart Investing & Trading Score). One can sort SmallCap stocks (click link to choose) by Daily, Weekly and by Year-to-Date performances. Also, one can sort by size of the company or by market capitalization. |
| Select Your Default Chart Type: | |||||
| |||||
| Click on stock symbol or name for detailed view. Click on to add stock symbol to your watchlist and to view watchlist. Quick View: Move mouse or cursor over "Daily" to quickly view daily technical stock chart and over "Weekly" to view weekly technical stock chart. | |||||

 | KLIC Kulicke and Soffa Industries, Inc. |
| Sector: Technology | |
| SubSector: Semiconductor Equipment & Materials | |
| MarketCap: 1336.68 Millions | |
| Recent Price: 47.00 Smart Investing & Trading Score: 42 | |
| Day Percent Change: 2.13% Day Change: 0.98 | |
| Week Change: -0.04% Year-to-date Change: -14.1% | |
| KLIC Links: Profile News Message Board | |
| Charts:- Daily , Weekly | |
| Add KLIC to Watchlist: View: Get Complete KLIC Trend Analysis ➞ | |
 | OPTN OptiNose, Inc. |
| Sector: Health Care | |
| SubSector: Drugs - Generic | |
| MarketCap: 183.385 Millions | |
| Recent Price: 1.01 Smart Investing & Trading Score: 42 | |
| Day Percent Change: 15.09% Day Change: 0.13 | |
| Week Change: 17.39% Year-to-date Change: -21.7% | |
| OPTN Links: Profile News Message Board | |
| Charts:- Daily , Weekly | |
| Add OPTN to Watchlist: View: Get Complete OPTN Trend Analysis ➞ | |
 | EYE National Vision Holdings, Inc. |
| Sector: Services & Goods | |
| SubSector: Specialty Retail, Other | |
| MarketCap: 1290.84 Millions | |
| Recent Price: 17.90 Smart Investing & Trading Score: 42 | |
| Day Percent Change: 1.88% Day Change: 0.33 | |
| Week Change: 0.11% Year-to-date Change: -14.5% | |
| EYE Links: Profile News Message Board | |
| Charts:- Daily , Weekly | |
| Add EYE to Watchlist: View: Get Complete EYE Trend Analysis ➞ | |
 | SHEN Shenandoah Telecommunications Company |
| Sector: Technology | |
| SubSector: Telecom Services - Domestic | |
| MarketCap: 2329.67 Millions | |
| Recent Price: 13.47 Smart Investing & Trading Score: 42 | |
| Day Percent Change: 1.66% Day Change: 0.22 | |
| Week Change: 0.6% Year-to-date Change: -37.7% | |
| SHEN Links: Profile News Message Board | |
| Charts:- Daily , Weekly | |
| Add SHEN to Watchlist: View: Get Complete SHEN Trend Analysis ➞ | |
 | HELE Helen of Troy Limited |
| Sector: Consumer Staples | |
| SubSector: Housewares & Accessories | |
| MarketCap: 3199.53 Millions | |
| Recent Price: 96.54 Smart Investing & Trading Score: 42 | |
| Day Percent Change: 1.66% Day Change: 1.58 | |
| Week Change: 5.84% Year-to-date Change: -20.1% | |
| HELE Links: Profile News Message Board | |
| Charts:- Daily , Weekly | |
| Add HELE to Watchlist: View: Get Complete HELE Trend Analysis ➞ | |
 | LCII LCI Industries |
| Sector: Consumer Staples | |
| SubSector: Recreational Vehicles | |
| MarketCap: 1663.59 Millions | |
| Recent Price: 106.84 Smart Investing & Trading Score: 42 | |
| Day Percent Change: 1.62% Day Change: 1.70 | |
| Week Change: -0.45% Year-to-date Change: -15.0% | |
| LCII Links: Profile News Message Board | |
| Charts:- Daily , Weekly | |
| Add LCII to Watchlist: View: Get Complete LCII Trend Analysis ➞ | |
 | SNCY Sun Country Airlines Holdings, Inc. |
| Sector: Industrials | |
| SubSector: Airlines | |
| MarketCap: 1230 Millions | |
| Recent Price: 13.86 Smart Investing & Trading Score: 42 | |
| Day Percent Change: 1.61% Day Change: 0.22 | |
| Week Change: 1.46% Year-to-date Change: -12.4% | |
| SNCY Links: Profile News Message Board | |
| Charts:- Daily , Weekly | |
| Add SNCY to Watchlist: View: Get Complete SNCY Trend Analysis ➞ | |
 | SSD Simpson Manufacturing Co., Inc. |
| Sector: Industrials | |
| SubSector: Small Tools & Accessories | |
| MarketCap: 2850.16 Millions | |
| Recent Price: 181.05 Smart Investing & Trading Score: 42 | |
| Day Percent Change: 1.59% Day Change: 2.84 | |
| Week Change: 4.29% Year-to-date Change: -8.6% | |
| SSD Links: Profile News Message Board | |
| Charts:- Daily , Weekly | |
| Add SSD to Watchlist: View: Get Complete SSD Trend Analysis ➞ | |
 | SCLX Scilex Holding Company |
| Sector: Health Care | |
| SubSector: Drug Manufacturers - General | |
| MarketCap: 927 Millions | |
| Recent Price: 0.87 Smart Investing & Trading Score: 42 | |
| Day Percent Change: 1.59% Day Change: 0.01 | |
| Week Change: -2.19% Year-to-date Change: -55.4% | |
| SCLX Links: Profile News Message Board | |
| Charts:- Daily , Weekly | |
| Add SCLX to Watchlist: View: Get Complete SCLX Trend Analysis ➞ | |
 | KOS Kosmos Energy Ltd. |
| Sector: Energy | |
| SubSector: Independent Oil & Gas | |
| MarketCap: 261.693 Millions | |
| Recent Price: 5.81 Smart Investing & Trading Score: 42 | |
| Day Percent Change: 1.57% Day Change: 0.09 | |
| Week Change: -1.19% Year-to-date Change: -13.4% | |
| KOS Links: Profile News Message Board | |
| Charts:- Daily , Weekly | |
| Add KOS to Watchlist: View: Get Complete KOS Trend Analysis ➞ | |
 | AVAH Aveanna Healthcare Holdings Inc. |
| Sector: Health Care | |
| SubSector: Medical Care Facilities | |
| MarketCap: 305 Millions | |
| Recent Price: 2.27 Smart Investing & Trading Score: 42 | |
| Day Percent Change: 1.57% Day Change: 0.04 | |
| Week Change: 3.18% Year-to-date Change: -15.8% | |
| AVAH Links: Profile News Message Board | |
| Charts:- Daily , Weekly | |
| Add AVAH to Watchlist: View: Get Complete AVAH Trend Analysis ➞ | |
 | PCH PotlatchDeltic Corporation |
| Sector: Industrials | |
| SubSector: Lumber, Wood Production | |
| MarketCap: 2314.68 Millions | |
| Recent Price: 42.00 Smart Investing & Trading Score: 42 | |
| Day Percent Change: 1.42% Day Change: 0.59 | |
| Week Change: 2.31% Year-to-date Change: -14.5% | |
| PCH Links: Profile News Message Board | |
| Charts:- Daily , Weekly | |
| Add PCH to Watchlist: View: Get Complete PCH Trend Analysis ➞ | |
 | CRBU Caribou Biosciences, Inc. |
| Sector: Health Care | |
| SubSector: Biotechnology | |
| MarketCap: 258 Millions | |
| Recent Price: 3.71 Smart Investing & Trading Score: 42 | |
| Day Percent Change: 1.37% Day Change: 0.05 | |
| Week Change: -0.13% Year-to-date Change: -35.1% | |
| CRBU Links: Profile News Message Board | |
| Charts:- Daily , Weekly | |
| Add CRBU to Watchlist: View: Get Complete CRBU Trend Analysis ➞ | |
 | BRKL Brookline Bancorp, Inc. |
| Sector: Financials | |
| SubSector: Savings & Loans | |
| MarketCap: 894.43 Millions | |
| Recent Price: 8.85 Smart Investing & Trading Score: 42 | |
| Day Percent Change: 1.26% Day Change: 0.11 | |
| Week Change: 6.18% Year-to-date Change: -18.9% | |
| BRKL Links: Profile News Message Board | |
| Charts:- Daily , Weekly | |
| Add BRKL to Watchlist: View: Get Complete BRKL Trend Analysis ➞ | |
 | MCRI Monarch Casino & Resort, Inc. |
| Sector: Services & Goods | |
| SubSector: Resorts & Casinos | |
| MarketCap: 352.894 Millions | |
| Recent Price: 69.01 Smart Investing & Trading Score: 42 | |
| Day Percent Change: 1.26% Day Change: 0.86 | |
| Week Change: 1.38% Year-to-date Change: -0.2% | |
| MCRI Links: Profile News Message Board | |
| Charts:- Daily , Weekly | |
| Add MCRI to Watchlist: View: Get Complete MCRI Trend Analysis ➞ | |
 | TMCI Treace Medical Concepts, Inc. |
| Sector: Health Care | |
| SubSector: Medical Devices | |
| MarketCap: 1550 Millions | |
| Recent Price: 10.85 Smart Investing & Trading Score: 42 | |
| Day Percent Change: 1.21% Day Change: 0.13 | |
| Week Change: 4.43% Year-to-date Change: -14.8% | |
| TMCI Links: Profile News Message Board | |
| Charts:- Daily , Weekly | |
| Add TMCI to Watchlist: View: Get Complete TMCI Trend Analysis ➞ | |
 | DMRC Digimarc Corporation |
| Sector: Technology | |
| SubSector: Information Technology Services | |
| MarketCap: 222.268 Millions | |
| Recent Price: 22.88 Smart Investing & Trading Score: 42 | |
| Day Percent Change: 1.19% Day Change: 0.27 | |
| Week Change: 2.23% Year-to-date Change: -36.7% | |
| DMRC Links: Profile News Message Board | |
| Charts:- Daily , Weekly | |
| Add DMRC to Watchlist: View: Get Complete DMRC Trend Analysis ➞ | |
 | RDVT Red Violet, Inc. |
| Sector: Technology | |
| SubSector: Application Software | |
| MarketCap: 215.162 Millions | |
| Recent Price: 17.63 Smart Investing & Trading Score: 42 | |
| Day Percent Change: 1.15% Day Change: 0.20 | |
| Week Change: 3.77% Year-to-date Change: -11.7% | |
| RDVT Links: Profile News Message Board | |
| Charts:- Daily , Weekly | |
| Add RDVT to Watchlist: View: Get Complete RDVT Trend Analysis ➞ | |
 | HLLY Holley Inc. |
| Sector: Services & Goods | |
| SubSector: Auto Parts | |
| MarketCap: 469 Millions | |
| Recent Price: 4.10 Smart Investing & Trading Score: 42 | |
| Day Percent Change: 0.99% Day Change: 0.04 | |
| Week Change: 2.5% Year-to-date Change: -17.4% | |
| HLLY Links: Profile News Message Board | |
| Charts:- Daily , Weekly | |
| Add HLLY to Watchlist: View: Get Complete HLLY Trend Analysis ➞ | |
 | HOFT Hooker Furniture Corporation |
| Sector: Consumer Staples | |
| SubSector: Home Furnishings & Fixtures | |
| MarketCap: 173.235 Millions | |
| Recent Price: 17.60 Smart Investing & Trading Score: 42 | |
| Day Percent Change: 0.98% Day Change: 0.17 | |
| Week Change: 1.5% Year-to-date Change: -32.5% | |
| HOFT Links: Profile News Message Board | |
| Charts:- Daily , Weekly | |
| Add HOFT to Watchlist: View: Get Complete HOFT Trend Analysis ➞ | |
 | LZB La-Z-Boy Incorporated |
| Sector: Consumer Staples | |
| SubSector: Home Furnishings & Fixtures | |
| MarketCap: 951.635 Millions | |
| Recent Price: 33.21 Smart Investing & Trading Score: 42 | |
| Day Percent Change: 0.70% Day Change: 0.23 | |
| Week Change: 0.3% Year-to-date Change: -10.1% | |
| LZB Links: Profile News Message Board | |
| Charts:- Daily , Weekly | |
| Add LZB to Watchlist: View: Get Complete LZB Trend Analysis ➞ | |
 | FRBA First Bank |
| Sector: Financials | |
| SubSector: Regional - Mid-Atlantic Banks | |
| MarketCap: 124.859 Millions | |
| Recent Price: 12.17 Smart Investing & Trading Score: 42 | |
| Day Percent Change: 0.58% Day Change: 0.07 | |
| Week Change: 0.25% Year-to-date Change: -17.2% | |
| FRBA Links: Profile News Message Board | |
| Charts:- Daily , Weekly | |
| Add FRBA to Watchlist: View: Get Complete FRBA Trend Analysis ➞ | |
 | FBNC First Bancorp |
| Sector: Financials | |
| SubSector: Regional - Mid-Atlantic Banks | |
| MarketCap: 664.959 Millions | |
| Recent Price: 31.85 Smart Investing & Trading Score: 42 | |
| Day Percent Change: 0.47% Day Change: 0.15 | |
| Week Change: 1.05% Year-to-date Change: -13.9% | |
| FBNC Links: Profile News Message Board | |
| Charts:- Daily , Weekly | |
| Add FBNC to Watchlist: View: Get Complete FBNC Trend Analysis ➞ | |
 | SSB South State Corporation |
| Sector: Financials | |
| SubSector: Regional - Mid-Atlantic Banks | |
| MarketCap: 2113.49 Millions | |
| Recent Price: 78.57 Smart Investing & Trading Score: 42 | |
| Day Percent Change: 0.41% Day Change: 0.32 | |
| Week Change: 0.8% Year-to-date Change: -7.0% | |
| SSB Links: Profile News Message Board | |
| Charts:- Daily , Weekly | |
| Add SSB to Watchlist: View: Get Complete SSB Trend Analysis ➞ | |
 | BTAI BioXcel Therapeutics, Inc. |
| Sector: Health Care | |
| SubSector: Biotechnology | |
| MarketCap: 487.485 Millions | |
| Recent Price: 2.57 Smart Investing & Trading Score: 42 | |
| Day Percent Change: 0.39% Day Change: 0.01 | |
| Week Change: -2.28% Year-to-date Change: -12.9% | |
| BTAI Links: Profile News Message Board | |
| Charts:- Daily , Weekly | |
| Add BTAI to Watchlist: View: Get Complete BTAI Trend Analysis ➞ | |
| Too many stocks? View smallcap stocks filtered by marketcap & sector |
| Marketcap: All SmallCap Stocks (default-no microcap), Large, Mid-Range, Small & MicroCap |
| Sector: Tech, Finance, Energy, Staples, Retail, Industrial, Materials, Utilities & Medical |
|
Best Stocks Today 12Stocks.com |
© 2024 12Stocks.com Terms & Conditions Privacy Contact Us
All Information Provided Only For Education And Not To Be Used For Investing or Trading. See Terms & Conditions


One More Thing ... Get Best Stocks Delivered Daily!
Never Ever Miss A Move With Our Top Ten Stocks Lists
Find Best Stocks In Any Market - Bull or Bear Market
Take A Peek At Our Top Ten Stocks Lists: Daily, Weekly, Year-to-Date & Top Trends
Find Best Stocks In Any Market - Bull or Bear Market
Take A Peek At Our Top Ten Stocks Lists: Daily, Weekly, Year-to-Date & Top Trends
Smallcap Stocks With Best Up Trends [0-bearish to 100-bullish]: Twist Bioscience[100], WideOpenWest [100], Joint [100], FTC Solar[100], Origin Materials[100], Alignment Healthcare[100], Clarus [100], IES [100], Emergent BioSolutions[100], Enovix [100], El Pollo[100]
Best Smallcap Stocks Year-to-Date:
Janux [482.74%], Viking [313.59%], Longboard [272.5%], Alpine Immune[239.29%], Bakkt [199.55%], Avidity Biosciences[192.48%], Vera [189.47%], Cullinan Oncology[176.9%], Super Micro[175.35%], Y-mAbs [151.47%], Sana [149.33%] Best Smallcap Stocks This Week:
Emergent BioSolutions[102.6%], Deciphera [73.24%], Origin Materials[66.52%], Eyenovia [60.78%], Cue Biopharma[56.04%], Aspen Aerogels[55.96%], Enovix [54.02%], Luna Innovations[53.77%], Codexis [47.37%], Carvana Co[44.31%], Office Properties[42.79%] Best Smallcap Stocks Daily:
Luna Innovations[36.00%], Twist Bioscience[28.74%], Ardelyx [28.42%], WideOpenWest [28.23%], 2U [26.63%], Joint [25.35%], FTC Solar[25.09%], Origin Materials[22.23%], Alignment Healthcare[21.97%], Clarus [18.67%], Aurora Innovation[18.09%]