
 Login Sign Up


| |||||
 |  | ||||

| 12Stocks.com Market Intelligence |
Best SmallCap Stocks
|
| In a hurry? Small Cap Stock Lists: Performance Trends Table, Stock Charts
Sort Small Cap stocks: Daily, Weekly, Year-to-Date, Market Cap & Trends. Filter Small Cap stocks list by sector: Show all, Tech, Finance, Energy, Staples, Retail, Industrial, Materials, Utilities and HealthCare Filter Small Cap stocks list by size: All Large Medium Small and MicroCap |
| 12Stocks.com Small Cap Stocks Performances & Trends Daily | |||||||||
|
|  The overall Smart Investing & Trading Score is 7 (0-bearish to 100-bullish) which puts Small Cap index in short term bearish trend. The Smart Investing & Trading Score from previous trading session is 41 and hence a deterioration of trend.
| ||||||||
Here are the Smart Investing & Trading Scores of the most requested small cap stocks at 12Stocks.com (click stock name for detailed review):
|


| 12Stocks.com: Investing in Smallcap Index with Stocks | |
|
The following table helps investors and traders sort through current performance and trends (as measured by Smart Investing & Trading Score) of various
stocks in the Smallcap Index. Quick View: Move mouse or cursor over stock symbol (ticker) to view short-term technical chart and over stock name to view long term chart. Click on  to add stock symbol to your watchlist and to add stock symbol to your watchlist and  to view watchlist. Click on any ticker or stock name for detailed market intelligence report for that stock. to view watchlist. Click on any ticker or stock name for detailed market intelligence report for that stock. |
12Stocks.com Performance of Stocks in Smallcap Index
| Ticker | Stock Name | Watchlist | Category | Recent Price | Smart Investing & Trading Score | Change % | YTD Change% |
| ARCH | Arch Coal |   | Materials | 157.66 | 18 | -0.71% | -4.99% |
| AIT | Applied Industrial | | Services & Goods | 182.03 | 18 | -0.67% | 5.41% |
| CCS | Century Communities | | Industrials | 78.80 | 18 | -0.66% | -13.54% |
| ACCO | ACCO Brands | | Consumer Staples | 4.80 | 18 | -0.41% | -21.05% |
| FENC | Fennec | | Health Care | 9.16 | 18 | -0.22% | -18.36% |
| OPTN | OptiNose | | Health Care | 0.85 | 17 | 3.50% | -34.13% |
| ACLX | Arcellx | | Health Care | 51.41 | 17 | 2.76% | -7.88% |
| CYTK | Cytokinetics | | Health Care | 62.94 | 17 | 2.64% | -24.61% |
| FBNC | First Bancorp | | Financials | 31.14 | 17 | 2.40% | -15.86% |
| SSB | South State | | Financials | 77.17 | 17 | 1.95% | -8.61% |
| FRBA | First Bank | | Financials | 11.84 | 17 | 1.76% | -19.49% |
| KROS | Keros | | Health Care | 57.36 | 17 | 1.72% | 43.98% |
| SFNC | Simmons First | | Financials | 17.36 | 17 | 1.58% | -12.50% |
| SRI | Stoneridge | | Consumer Staples | 15.18 | 17 | 1.30% | -22.46% |
| OVID | Ovid | | Health Care | 3.08 | 17 | 0.98% | -4.35% |
| PAX | Patria s | | Financials | 13.48 | 17 | 0.67% | -14.09% |
| TDUP | ThredUp | | Services & Goods | 1.61 | 17 | 0.63% | -28.76% |
| SMRT | SmartRent | | Technology | 2.35 | 17 | 0.21% | -26.33% |
| IBP | Installed Building | | Industrials | 236.04 | 17 | 0.13% | 29.11% |
| BBCP | Concrete Pumping | | Industrials | 6.65 | 17 | 0.00% | -18.90% |
| BARK | BARK | | Services & Goods | 1.10 | 17 | 0.00% | 37.47% |
| PAR | PAR | | Technology | 41.97 | 17 | -4.49% | -3.61% |
| MQ | Marqeta | | Technology | 5.38 | 17 | -3.24% | -23.53% |
| BRZE | Braze | | Technology | 40.65 | 17 | -2.91% | -23.65% |
| ACLS | Axcelis | | Technology | 101.21 | 17 | -2.23% | -21.96% |
| For chart view version of above stock list: Chart View ➞ 0 - 25 , 25 - 50 , 50 - 75 , 75 - 100 , 100 - 125 , 125 - 150 , 150 - 175 , 175 - 200 , 200 - 225 , 225 - 250 , 250 - 275 , 275 - 300 , 300 - 325 , 325 - 350 , 350 - 375 , 375 - 400 , 400 - 425 , 425 - 450 , 450 - 475 , 475 - 500 , 500 - 525 , 525 - 550 , 550 - 575 , 575 - 600 , 600 - 625 , 625 - 650 , 650 - 675 , 675 - 700 , 700 - 725 , 725 - 750 , 750 - 775 , 775 - 800 , 800 - 825 , 825 - 850 , 850 - 875 , 875 - 900 , 900 - 925 , 925 - 950 , 950 - 975 , 975 - 1000 , 1000 - 1025 , 1025 - 1050 , 1050 - 1075 , 1075 - 1100 , 1100 - 1125 , 1125 - 1150 , 1150 - 1175 , 1175 - 1200 , 1200 - 1225 , 1225 - 1250 , 1250 - 1275 , 1275 - 1300 , 1300 - 1325 , 1325 - 1350 , 1350 - 1375 , 1375 - 1400 , 1400 - 1425 , 1425 - 1450 , 1450 - 1475 , 1475 - 1500 , 1500 - 1525 , 1525 - 1550 , 1550 - 1575 | ||
 | Click To Change The Sort Order: By Market Cap or Company Size Performance: Year-to-date, Week and Day |  |
| Too many stocks? View smallcap stocks filtered by marketcap & sector |
| Marketcap: All SmallCap Stocks (default-no microcap), Large, Mid-Range, Small |
| Smallcap Sector: Tech, Finance, Energy, Staples, Retail, Industrial, Materials, & Medical |
|
Get the most comprehensive stock market coverage daily at 12Stocks.com ➞ Best Stocks Today ➞ Best Stocks Weekly ➞ Best Stocks Year-to-Date ➞ Best Stocks Trends ➞  Best Stocks Today 12Stocks.com Best Nasdaq Stocks ➞ Best S&P 500 Stocks ➞ Best Tech Stocks ➞ Best Biotech Stocks ➞ |
| Detailed Overview of SmallCap Stocks |
| SmallCap Technical Overview, Leaders & Laggards, Top SmallCap ETF Funds & Detailed SmallCap Stocks List, Charts, Trends & More |
| Smallcap: Technical Analysis, Trends & YTD Performance | |
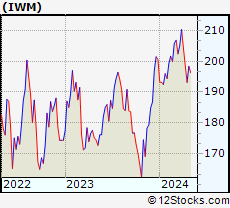
| SmallCap segment as represented by
IWM, an exchange-traded fund [ETF], holds basket of thousands of smallcap stocks from across all major sectors of the US stock market. The smallcap index (contains stocks like Riverbed & Sotheby's) is down by -2.65% and is currently underperforming the overall market by -7.34% year-to-date. Below is a quick view of technical charts and trends: | |
 IWM Weekly Chart |
|
| Long Term Trend: Not Good | |
| Medium Term Trend: Not Good | |
 IWM Daily Chart |
|
| Short Term Trend: Not Good | |
| Overall Trend Score: 7 | |
| YTD Performance: -2.65% | |
| **Trend Scores & Views Are Only For Educational Purposes And Not For Investing | |
| 12Stocks.com: Top Performing Small Cap Index Stocks | ||||||||||||||||||||||||||||||||||||||||||||||||
 The top performing Small Cap Index stocks year to date are
Now, more recently, over last week, the top performing Small Cap Index stocks on the move are


|
||||||||||||||||||||||||||||||||||||||||||||||||
| 12Stocks.com: Investing in Smallcap Index using Exchange Traded Funds | |
|
The following table shows list of key exchange traded funds (ETF) that
help investors track Smallcap index. The following list also includes leveraged ETF funds that track twice or thrice the daily returns of Smallcap indices. Short or inverse ETF funds move in the opposite direction to the index they track and are useful during market pullbacks or during bear markets. Quick View: Move mouse or cursor over ETF symbol (ticker) to view short-term technical chart and over ETF name to view long term chart. Click on ticker or stock name for detailed view. Click on to add stock symbol to your watchlist and to view watchlist. |
12Stocks.com List of ETFs that track Smallcap Index
| Ticker | ETF Name | Watchlist | Recent Price | Smart Investing & Trading Score | Change % | Week % | Year-to-date % |
| IWM | iShares Russell 2000 | | 195.39 | 7 | -0.26 | -1.51 | -2.65% |
| IJR | iShares Core S&P Small-Cap | | 104.72 | 15 | 0.32 | -0.88 | -3.26% |
| VTWO | Vanguard Russell 2000 ETF | | 79.15 | 7 | -0.01 | -1.33 | -2.4% |
| IWN | iShares Russell 2000 Value | | 149.66 | 15 | 0.42 | -0.98 | -3.65% |
| IWO | iShares Russell 2000 Growth | | 248.76 | 7 | -0.62 | -1.71 | -1.37% |
| IJS | iShares S&P Small-Cap 600 Value | | 96.40 | 8 | 0.33 | -0.81 | -6.47% |
| IJT | iShares S&P Small-Cap 600 Growth | | 125.02 | 15 | 0.34 | -0.85 | -0.1% |
| XSLV | PowerShares S&P SmallCap Low Volatil ETF | | 42.75 | 38 | 0.49 | 0.07 | -3.17% |
| 12Stocks.com: Charts, Trends, Fundamental Data and Performances of SmallCap Stocks | |
|
We now take in-depth look at all SmallCap stocks including charts, multi-period performances and overall trends (as measured by Smart Investing & Trading Score). One can sort SmallCap stocks (click link to choose) by Daily, Weekly and by Year-to-Date performances. Also, one can sort by size of the company or by market capitalization. |
| Select Your Default Chart Type: | |||||
| |||||
| Click on stock symbol or name for detailed view. Click on to add stock symbol to your watchlist and to view watchlist. Quick View: Move mouse or cursor over "Daily" to quickly view daily technical stock chart and over "Weekly" to view weekly technical stock chart. | |||||

 | ARCH Arch Coal, Inc. |
| Sector: Materials | |
| SubSector: Industrial Metals & Minerals | |
| MarketCap: 547.21 Millions | |
| Recent Price: 157.66 Smart Investing & Trading Score: 18 | |
| Day Percent Change: -0.71% Day Change: -1.12 | |
| Week Change: -4.11% Year-to-date Change: -5.0% | |
| ARCH Links: Profile News Message Board | |
| Charts:- Daily , Weekly | |
| Add ARCH to Watchlist: View: Get Complete ARCH Trend Analysis ➞ | |
 | AIT Applied Industrial Technologies, Inc. |
| Sector: Services & Goods | |
| SubSector: Industrial Equipment Wholesale | |
| MarketCap: 1531.58 Millions | |
| Recent Price: 182.03 Smart Investing & Trading Score: 18 | |
| Day Percent Change: -0.67% Day Change: -1.22 | |
| Week Change: 0.63% Year-to-date Change: 5.4% | |
| AIT Links: Profile News Message Board | |
| Charts:- Daily , Weekly | |
| Add AIT to Watchlist: View: Get Complete AIT Trend Analysis ➞ | |
 | CCS Century Communities, Inc. |
| Sector: Industrials | |
| SubSector: Residential Construction | |
| MarketCap: 459.206 Millions | |
| Recent Price: 78.80 Smart Investing & Trading Score: 18 | |
| Day Percent Change: -0.66% Day Change: -0.52 | |
| Week Change: -0.03% Year-to-date Change: -13.5% | |
| CCS Links: Profile News Message Board | |
| Charts:- Daily , Weekly | |
| Add CCS to Watchlist: View: Get Complete CCS Trend Analysis ➞ | |
 | ACCO ACCO Brands Corporation |
| Sector: Consumer Staples | |
| SubSector: Office Supplies | |
| MarketCap: 448.2 Millions | |
| Recent Price: 4.80 Smart Investing & Trading Score: 18 | |
| Day Percent Change: -0.41% Day Change: -0.02 | |
| Week Change: -0.62% Year-to-date Change: -21.1% | |
| ACCO Links: Profile News Message Board | |
| Charts:- Daily , Weekly | |
| Add ACCO to Watchlist: View: Get Complete ACCO Trend Analysis ➞ | |
 | FENC Fennec Pharmaceuticals Inc. |
| Sector: Health Care | |
| SubSector: Biotechnology | |
| MarketCap: 126.785 Millions | |
| Recent Price: 9.16 Smart Investing & Trading Score: 18 | |
| Day Percent Change: -0.22% Day Change: -0.02 | |
| Week Change: -0.54% Year-to-date Change: -18.4% | |
| FENC Links: Profile News Message Board | |
| Charts:- Daily , Weekly | |
| Add FENC to Watchlist: View: Get Complete FENC Trend Analysis ➞ | |
 | OPTN OptiNose, Inc. |
| Sector: Health Care | |
| SubSector: Drugs - Generic | |
| MarketCap: 183.385 Millions | |
| Recent Price: 0.85 Smart Investing & Trading Score: 17 | |
| Day Percent Change: 3.50% Day Change: 0.03 | |
| Week Change: -1.24% Year-to-date Change: -34.1% | |
| OPTN Links: Profile News Message Board | |
| Charts:- Daily , Weekly | |
| Add OPTN to Watchlist: View: Get Complete OPTN Trend Analysis ➞ | |
 | ACLX Arcellx, Inc. |
| Sector: Health Care | |
| SubSector: Biotechnology | |
| MarketCap: 1530 Millions | |
| Recent Price: 51.41 Smart Investing & Trading Score: 17 | |
| Day Percent Change: 2.76% Day Change: 1.38 | |
| Week Change: -0.89% Year-to-date Change: -7.9% | |
| ACLX Links: Profile News Message Board | |
| Charts:- Daily , Weekly | |
| Add ACLX to Watchlist: View: Get Complete ACLX Trend Analysis ➞ | |
 | CYTK Cytokinetics, Incorporated |
| Sector: Health Care | |
| SubSector: Biotechnology | |
| MarketCap: 654.285 Millions | |
| Recent Price: 62.94 Smart Investing & Trading Score: 17 | |
| Day Percent Change: 2.64% Day Change: 1.62 | |
| Week Change: -3.67% Year-to-date Change: -24.6% | |
| CYTK Links: Profile News Message Board | |
| Charts:- Daily , Weekly | |
| Add CYTK to Watchlist: View: Get Complete CYTK Trend Analysis ➞ | |
 | FBNC First Bancorp |
| Sector: Financials | |
| SubSector: Regional - Mid-Atlantic Banks | |
| MarketCap: 664.959 Millions | |
| Recent Price: 31.14 Smart Investing & Trading Score: 17 | |
| Day Percent Change: 2.40% Day Change: 0.73 | |
| Week Change: -1.21% Year-to-date Change: -15.9% | |
| FBNC Links: Profile News Message Board | |
| Charts:- Daily , Weekly | |
| Add FBNC to Watchlist: View: Get Complete FBNC Trend Analysis ➞ | |
 | SSB South State Corporation |
| Sector: Financials | |
| SubSector: Regional - Mid-Atlantic Banks | |
| MarketCap: 2113.49 Millions | |
| Recent Price: 77.17 Smart Investing & Trading Score: 17 | |
| Day Percent Change: 1.95% Day Change: 1.47 | |
| Week Change: -0.99% Year-to-date Change: -8.6% | |
| SSB Links: Profile News Message Board | |
| Charts:- Daily , Weekly | |
| Add SSB to Watchlist: View: Get Complete SSB Trend Analysis ➞ | |
 | FRBA First Bank |
| Sector: Financials | |
| SubSector: Regional - Mid-Atlantic Banks | |
| MarketCap: 124.859 Millions | |
| Recent Price: 11.84 Smart Investing & Trading Score: 17 | |
| Day Percent Change: 1.76% Day Change: 0.21 | |
| Week Change: -2.51% Year-to-date Change: -19.5% | |
| FRBA Links: Profile News Message Board | |
| Charts:- Daily , Weekly | |
| Add FRBA to Watchlist: View: Get Complete FRBA Trend Analysis ➞ | |
 | KROS Keros Therapeutics, Inc. |
| Sector: Health Care | |
| SubSector: Biotechnology | |
| MarketCap: 17887 Millions | |
| Recent Price: 57.36 Smart Investing & Trading Score: 17 | |
| Day Percent Change: 1.72% Day Change: 0.97 | |
| Week Change: -0.86% Year-to-date Change: 44.0% | |
| KROS Links: Profile News Message Board | |
| Charts:- Daily , Weekly | |
| Add KROS to Watchlist: View: Get Complete KROS Trend Analysis ➞ | |
 | SFNC Simmons First National Corporation |
| Sector: Financials | |
| SubSector: Money Center Banks | |
| MarketCap: 2125.49 Millions | |
| Recent Price: 17.36 Smart Investing & Trading Score: 17 | |
| Day Percent Change: 1.58% Day Change: 0.27 | |
| Week Change: -0.8% Year-to-date Change: -12.5% | |
| SFNC Links: Profile News Message Board | |
| Charts:- Daily , Weekly | |
| Add SFNC to Watchlist: View: Get Complete SFNC Trend Analysis ➞ | |
 | SRI Stoneridge, Inc. |
| Sector: Consumer Staples | |
| SubSector: Auto Parts | |
| MarketCap: 451.839 Millions | |
| Recent Price: 15.18 Smart Investing & Trading Score: 17 | |
| Day Percent Change: 1.30% Day Change: 0.20 | |
| Week Change: -3.83% Year-to-date Change: -22.5% | |
| SRI Links: Profile News Message Board | |
| Charts:- Daily , Weekly | |
| Add SRI to Watchlist: View: Get Complete SRI Trend Analysis ➞ | |
 | OVID Ovid Therapeutics Inc. |
| Sector: Health Care | |
| SubSector: Biotechnology | |
| MarketCap: 130.385 Millions | |
| Recent Price: 3.08 Smart Investing & Trading Score: 17 | |
| Day Percent Change: 0.98% Day Change: 0.03 | |
| Week Change: -0.65% Year-to-date Change: -4.4% | |
| OVID Links: Profile News Message Board | |
| Charts:- Daily , Weekly | |
| Add OVID to Watchlist: View: Get Complete OVID Trend Analysis ➞ | |
 | PAX Patria Investments Limited |
| Sector: Financials | |
| SubSector: Asset Management | |
| MarketCap: 2130 Millions | |
| Recent Price: 13.48 Smart Investing & Trading Score: 17 | |
| Day Percent Change: 0.67% Day Change: 0.09 | |
| Week Change: -0.81% Year-to-date Change: -14.1% | |
| PAX Links: Profile News Message Board | |
| Charts:- Daily , Weekly | |
| Add PAX to Watchlist: View: Get Complete PAX Trend Analysis ➞ | |
 | TDUP ThredUp Inc. |
| Sector: Services & Goods | |
| SubSector: Internet Retail | |
| MarketCap: 258 Millions | |
| Recent Price: 1.61 Smart Investing & Trading Score: 17 | |
| Day Percent Change: 0.63% Day Change: 0.01 | |
| Week Change: 0% Year-to-date Change: -28.8% | |
| TDUP Links: Profile News Message Board | |
| Charts:- Daily , Weekly | |
| Add TDUP to Watchlist: View: Get Complete TDUP Trend Analysis ➞ | |
 | SMRT SmartRent, Inc. |
| Sector: Technology | |
| SubSector: Software - Application | |
| MarketCap: 733 Millions | |
| Recent Price: 2.35 Smart Investing & Trading Score: 17 | |
| Day Percent Change: 0.21% Day Change: 0.00 | |
| Week Change: -0.42% Year-to-date Change: -26.3% | |
| SMRT Links: Profile News Message Board | |
| Charts:- Daily , Weekly | |
| Add SMRT to Watchlist: View: Get Complete SMRT Trend Analysis ➞ | |
 | IBP Installed Building Products, Inc. |
| Sector: Industrials | |
| SubSector: General Building Materials | |
| MarketCap: 1284.23 Millions | |
| Recent Price: 236.04 Smart Investing & Trading Score: 17 | |
| Day Percent Change: 0.13% Day Change: 0.31 | |
| Week Change: -1.51% Year-to-date Change: 29.1% | |
| IBP Links: Profile News Message Board | |
| Charts:- Daily , Weekly | |
| Add IBP to Watchlist: View: Get Complete IBP Trend Analysis ➞ | |
 | BBCP Concrete Pumping Holdings, Inc. |
| Sector: Industrials | |
| SubSector: General Building Materials | |
| MarketCap: 263.653 Millions | |
| Recent Price: 6.65 Smart Investing & Trading Score: 17 | |
| Day Percent Change: 0.00% Day Change: 0.00 | |
| Week Change: -2.35% Year-to-date Change: -18.9% | |
| BBCP Links: Profile News Message Board | |
| Charts:- Daily , Weekly | |
| Add BBCP to Watchlist: View: Get Complete BBCP Trend Analysis ➞ | |
 | BARK BARK, Inc. |
| Sector: Services & Goods | |
| SubSector: Specialty Retail | |
| MarketCap: 234 Millions | |
| Recent Price: 1.10 Smart Investing & Trading Score: 17 | |
| Day Percent Change: 0.00% Day Change: 0.00 | |
| Week Change: 0% Year-to-date Change: 37.5% | |
| BARK Links: Profile News Message Board | |
| Charts:- Daily , Weekly | |
| Add BARK to Watchlist: View: Get Complete BARK Trend Analysis ➞ | |
 | PAR PAR Technology Corporation |
| Sector: Technology | |
| SubSector: Application Software | |
| MarketCap: 255.862 Millions | |
| Recent Price: 41.97 Smart Investing & Trading Score: 17 | |
| Day Percent Change: -4.49% Day Change: -1.98 | |
| Week Change: -2.94% Year-to-date Change: -3.6% | |
| PAR Links: Profile News Message Board | |
| Charts:- Daily , Weekly | |
| Add PAR to Watchlist: View: Get Complete PAR Trend Analysis ➞ | |
 | MQ Marqeta, Inc. |
| Sector: Technology | |
| SubSector: Software - Infrastructure | |
| MarketCap: 2650 Millions | |
| Recent Price: 5.38 Smart Investing & Trading Score: 17 | |
| Day Percent Change: -3.24% Day Change: -0.18 | |
| Week Change: -0.65% Year-to-date Change: -23.5% | |
| MQ Links: Profile News Message Board | |
| Charts:- Daily , Weekly | |
| Add MQ to Watchlist: View: Get Complete MQ Trend Analysis ➞ | |
 | BRZE Braze, Inc. |
| Sector: Technology | |
| SubSector: Software - Application | |
| MarketCap: 4340 Millions | |
| Recent Price: 40.65 Smart Investing & Trading Score: 17 | |
| Day Percent Change: -2.91% Day Change: -1.22 | |
| Week Change: -2.56% Year-to-date Change: -23.7% | |
| BRZE Links: Profile News Message Board | |
| Charts:- Daily , Weekly | |
| Add BRZE to Watchlist: View: Get Complete BRZE Trend Analysis ➞ | |
 | ACLS Axcelis Technologies, Inc. |
| Sector: Technology | |
| SubSector: Semiconductor Equipment & Materials | |
| MarketCap: 498.518 Millions | |
| Recent Price: 101.21 Smart Investing & Trading Score: 17 | |
| Day Percent Change: -2.23% Day Change: -2.31 | |
| Week Change: -1.8% Year-to-date Change: -22.0% | |
| ACLS Links: Profile News Message Board | |
| Charts:- Daily , Weekly | |
| Add ACLS to Watchlist: View: Get Complete ACLS Trend Analysis ➞ | |
| For tabular summary view of above stock list: Summary View ➞ 0 - 25 , 25 - 50 , 50 - 75 , 75 - 100 , 100 - 125 , 125 - 150 , 150 - 175 , 175 - 200 , 200 - 225 , 225 - 250 , 250 - 275 , 275 - 300 , 300 - 325 , 325 - 350 , 350 - 375 , 375 - 400 , 400 - 425 , 425 - 450 , 450 - 475 , 475 - 500 , 500 - 525 , 525 - 550 , 550 - 575 , 575 - 600 , 600 - 625 , 625 - 650 , 650 - 675 , 675 - 700 , 700 - 725 , 725 - 750 , 750 - 775 , 775 - 800 , 800 - 825 , 825 - 850 , 850 - 875 , 875 - 900 , 900 - 925 , 925 - 950 , 950 - 975 , 975 - 1000 , 1000 - 1025 , 1025 - 1050 , 1050 - 1075 , 1075 - 1100 , 1100 - 1125 , 1125 - 1150 , 1150 - 1175 , 1175 - 1200 , 1200 - 1225 , 1225 - 1250 , 1250 - 1275 , 1275 - 1300 , 1300 - 1325 , 1325 - 1350 , 1350 - 1375 , 1375 - 1400 , 1400 - 1425 , 1425 - 1450 , 1450 - 1475 , 1475 - 1500 , 1500 - 1525 , 1525 - 1550 , 1550 - 1575 | ||
| Click To Change The Sort Order: By Market Cap or Company Size Performance: Year-to-date, Week and Day | |
| Select Chart Type: | ||
| Too many stocks? View smallcap stocks filtered by marketcap & sector |
| Marketcap: All SmallCap Stocks (default-no microcap), Large, Mid-Range, Small & MicroCap |
| Sector: Tech, Finance, Energy, Staples, Retail, Industrial, Materials, Utilities & Medical |
|
Best Stocks Today 12Stocks.com |
© 2024 12Stocks.com Terms & Conditions Privacy Contact Us
All Information Provided Only For Education And Not To Be Used For Investing or Trading. See Terms & Conditions


One More Thing ... Get Best Stocks Delivered Daily!
Never Ever Miss A Move With Our Top Ten Stocks Lists
Find Best Stocks In Any Market - Bull or Bear Market
Take A Peek At Our Top Ten Stocks Lists: Daily, Weekly, Year-to-Date & Top Trends
Find Best Stocks In Any Market - Bull or Bear Market
Take A Peek At Our Top Ten Stocks Lists: Daily, Weekly, Year-to-Date & Top Trends
Smallcap Stocks With Best Up Trends [0-bearish to 100-bullish]: Surmodics [100], TransMedics Group[100], Rocky Brands[100], A10 s[100], UFP [100], Conduent [100], LendingClub [100], Xencor [100], Luxfer [100], TPG RE[100], PROCEPT BioRobotics[100]
Best Smallcap Stocks Year-to-Date:
Janux [426.11%], Viking [309.94%], Longboard [240.1%], Alpine Immune[239.26%], Cullinan Oncology[174.84%], Avidity Biosciences[167.7%], Vera [165.02%], Bakkt [157.85%], Super Micro[147.95%], Hippo [138.75%], Trevi [118.66%] Best Smallcap Stocks This Week:
Poseida [32.63%], P3 Health[31.62%], Phibro Animal[31.42%], Seres [29.7%], TransMedics Group[28.76%], Cue Biopharma[27.11%], LendingTree [25.75%], Surmodics [24.11%], Harmonic [21.25%], Conduent [19.61%], Eyenovia [19.55%] Best Smallcap Stocks Daily:
Surmodics [26.43%], TransMedics Group[25.95%], Powell Industries[22.27%], Rocky Brands[22.16%], Inari Medical[18.51%], A10 s[18.34%], Ventyx Biosciences[16.91%], Poseida [16.74%], UFP [16.54%], Conduent [16.19%], LendingClub [15.96%]