
 Login Sign Up


| |||||
 |  | ||||

| 12Stocks.com Market Intelligence |
Best SmallCap Stocks
|
| In a hurry? Small Cap Stock Lists: Performance Trends Table, Stock Charts
Sort Small Cap stocks: Daily, Weekly, Year-to-Date, Market Cap & Trends. Filter Small Cap stocks list by sector: Show all, Tech, Finance, Energy, Staples, Retail, Industrial, Materials, Utilities and HealthCare Filter Small Cap stocks list by size: All Large Medium Small and MicroCap |
| 12Stocks.com Small Cap Stocks Performances & Trends Daily | |||||||||
|
|  The overall Smart Investing & Trading Score is 83 (0-bearish to 100-bullish) which puts Small Cap index in short term bullish trend. The Smart Investing & Trading Score from previous trading session is 76 and hence an improvement of trend.
| ||||||||
Here are the Smart Investing & Trading Scores of the most requested small cap stocks at 12Stocks.com (click stock name for detailed review):
|


| 12Stocks.com: Investing in Smallcap Index with Stocks | |
|
The following table helps investors and traders sort through current performance and trends (as measured by Smart Investing & Trading Score) of various
stocks in the Smallcap Index. Quick View: Move mouse or cursor over stock symbol (ticker) to view short-term technical chart and over stock name to view long term chart. Click on  to add stock symbol to your watchlist and to add stock symbol to your watchlist and  to view watchlist. Click on any ticker or stock name for detailed market intelligence report for that stock. to view watchlist. Click on any ticker or stock name for detailed market intelligence report for that stock. |
12Stocks.com Performance of Stocks in Smallcap Index
| Ticker | Stock Name | Watchlist | Category | Recent Price | Smart Investing & Trading Score | Change % | YTD Change% |
| CVI | CVR Energy |   | Energy | 29.47 | 35 | -0.44% | -2.74% |
| COLL | Collegium Pharmaceutical | | Health Care | 34.15 | 35 | 5.17% | 10.95% |
| RPD | Rapid7 | | Technology | 39.56 | 35 | 3.80% | -30.72% |
| AMPL | Amplitude | | Technology | 9.51 | 35 | 2.26% | -25.47% |
| ACAD | ACADIA | | Health Care | 15.10 | 35 | 2.10% | -51.77% |
| CYTK | Cytokinetics | | Health Care | 60.60 | 35 | 1.80% | -27.42% |
| HCKT | Hackett Group | | Technology | 21.59 | 35 | 0.23% | -5.18% |
| CVCO | Cavco Industries | | Industrials | 374.68 | 35 | 0.13% | 8.10% |
| ROIC | Retail Opportunity | | Financials | 12.46 | 35 | -2.27% | -11.19% |
| NYMT | New York | | Financials | 6.17 | 35 | -1.59% | -27.67% |
| FPI | Farmland Partners | | Financials | 11.19 | 35 | -1.58% | -10.34% |
| TSBK | Timberland Bancorp | | Financials | 25.95 | 35 | -0.67% | -17.51% |
| SXI | Standex | | Industrials | 174.26 | 35 | -0.37% | 10.03% |
| INN | Summit Hotel | | Financials | 6.00 | 35 | -0.17% | -10.71% |
| GPRE | Green Plains | | Materials | 19.14 | 35 | -0.10% | -24.11% |
| DYN | Dyne | | Health Care | 35.38 | 34 | 27.82% | 166.02% |
| LNZA | LanzaTech Global | | Industrials | 2.57 | 34 | 2.39% | -48.03% |
| TRVI | Trevi | | Health Care | 2.81 | 34 | 1.44% | 109.70% |
| BFLY | Butterfly | | Health Care | 1.04 | 34 | 0.97% | -7.96% |
| VOR | Vor Biopharma | | Health Care | 1.75 | 34 | -3.59% | -21.40% |
| RDN | Radian Group | | Financials | 30.67 | 34 | -2.88% | 7.43% |
| AKR | Acadia Realty | | Financials | 16.96 | 34 | -1.91% | -0.18% |
| GES | Guess | | Services & Goods | 26.43 | 33 | 0.72% | 14.61% |
| XPEL | XPEL | | Consumer Staples | 34.31 | 33 | 1.96% | -36.29% |
| IMVT | Immunovant | | Health Care | 30.87 | 33 | 0.55% | -26.73% |


| Too many stocks? View smallcap stocks filtered by marketcap & sector |
| Marketcap: All SmallCap Stocks (default-no microcap), Large, Mid-Range, Small |
| Smallcap Sector: Tech, Finance, Energy, Staples, Retail, Industrial, Materials, & Medical |
|
Get the most comprehensive stock market coverage daily at 12Stocks.com ➞ Best Stocks Today ➞ Best Stocks Weekly ➞ Best Stocks Year-to-Date ➞ Best Stocks Trends ➞  Best Stocks Today 12Stocks.com Best Nasdaq Stocks ➞ Best S&P 500 Stocks ➞ Best Tech Stocks ➞ Best Biotech Stocks ➞ |
| Detailed Overview of SmallCap Stocks |
| SmallCap Technical Overview, Leaders & Laggards, Top SmallCap ETF Funds & Detailed SmallCap Stocks List, Charts, Trends & More |
| Smallcap: Technical Analysis, Trends & YTD Performance | |
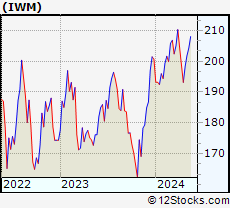
| SmallCap segment as represented by
IWM, an exchange-traded fund [ETF], holds basket of thousands of smallcap stocks from across all major sectors of the US stock market. The smallcap index (contains stocks like Riverbed & Sotheby's) is up by 3.9% and is currently underperforming the overall market by -6.79% year-to-date. Below is a quick view of technical charts and trends: | |
 IWM Weekly Chart |
|
| Long Term Trend: Very Good | |
| Medium Term Trend: Very Good | |
 IWM Daily Chart |
|
| Short Term Trend: Not Good | |
| Overall Trend Score: 83 | |
| YTD Performance: 3.9% | |
| **Trend Scores & Views Are Only For Educational Purposes And Not For Investing | |
| 12Stocks.com: Top Performing Small Cap Index Stocks | ||||||||||||||||||||||||||||||||||||||||||||||||
 The top performing Small Cap Index stocks year to date are
Now, more recently, over last week, the top performing Small Cap Index stocks on the move are


|
||||||||||||||||||||||||||||||||||||||||||||||||
| 12Stocks.com: Investing in Smallcap Index using Exchange Traded Funds | |
|
The following table shows list of key exchange traded funds (ETF) that
help investors track Smallcap index. The following list also includes leveraged ETF funds that track twice or thrice the daily returns of Smallcap indices. Short or inverse ETF funds move in the opposite direction to the index they track and are useful during market pullbacks or during bear markets. Quick View: Move mouse or cursor over ETF symbol (ticker) to view short-term technical chart and over ETF name to view long term chart. Click on ticker or stock name for detailed view. Click on to add stock symbol to your watchlist and to view watchlist. |
12Stocks.com List of ETFs that track Smallcap Index
| Ticker | ETF Name | Watchlist | Recent Price | Smart Investing & Trading Score | Change % | Week % | Year-to-date % |
| IWM | iShares Russell 2000 | | 208.54 | 83 | 0.22 | 0.22 | 3.9% |
| IJR | iShares Core S&P Small-Cap | | 110.22 | 76 | -0.15 | -0.15 | 1.82% |
| IWN | iShares Russell 2000 Value | | 158.19 | 76 | -0.33 | -0.33 | 1.84% |
| VTWO | Vanguard Russell 2000 ETF | | 84.35 | 71 | 0.29 | 0.29 | 4.01% |
| IWO | iShares Russell 2000 Growth | | 267.35 | 76 | 0.83 | 0.83 | 6% |
| IJS | iShares S&P Small-Cap 600 Value | | 101.20 | 69 | -0.66 | -0.66 | -1.81% |
| IJT | iShares S&P Small-Cap 600 Growth | | 131.76 | 83 | 0.32 | 0.32 | 5.29% |
| XSLV | PowerShares S&P SmallCap Low Volatil ETF | | 44.31 | 69 | -0.37 | -0.37 | 0.36% |
| SMLV | SPDR SSGA US Small Cap Low Volatil ETF | | 113.00 | 69 | -0.25 | -0.25 | 0.43% |
| SAA | ProShares Ultra SmallCap600 | | 25.10 | 71 | 0.79 | 0.79 | 0.6% |
| SBB | ProShares Short SmallCap600 | | 15.72 | 18 | -0.34 | -0.34 | -1.32% |
| SDD | ProShares UltraShort SmallCap600 | | 17.73 | 28 | -0.61 | -0.61 | -3.78% |
| 12Stocks.com: Charts, Trends, Fundamental Data and Performances of SmallCap Stocks | |
|
We now take in-depth look at all SmallCap stocks including charts, multi-period performances and overall trends (as measured by Smart Investing & Trading Score). One can sort SmallCap stocks (click link to choose) by Daily, Weekly and by Year-to-Date performances. Also, one can sort by size of the company or by market capitalization. |
| Select Your Default Chart Type: | |||||
| |||||
| Click on stock symbol or name for detailed view. Click on to add stock symbol to your watchlist and to view watchlist. Quick View: Move mouse or cursor over "Daily" to quickly view daily technical stock chart and over "Weekly" to view weekly technical stock chart. | |||||

 | CVI CVR Energy, Inc. |
| Sector: Energy | |
| SubSector: Oil & Gas Refining & Marketing | |
| MarketCap: 2482.14 Millions | |
| Recent Price: 29.47 Smart Investing & Trading Score: 35 | |
| Day Percent Change: -0.44% Day Change: -0.13 | |
| Week Change: -0.44% Year-to-date Change: -2.7% | |
| CVI Links: Profile News Message Board | |
| Charts:- Daily , Weekly | |
| Add CVI to Watchlist: View: Get Complete CVI Trend Analysis ➞ | |
 | COLL Collegium Pharmaceutical, Inc. |
| Sector: Health Care | |
| SubSector: Drugs - Generic | |
| MarketCap: 569.185 Millions | |
| Recent Price: 34.15 Smart Investing & Trading Score: 35 | |
| Day Percent Change: 5.17% Day Change: 1.68 | |
| Week Change: 5.17% Year-to-date Change: 11.0% | |
| COLL Links: Profile News Message Board | |
| Charts:- Daily , Weekly | |
| Add COLL to Watchlist: View: Get Complete COLL Trend Analysis ➞ | |
 | RPD Rapid7, Inc. |
| Sector: Technology | |
| SubSector: Application Software | |
| MarketCap: 1981.12 Millions | |
| Recent Price: 39.56 Smart Investing & Trading Score: 35 | |
| Day Percent Change: 3.80% Day Change: 1.45 | |
| Week Change: 3.8% Year-to-date Change: -30.7% | |
| RPD Links: Profile News Message Board | |
| Charts:- Daily , Weekly | |
| Add RPD to Watchlist: View: Get Complete RPD Trend Analysis ➞ | |
 | AMPL Amplitude, Inc. |
| Sector: Technology | |
| SubSector: Software - Application | |
| MarketCap: 1320 Millions | |
| Recent Price: 9.51 Smart Investing & Trading Score: 35 | |
| Day Percent Change: 2.26% Day Change: 0.21 | |
| Week Change: 2.26% Year-to-date Change: -25.5% | |
| AMPL Links: Profile News Message Board | |
| Charts:- Daily , Weekly | |
| Add AMPL to Watchlist: View: Get Complete AMPL Trend Analysis ➞ | |
 | ACAD ACADIA Pharmaceuticals Inc. |
| Sector: Health Care | |
| SubSector: Biotechnology | |
| MarketCap: 5400.35 Millions | |
| Recent Price: 15.10 Smart Investing & Trading Score: 35 | |
| Day Percent Change: 2.10% Day Change: 0.31 | |
| Week Change: 2.1% Year-to-date Change: -51.8% | |
| ACAD Links: Profile News Message Board | |
| Charts:- Daily , Weekly | |
| Add ACAD to Watchlist: View: Get Complete ACAD Trend Analysis ➞ | |
 | CYTK Cytokinetics, Incorporated |
| Sector: Health Care | |
| SubSector: Biotechnology | |
| MarketCap: 654.285 Millions | |
| Recent Price: 60.60 Smart Investing & Trading Score: 35 | |
| Day Percent Change: 1.80% Day Change: 1.07 | |
| Week Change: 1.8% Year-to-date Change: -27.4% | |
| CYTK Links: Profile News Message Board | |
| Charts:- Daily , Weekly | |
| Add CYTK to Watchlist: View: Get Complete CYTK Trend Analysis ➞ | |
 | HCKT The Hackett Group, Inc. |
| Sector: Technology | |
| SubSector: Information Technology Services | |
| MarketCap: 334.468 Millions | |
| Recent Price: 21.59 Smart Investing & Trading Score: 35 | |
| Day Percent Change: 0.23% Day Change: 0.05 | |
| Week Change: 0.23% Year-to-date Change: -5.2% | |
| HCKT Links: Profile News Message Board | |
| Charts:- Daily , Weekly | |
| Add HCKT to Watchlist: View: Get Complete HCKT Trend Analysis ➞ | |
 | CVCO Cavco Industries, Inc. |
| Sector: Industrials | |
| SubSector: Residential Construction | |
| MarketCap: 1375.86 Millions | |
| Recent Price: 374.68 Smart Investing & Trading Score: 35 | |
| Day Percent Change: 0.13% Day Change: 0.47 | |
| Week Change: 0.13% Year-to-date Change: 8.1% | |
| CVCO Links: Profile News Message Board | |
| Charts:- Daily , Weekly | |
| Add CVCO to Watchlist: View: Get Complete CVCO Trend Analysis ➞ | |
 | ROIC Retail Opportunity Investments Corp. |
| Sector: Financials | |
| SubSector: REIT - Retail | |
| MarketCap: 943.414 Millions | |
| Recent Price: 12.46 Smart Investing & Trading Score: 35 | |
| Day Percent Change: -2.27% Day Change: -0.29 | |
| Week Change: -2.27% Year-to-date Change: -11.2% | |
| ROIC Links: Profile News Message Board | |
| Charts:- Daily , Weekly | |
| Add ROIC to Watchlist: View: Get Complete ROIC Trend Analysis ➞ | |
 | NYMT New York Mortgage Trust, Inc. |
| Sector: Financials | |
| SubSector: Mortgage Investment | |
| MarketCap: 1038.39 Millions | |
| Recent Price: 6.17 Smart Investing & Trading Score: 35 | |
| Day Percent Change: -1.59% Day Change: -0.10 | |
| Week Change: -1.59% Year-to-date Change: -27.7% | |
| NYMT Links: Profile News Message Board | |
| Charts:- Daily , Weekly | |
| Add NYMT to Watchlist: View: Get Complete NYMT Trend Analysis ➞ | |
 | FPI Farmland Partners Inc. |
| Sector: Financials | |
| SubSector: REIT - Diversified | |
| MarketCap: 182.653 Millions | |
| Recent Price: 11.19 Smart Investing & Trading Score: 35 | |
| Day Percent Change: -1.58% Day Change: -0.18 | |
| Week Change: -1.58% Year-to-date Change: -10.3% | |
| FPI Links: Profile News Message Board | |
| Charts:- Daily , Weekly | |
| Add FPI to Watchlist: View: Get Complete FPI Trend Analysis ➞ | |
 | TSBK Timberland Bancorp, Inc. |
| Sector: Financials | |
| SubSector: Savings & Loans | |
| MarketCap: 155.03 Millions | |
| Recent Price: 25.95 Smart Investing & Trading Score: 35 | |
| Day Percent Change: -0.67% Day Change: -0.18 | |
| Week Change: -0.67% Year-to-date Change: -17.5% | |
| TSBK Links: Profile News Message Board | |
| Charts:- Daily , Weekly | |
| Add TSBK to Watchlist: View: Get Complete TSBK Trend Analysis ➞ | |
 | SXI Standex International Corporation |
| Sector: Industrials | |
| SubSector: Industrial Equipment & Components | |
| MarketCap: 644.109 Millions | |
| Recent Price: 174.26 Smart Investing & Trading Score: 35 | |
| Day Percent Change: -0.37% Day Change: -0.65 | |
| Week Change: -0.37% Year-to-date Change: 10.0% | |
| SXI Links: Profile News Message Board | |
| Charts:- Daily , Weekly | |
| Add SXI to Watchlist: View: Get Complete SXI Trend Analysis ➞ | |
 | INN Summit Hotel Properties, Inc. |
| Sector: Financials | |
| SubSector: Real Estate Development | |
| MarketCap: 402.019 Millions | |
| Recent Price: 6.00 Smart Investing & Trading Score: 35 | |
| Day Percent Change: -0.17% Day Change: -0.01 | |
| Week Change: -0.17% Year-to-date Change: -10.7% | |
| INN Links: Profile News Message Board | |
| Charts:- Daily , Weekly | |
| Add INN to Watchlist: View: Get Complete INN Trend Analysis ➞ | |
 | GPRE Green Plains Inc. |
| Sector: Materials | |
| SubSector: Specialty Chemicals | |
| MarketCap: 196.357 Millions | |
| Recent Price: 19.14 Smart Investing & Trading Score: 35 | |
| Day Percent Change: -0.10% Day Change: -0.02 | |
| Week Change: -0.1% Year-to-date Change: -24.1% | |
| GPRE Links: Profile News Message Board | |
| Charts:- Daily , Weekly | |
| Add GPRE to Watchlist: View: Get Complete GPRE Trend Analysis ➞ | |
 | DYN Dyne Therapeutics, Inc. |
| Sector: Health Care | |
| SubSector: Biotechnology | |
| MarketCap: 88487 Millions | |
| Recent Price: 35.38 Smart Investing & Trading Score: 34 | |
| Day Percent Change: 27.82% Day Change: 7.70 | |
| Week Change: 27.82% Year-to-date Change: 166.0% | |
| DYN Links: Profile News Message Board | |
| Charts:- Daily , Weekly | |
| Add DYN to Watchlist: View: Get Complete DYN Trend Analysis ➞ | |
 | LNZA LanzaTech Global, Inc. |
| Sector: Industrials | |
| SubSector: Waste Management | |
| MarketCap: 1340 Millions | |
| Recent Price: 2.57 Smart Investing & Trading Score: 34 | |
| Day Percent Change: 2.39% Day Change: 0.06 | |
| Week Change: 2.39% Year-to-date Change: -48.0% | |
| LNZA Links: Profile News Message Board | |
| Charts:- Daily , Weekly | |
| Add LNZA to Watchlist: View: Get Complete LNZA Trend Analysis ➞ | |
 | TRVI Trevi Therapeutics, Inc. |
| Sector: Health Care | |
| SubSector: Biotechnology | |
| MarketCap: 50.6785 Millions | |
| Recent Price: 2.81 Smart Investing & Trading Score: 34 | |
| Day Percent Change: 1.44% Day Change: 0.04 | |
| Week Change: 1.44% Year-to-date Change: 109.7% | |
| TRVI Links: Profile News Message Board | |
| Charts:- Daily , Weekly | |
| Add TRVI to Watchlist: View: Get Complete TRVI Trend Analysis ➞ | |
 | BFLY Butterfly Network, Inc. |
| Sector: Health Care | |
| SubSector: Medical Devices | |
| MarketCap: 461 Millions | |
| Recent Price: 1.04 Smart Investing & Trading Score: 34 | |
| Day Percent Change: 0.97% Day Change: 0.01 | |
| Week Change: 0.97% Year-to-date Change: -8.0% | |
| BFLY Links: Profile News Message Board | |
| Charts:- Daily , Weekly | |
| Add BFLY to Watchlist: View: Get Complete BFLY Trend Analysis ➞ | |
 | VOR Vor Biopharma Inc. |
| Sector: Health Care | |
| SubSector: Biotechnology | |
| MarketCap: 224 Millions | |
| Recent Price: 1.75 Smart Investing & Trading Score: 34 | |
| Day Percent Change: -3.59% Day Change: -0.06 | |
| Week Change: -3.59% Year-to-date Change: -21.4% | |
| VOR Links: Profile News Message Board | |
| Charts:- Daily , Weekly | |
| Add VOR to Watchlist: View: Get Complete VOR Trend Analysis ➞ | |
 | RDN Radian Group Inc. |
| Sector: Financials | |
| SubSector: Property & Casualty Insurance | |
| MarketCap: 2950.12 Millions | |
| Recent Price: 30.67 Smart Investing & Trading Score: 34 | |
| Day Percent Change: -2.88% Day Change: -0.91 | |
| Week Change: -2.88% Year-to-date Change: 7.4% | |
| RDN Links: Profile News Message Board | |
| Charts:- Daily , Weekly | |
| Add RDN to Watchlist: View: Get Complete RDN Trend Analysis ➞ | |
 | AKR Acadia Realty Trust |
| Sector: Financials | |
| SubSector: Property Management | |
| MarketCap: 1367.42 Millions | |
| Recent Price: 16.96 Smart Investing & Trading Score: 34 | |
| Day Percent Change: -1.91% Day Change: -0.33 | |
| Week Change: -1.91% Year-to-date Change: -0.2% | |
| AKR Links: Profile News Message Board | |
| Charts:- Daily , Weekly | |
| Add AKR to Watchlist: View: Get Complete AKR Trend Analysis ➞ | |
 | GES Guess , Inc. |
| Sector: Services & Goods | |
| SubSector: Apparel Stores | |
| MarketCap: 591.908 Millions | |
| Recent Price: 26.43 Smart Investing & Trading Score: 33 | |
| Day Percent Change: 0.72% Day Change: 0.19 | |
| Week Change: 0.72% Year-to-date Change: 14.6% | |
| GES Links: Profile News Message Board | |
| Charts:- Daily , Weekly | |
| Add GES to Watchlist: View: Get Complete GES Trend Analysis ➞ | |
 | XPEL XPEL, Inc. |
| Sector: Consumer Staples | |
| SubSector: Auto Parts | |
| MarketCap: 290.239 Millions | |
| Recent Price: 34.31 Smart Investing & Trading Score: 33 | |
| Day Percent Change: 1.96% Day Change: 0.66 | |
| Week Change: 1.96% Year-to-date Change: -36.3% | |
| XPEL Links: Profile News Message Board | |
| Charts:- Daily , Weekly | |
| Add XPEL to Watchlist: View: Get Complete XPEL Trend Analysis ➞ | |
 | IMVT Immunovant, Inc. |
| Sector: Health Care | |
| SubSector: Biotechnology | |
| MarketCap: 552.885 Millions | |
| Recent Price: 30.87 Smart Investing & Trading Score: 33 | |
| Day Percent Change: 0.55% Day Change: 0.17 | |
| Week Change: 0.55% Year-to-date Change: -26.7% | |
| IMVT Links: Profile News Message Board | |
| Charts:- Daily , Weekly | |
| Add IMVT to Watchlist: View: Get Complete IMVT Trend Analysis ➞ | |
| Too many stocks? View smallcap stocks filtered by marketcap & sector |
| Marketcap: All SmallCap Stocks (default-no microcap), Large, Mid-Range, Small & MicroCap |
| Sector: Tech, Finance, Energy, Staples, Retail, Industrial, Materials, Utilities & Medical |
|
Best Stocks Today 12Stocks.com |
© 2024 12Stocks.com Terms & Conditions Privacy Contact Us
All Information Provided Only For Education And Not To Be Used For Investing or Trading. See Terms & Conditions


One More Thing ... Get Best Stocks Delivered Daily!
Never Ever Miss A Move With Our Top Ten Stocks Lists
Find Best Stocks In Any Market - Bull or Bear Market
Take A Peek At Our Top Ten Stocks Lists: Daily, Weekly, Year-to-Date & Top Trends
Find Best Stocks In Any Market - Bull or Bear Market
Take A Peek At Our Top Ten Stocks Lists: Daily, Weekly, Year-to-Date & Top Trends
Smallcap Stocks With Best Up Trends [0-bearish to 100-bullish]: Overseas Shipholding[100], PTC [100], Stoke [100], NuScale Power[100], NextDecade [100], Centrus Energy[100], Humacyte [100], Fossil Group[100], MicroStrategy [100], Riot Blockchain[100], Reneo [100]
Best Smallcap Stocks Year-to-Date:
CareMax [497.94%], Janux [347.18%], Viking [262.79%], Alpine Immune[241.23%], Longboard [240.67%], Avidity Biosciences[223.12%], Super Micro[218%], Novavax [208.13%], Stoke [206.08%], Sweetgreen [199.38%], Arcutis Bio[189.47%] Best Smallcap Stocks This Week:
Scilex Holding[34.44%], Dyne [27.82%], Comtech Tele[23.04%], Overseas Shipholding[22.74%], PTC [21.23%], Genelux [17.53%], Sutro Biopharma[16.71%], Tellurian [16.41%], Atara Bio[16.39%], Urban One[16.13%], Stoke [15.83%] Best Smallcap Stocks Daily:
Scilex Holding[34.44%], Dyne [27.82%], Comtech Tele[23.04%], Overseas Shipholding[22.74%], PTC [21.23%], Genelux [17.53%], Sutro Biopharma[16.71%], Tellurian [16.41%], Atara Bio[16.39%], Urban One[16.13%], Stoke [15.83%]