
 Login Sign Up


| |||||
 |  | ||||

| 12Stocks.com Market Intelligence |
Best SmallCap Stocks
|
| In a hurry? Small Cap Stock Lists: Performance Trends Table, Stock Charts
Sort Small Cap stocks: Daily, Weekly, Year-to-Date, Market Cap & Trends. Filter Small Cap stocks list by sector: Show all, Tech, Finance, Energy, Staples, Retail, Industrial, Materials, Utilities and HealthCare Filter Small Cap stocks list by size: All Large Medium Small and MicroCap |
| 12Stocks.com Small Cap Stocks Performances & Trends Daily | |||||||||
|
|  The overall Smart Investing & Trading Score is 14 (0-bearish to 100-bullish) which puts Small Cap index in short term bearish trend. The Smart Investing & Trading Score from previous trading session is 41 and hence a deterioration of trend.
| ||||||||
Here are the Smart Investing & Trading Scores of the most requested small cap stocks at 12Stocks.com (click stock name for detailed review):
|


| 12Stocks.com: Investing in Smallcap Index with Stocks | |
|
The following table helps investors and traders sort through current performance and trends (as measured by Smart Investing & Trading Score) of various
stocks in the Smallcap Index. Quick View: Move mouse or cursor over stock symbol (ticker) to view short-term technical chart and over stock name to view long term chart. Click on  to add stock symbol to your watchlist and to add stock symbol to your watchlist and  to view watchlist. Click on any ticker or stock name for detailed market intelligence report for that stock. to view watchlist. Click on any ticker or stock name for detailed market intelligence report for that stock. |
12Stocks.com Performance of Stocks in Smallcap Index
| Ticker | Stock Name | Watchlist | Category | Recent Price | Smart Investing & Trading Score | Change % | YTD Change% |
| ICHR | Ichor |   | Technology | 37.65 | 7 | -2.91% | 11.95% |
| ELF | e.l.f. Beauty | | Consumer Staples | 158.52 | 7 | -2.47% | 9.82% |
| STRL | Sterling Construction | | Industrials | 99.16 | 7 | -2.40% | 12.77% |
| AGS | PlayAGS | | Services & Goods | 8.64 | 7 | -2.26% | 2.49% |
| VECO | Veeco Instruments | | Technology | 34.59 | 7 | -2.12% | 11.47% |
| SMCI | Super Micro | | Technology | 738.30 | 7 | -14.03% | 159.73% |
| BJRI | BJ s | | Services & Goods | 32.09 | 7 | -1.53% | -10.89% |
| REZI | Resideo | | Services & Goods | 19.29 | 7 | -1.23% | 2.50% |
| PSN | Parsons | | Industrials | 77.63 | 7 | -1.12% | 23.79% |
| LOCO | El Pollo | | Services & Goods | 8.44 | 7 | -0.94% | -4.31% |
| VRNS | Varonis Systems | | Technology | 43.44 | 7 | -0.71% | -4.06% |
| SRI | Stoneridge | | Consumer Staples | 14.96 | 7 | -0.13% | -23.56% |
| TILE | Interface | | Industrials | 15.28 | 7 | -0.07% | 21.08% |
| CHGG | Chegg | | Services & Goods | 5.38 | 5 | 4.06% | -52.64% |
| WRBY | Warby Parker | | Health Care | 11.98 | 5 | 2.04% | -15.07% |
| BRCC | BRC | | Consumer Staples | 3.73 | 5 | -4.36% | 2.47% |
| OMI | Owens & Minor | | Services & Goods | 24.01 | 5 | -2.95% | 24.60% |
| HMST | HomeStreet | | Financials | 10.97 | 5 | -10.45% | 6.50% |
| COOK | Traeger | | Services & Goods | 2.11 | 5 | -1.86% | -25.31% |
| NVRO | Nevro | | Health Care | 10.41 | 5 | -1.61% | -51.63% |
| DNOW | NOW | | Energy | 13.89 | 5 | -1.56% | 22.70% |
| ARI | Apollo Commercial | | Financials | 10.00 | 0 | 3.84% | -14.82% |
| AIN | Albany | | Industrials | 81.71 | 0 | 2.46% | -16.81% |
| FELE | Franklin Electric | | Industrials | 97.60 | 0 | 1.38% | 0.98% |
| ACEL | Accel Entertainment | | Services & Goods | 10.87 | 0 | 1.21% | 5.84% |


| Too many stocks? View smallcap stocks filtered by marketcap & sector |
| Marketcap: All SmallCap Stocks (default-no microcap), Large, Mid-Range, Small |
| Smallcap Sector: Tech, Finance, Energy, Staples, Retail, Industrial, Materials, & Medical |
|
Get the most comprehensive stock market coverage daily at 12Stocks.com ➞ Best Stocks Today ➞ Best Stocks Weekly ➞ Best Stocks Year-to-Date ➞ Best Stocks Trends ➞  Best Stocks Today 12Stocks.com Best Nasdaq Stocks ➞ Best S&P 500 Stocks ➞ Best Tech Stocks ➞ Best Biotech Stocks ➞ |
| Detailed Overview of SmallCap Stocks |
| SmallCap Technical Overview, Leaders & Laggards, Top SmallCap ETF Funds & Detailed SmallCap Stocks List, Charts, Trends & More |
| Smallcap: Technical Analysis, Trends & YTD Performance | |
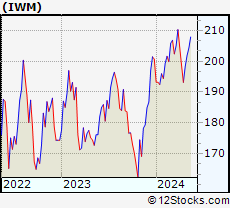
| SmallCap segment as represented by
IWM, an exchange-traded fund [ETF], holds basket of thousands of smallcap stocks from across all major sectors of the US stock market. The smallcap index (contains stocks like Riverbed & Sotheby's) is down by -2.19% and is currently underperforming the overall market by -6.73% year-to-date. Below is a quick view of technical charts and trends: | |
 IWM Weekly Chart |
|
| Long Term Trend: Not Good | |
| Medium Term Trend: Not Good | |
 IWM Daily Chart |
|
| Short Term Trend: Not Good | |
| Overall Trend Score: 14 | |
| YTD Performance: -2.19% | |
| **Trend Scores & Views Are Only For Educational Purposes And Not For Investing | |
| 12Stocks.com: Top Performing Small Cap Index Stocks | ||||||||||||||||||||||||||||||||||||||||||||||||
 The top performing Small Cap Index stocks year to date are
Now, more recently, over last week, the top performing Small Cap Index stocks on the move are


|
||||||||||||||||||||||||||||||||||||||||||||||||
| 12Stocks.com: Investing in Smallcap Index using Exchange Traded Funds | |
|
The following table shows list of key exchange traded funds (ETF) that
help investors track Smallcap index. The following list also includes leveraged ETF funds that track twice or thrice the daily returns of Smallcap indices. Short or inverse ETF funds move in the opposite direction to the index they track and are useful during market pullbacks or during bear markets. Quick View: Move mouse or cursor over ETF symbol (ticker) to view short-term technical chart and over ETF name to view long term chart. Click on ticker or stock name for detailed view. Click on to add stock symbol to your watchlist and to view watchlist. |
12Stocks.com List of ETFs that track Smallcap Index
| Ticker | ETF Name | Watchlist | Recent Price | Smart Investing & Trading Score | Change % | Week % | Year-to-date % |
| IWM | iShares Russell 2000 | | 196.31 | 14 | 0.21 | -1.05 | -2.19% |
| IJR | iShares Core S&P Small-Cap | | 104.74 | 22 | 0.34 | -0.86 | -3.24% |
| VTWO | Vanguard Russell 2000 ETF | | 79.36 | 14 | 0.25 | -1.07 | -2.15% |
| IWN | iShares Russell 2000 Value | | 149.82 | 22 | 0.52 | -0.87 | -3.55% |
| IJS | iShares S&P Small-Cap 600 Value | | 96.40 | 15 | 0.33 | -0.81 | -6.47% |
| IWO | iShares Russell 2000 Growth | | 249.58 | 7 | -0.30 | -1.39 | -1.05% |
| IJT | iShares S&P Small-Cap 600 Growth | | 124.94 | 15 | 0.27 | -0.91 | -0.16% |
| XSLV | PowerShares S&P SmallCap Low Volatil ETF | | 42.83 | 62 | 0.68 | 0.26 | -2.99% |
| SDD | ProShares UltraShort SmallCap600 | | 19.71 | 86 | 0.70 | 1.85 | 6.95% |
| SMLV | SPDR SSGA US Small Cap Low Volatil ETF | | 107.44 | 45 | 1.11 | -0.07 | -4.51% |
| SBB | ProShares Short SmallCap600 | | 16.56 | 79 | 0.05 | 1.06 | 3.94% |
| SAA | ProShares Ultra SmallCap600 | | 22.58 | 8 | -0.08 | -1.99 | -9.49% |
| 12Stocks.com: Charts, Trends, Fundamental Data and Performances of SmallCap Stocks | |
|
We now take in-depth look at all SmallCap stocks including charts, multi-period performances and overall trends (as measured by Smart Investing & Trading Score). One can sort SmallCap stocks (click link to choose) by Daily, Weekly and by Year-to-Date performances. Also, one can sort by size of the company or by market capitalization. |
| Select Your Default Chart Type: | |||||
| |||||
| Click on stock symbol or name for detailed view. Click on to add stock symbol to your watchlist and to view watchlist. Quick View: Move mouse or cursor over "Daily" to quickly view daily technical stock chart and over "Weekly" to view weekly technical stock chart. | |||||

 | ICHR Ichor Holdings, Ltd. |
| Sector: Technology | |
| SubSector: Semiconductor Equipment & Materials | |
| MarketCap: 409.018 Millions | |
| Recent Price: 37.65 Smart Investing & Trading Score: 7 | |
| Day Percent Change: -2.91% Day Change: -1.13 | |
| Week Change: -4.32% Year-to-date Change: 12.0% | |
| ICHR Links: Profile News Message Board | |
| Charts:- Daily , Weekly | |
| Add ICHR to Watchlist: View: Get Complete ICHR Trend Analysis ➞ | |
 | ELF e.l.f. Beauty, Inc. |
| Sector: Consumer Staples | |
| SubSector: Personal Products | |
| MarketCap: 497.985 Millions | |
| Recent Price: 158.52 Smart Investing & Trading Score: 7 | |
| Day Percent Change: -2.47% Day Change: -4.01 | |
| Week Change: -11.75% Year-to-date Change: 9.8% | |
| ELF Links: Profile News Message Board | |
| Charts:- Daily , Weekly | |
| Add ELF to Watchlist: View: Get Complete ELF Trend Analysis ➞ | |
 | STRL Sterling Construction Company, Inc. |
| Sector: Industrials | |
| SubSector: Heavy Construction | |
| MarketCap: 237.395 Millions | |
| Recent Price: 99.16 Smart Investing & Trading Score: 7 | |
| Day Percent Change: -2.40% Day Change: -2.44 | |
| Week Change: -6.36% Year-to-date Change: 12.8% | |
| STRL Links: Profile News Message Board | |
| Charts:- Daily , Weekly | |
| Add STRL to Watchlist: View: Get Complete STRL Trend Analysis ➞ | |
 | AGS PlayAGS, Inc. |
| Sector: Services & Goods | |
| SubSector: Gaming Activities | |
| MarketCap: 77.1289 Millions | |
| Recent Price: 8.64 Smart Investing & Trading Score: 7 | |
| Day Percent Change: -2.26% Day Change: -0.20 | |
| Week Change: -3.03% Year-to-date Change: 2.5% | |
| AGS Links: Profile News Message Board | |
| Charts:- Daily , Weekly | |
| Add AGS to Watchlist: View: Get Complete AGS Trend Analysis ➞ | |
 | VECO Veeco Instruments Inc. |
| Sector: Technology | |
| SubSector: Semiconductor Equipment & Materials | |
| MarketCap: 450.718 Millions | |
| Recent Price: 34.59 Smart Investing & Trading Score: 7 | |
| Day Percent Change: -2.12% Day Change: -0.75 | |
| Week Change: -1.62% Year-to-date Change: 11.5% | |
| VECO Links: Profile News Message Board | |
| Charts:- Daily , Weekly | |
| Add VECO to Watchlist: View: Get Complete VECO Trend Analysis ➞ | |
 | SMCI Super Micro Computer, Inc. |
| Sector: Technology | |
| SubSector: Networking & Communication Devices | |
| MarketCap: 1200.02 Millions | |
| Recent Price: 738.30 Smart Investing & Trading Score: 7 | |
| Day Percent Change: -14.03% Day Change: -120.50 | |
| Week Change: -13.89% Year-to-date Change: 159.7% | |
| SMCI Links: Profile News Message Board | |
| Charts:- Daily , Weekly | |
| Add SMCI to Watchlist: View: Get Complete SMCI Trend Analysis ➞ | |
 | BJRI BJ s Restaurants, Inc. |
| Sector: Services & Goods | |
| SubSector: Restaurants | |
| MarketCap: 183.67 Millions | |
| Recent Price: 32.09 Smart Investing & Trading Score: 7 | |
| Day Percent Change: -1.53% Day Change: -0.50 | |
| Week Change: -4.04% Year-to-date Change: -10.9% | |
| BJRI Links: Profile News Message Board | |
| Charts:- Daily , Weekly | |
| Add BJRI to Watchlist: View: Get Complete BJRI Trend Analysis ➞ | |
 | REZI Resideo Technologies, Inc. |
| Sector: Services & Goods | |
| SubSector: Security & Protection Services | |
| MarketCap: 712.603 Millions | |
| Recent Price: 19.29 Smart Investing & Trading Score: 7 | |
| Day Percent Change: -1.23% Day Change: -0.24 | |
| Week Change: -2.97% Year-to-date Change: 2.5% | |
| REZI Links: Profile News Message Board | |
| Charts:- Daily , Weekly | |
| Add REZI to Watchlist: View: Get Complete REZI Trend Analysis ➞ | |
 | PSN Parsons Corporation |
| Sector: Industrials | |
| SubSector: Diversified Machinery | |
| MarketCap: 3021.16 Millions | |
| Recent Price: 77.63 Smart Investing & Trading Score: 7 | |
| Day Percent Change: -1.12% Day Change: -0.88 | |
| Week Change: -2.63% Year-to-date Change: 23.8% | |
| PSN Links: Profile News Message Board | |
| Charts:- Daily , Weekly | |
| Add PSN to Watchlist: View: Get Complete PSN Trend Analysis ➞ | |
 | LOCO El Pollo Loco Holdings, Inc. |
| Sector: Services & Goods | |
| SubSector: Restaurants | |
| MarketCap: 296.97 Millions | |
| Recent Price: 8.44 Smart Investing & Trading Score: 7 | |
| Day Percent Change: -0.94% Day Change: -0.08 | |
| Week Change: -5.27% Year-to-date Change: -4.3% | |
| LOCO Links: Profile News Message Board | |
| Charts:- Daily , Weekly | |
| Add LOCO to Watchlist: View: Get Complete LOCO Trend Analysis ➞ | |
 | VRNS Varonis Systems, Inc. |
| Sector: Technology | |
| SubSector: Technical & System Software | |
| MarketCap: 1715 Millions | |
| Recent Price: 43.44 Smart Investing & Trading Score: 7 | |
| Day Percent Change: -0.71% Day Change: -0.31 | |
| Week Change: -4.17% Year-to-date Change: -4.1% | |
| VRNS Links: Profile News Message Board | |
| Charts:- Daily , Weekly | |
| Add VRNS to Watchlist: View: Get Complete VRNS Trend Analysis ➞ | |
 | SRI Stoneridge, Inc. |
| Sector: Consumer Staples | |
| SubSector: Auto Parts | |
| MarketCap: 451.839 Millions | |
| Recent Price: 14.96 Smart Investing & Trading Score: 7 | |
| Day Percent Change: -0.13% Day Change: -0.02 | |
| Week Change: -5.2% Year-to-date Change: -23.6% | |
| SRI Links: Profile News Message Board | |
| Charts:- Daily , Weekly | |
| Add SRI to Watchlist: View: Get Complete SRI Trend Analysis ➞ | |
 | TILE Interface, Inc. |
| Sector: Industrials | |
| SubSector: Textile Industrial | |
| MarketCap: 478 Millions | |
| Recent Price: 15.28 Smart Investing & Trading Score: 7 | |
| Day Percent Change: -0.07% Day Change: -0.01 | |
| Week Change: -2.11% Year-to-date Change: 21.1% | |
| TILE Links: Profile News Message Board | |
| Charts:- Daily , Weekly | |
| Add TILE to Watchlist: View: Get Complete TILE Trend Analysis ➞ | |
 | CHGG Chegg, Inc. |
| Sector: Services & Goods | |
| SubSector: Education & Training Services | |
| MarketCap: 3606.86 Millions | |
| Recent Price: 5.38 Smart Investing & Trading Score: 5 | |
| Day Percent Change: 4.06% Day Change: 0.21 | |
| Week Change: -24.23% Year-to-date Change: -52.6% | |
| CHGG Links: Profile News Message Board | |
| Charts:- Daily , Weekly | |
| Add CHGG to Watchlist: View: Get Complete CHGG Trend Analysis ➞ | |
 | WRBY Warby Parker Inc. |
| Sector: Health Care | |
| SubSector: Medical Instruments & Supplies | |
| MarketCap: 1380 Millions | |
| Recent Price: 11.98 Smart Investing & Trading Score: 5 | |
| Day Percent Change: 2.04% Day Change: 0.24 | |
| Week Change: -7.28% Year-to-date Change: -15.1% | |
| WRBY Links: Profile News Message Board | |
| Charts:- Daily , Weekly | |
| Add WRBY to Watchlist: View: Get Complete WRBY Trend Analysis ➞ | |
 | BRCC BRC Inc. |
| Sector: Consumer Staples | |
| SubSector: Packaged Foods | |
| MarketCap: 1110 Millions | |
| Recent Price: 3.73 Smart Investing & Trading Score: 5 | |
| Day Percent Change: -4.36% Day Change: -0.17 | |
| Week Change: -9.25% Year-to-date Change: 2.5% | |
| BRCC Links: Profile News Message Board | |
| Charts:- Daily , Weekly | |
| Add BRCC to Watchlist: View: Get Complete BRCC Trend Analysis ➞ | |
 | OMI Owens & Minor, Inc. |
| Sector: Services & Goods | |
| SubSector: Medical Equipment Wholesale | |
| MarketCap: 403.92 Millions | |
| Recent Price: 24.01 Smart Investing & Trading Score: 5 | |
| Day Percent Change: -2.95% Day Change: -0.73 | |
| Week Change: -4.3% Year-to-date Change: 24.6% | |
| OMI Links: Profile News Message Board | |
| Charts:- Daily , Weekly | |
| Add OMI to Watchlist: View: Get Complete OMI Trend Analysis ➞ | |
 | HMST HomeStreet, Inc. |
| Sector: Financials | |
| SubSector: Savings & Loans | |
| MarketCap: 535.33 Millions | |
| Recent Price: 10.97 Smart Investing & Trading Score: 5 | |
| Day Percent Change: -10.45% Day Change: -1.28 | |
| Week Change: -8.96% Year-to-date Change: 6.5% | |
| HMST Links: Profile News Message Board | |
| Charts:- Daily , Weekly | |
| Add HMST to Watchlist: View: Get Complete HMST Trend Analysis ➞ | |
 | COOK Traeger, Inc. |
| Sector: Services & Goods | |
| SubSector: Furnishings, Fixtures & Appliances | |
| MarketCap: 524 Millions | |
| Recent Price: 2.11 Smart Investing & Trading Score: 5 | |
| Day Percent Change: -1.86% Day Change: -0.04 | |
| Week Change: -0.47% Year-to-date Change: -25.3% | |
| COOK Links: Profile News Message Board | |
| Charts:- Daily , Weekly | |
| Add COOK to Watchlist: View: Get Complete COOK Trend Analysis ➞ | |
 | NVRO Nevro Corp. |
| Sector: Health Care | |
| SubSector: Medical Appliances & Equipment | |
| MarketCap: 2489.3 Millions | |
| Recent Price: 10.41 Smart Investing & Trading Score: 5 | |
| Day Percent Change: -1.61% Day Change: -0.17 | |
| Week Change: -8.04% Year-to-date Change: -51.6% | |
| NVRO Links: Profile News Message Board | |
| Charts:- Daily , Weekly | |
| Add NVRO to Watchlist: View: Get Complete NVRO Trend Analysis ➞ | |
 | DNOW NOW Inc. |
| Sector: Energy | |
| SubSector: Oil & Gas Equipment & Services | |
| MarketCap: 679.661 Millions | |
| Recent Price: 13.89 Smart Investing & Trading Score: 5 | |
| Day Percent Change: -1.56% Day Change: -0.22 | |
| Week Change: -5.06% Year-to-date Change: 22.7% | |
| DNOW Links: Profile News Message Board | |
| Charts:- Daily , Weekly | |
| Add DNOW to Watchlist: View: Get Complete DNOW Trend Analysis ➞ | |
 | ARI Apollo Commercial Real Estate Finance, Inc. |
| Sector: Financials | |
| SubSector: Mortgage Investment | |
| MarketCap: 1302.19 Millions | |
| Recent Price: 10.00 Smart Investing & Trading Score: 0 | |
| Day Percent Change: 3.84% Day Change: 0.37 | |
| Week Change: -7.41% Year-to-date Change: -14.8% | |
| ARI Links: Profile News Message Board | |
| Charts:- Daily , Weekly | |
| Add ARI to Watchlist: View: Get Complete ARI Trend Analysis ➞ | |
 | AIN Albany International Corp. |
| Sector: Industrials | |
| SubSector: Textile Industrial | |
| MarketCap: 1538.4 Millions | |
| Recent Price: 81.71 Smart Investing & Trading Score: 0 | |
| Day Percent Change: 2.46% Day Change: 1.96 | |
| Week Change: -6.81% Year-to-date Change: -16.8% | |
| AIN Links: Profile News Message Board | |
| Charts:- Daily , Weekly | |
| Add AIN to Watchlist: View: Get Complete AIN Trend Analysis ➞ | |
 | FELE Franklin Electric Co., Inc. |
| Sector: Industrials | |
| SubSector: Industrial Electrical Equipment | |
| MarketCap: 2397.89 Millions | |
| Recent Price: 97.60 Smart Investing & Trading Score: 0 | |
| Day Percent Change: 1.38% Day Change: 1.33 | |
| Week Change: -5.03% Year-to-date Change: 1.0% | |
| FELE Links: Profile News Message Board | |
| Charts:- Daily , Weekly | |
| Add FELE to Watchlist: View: Get Complete FELE Trend Analysis ➞ | |
 | ACEL Accel Entertainment, Inc. |
| Sector: Services & Goods | |
| SubSector: Gaming Activities | |
| MarketCap: 486.589 Millions | |
| Recent Price: 10.87 Smart Investing & Trading Score: 0 | |
| Day Percent Change: 1.21% Day Change: 0.13 | |
| Week Change: -2.86% Year-to-date Change: 5.8% | |
| ACEL Links: Profile News Message Board | |
| Charts:- Daily , Weekly | |
| Add ACEL to Watchlist: View: Get Complete ACEL Trend Analysis ➞ | |
| Too many stocks? View smallcap stocks filtered by marketcap & sector |
| Marketcap: All SmallCap Stocks (default-no microcap), Large, Mid-Range, Small & MicroCap |
| Sector: Tech, Finance, Energy, Staples, Retail, Industrial, Materials, Utilities & Medical |
|
Best Stocks Today 12Stocks.com |
© 2024 12Stocks.com Terms & Conditions Privacy Contact Us
All Information Provided Only For Education And Not To Be Used For Investing or Trading. See Terms & Conditions


One More Thing ... Get Best Stocks Delivered Daily!
Never Ever Miss A Move With Our Top Ten Stocks Lists
Find Best Stocks In Any Market - Bull or Bear Market
Take A Peek At Our Top Ten Stocks Lists: Daily, Weekly, Year-to-Date & Top Trends
Find Best Stocks In Any Market - Bull or Bear Market
Take A Peek At Our Top Ten Stocks Lists: Daily, Weekly, Year-to-Date & Top Trends
Smallcap Stocks With Best Up Trends [0-bearish to 100-bullish]: Surmodics [100], Rocky Brands[100], TransMedics Group[100], LendingClub [100], Summit [100], A10 s[100], Carpenter [100], UFP [100], PROCEPT BioRobotics[100], Xencor [100], Trinity Industries[100]
Best Smallcap Stocks Year-to-Date:
Janux [441.55%], Viking [310.69%], Longboard [259.25%], Alpine Immune[239.29%], Avidity Biosciences[185.4%], Bakkt [182.96%], Cullinan Oncology[175.33%], Arcutis Bio[173.68%], Vera [173.32%], Super Micro[159.73%], Y-mAbs [141.79%] Best Smallcap Stocks This Week:
Deciphera [73.11%], Eyenovia [45.65%], Cue Biopharma[39.56%], Seres [30.91%], Poseida [30.05%], P3 Health[29.62%], Phibro Animal[28.44%], TransMedics Group[27.72%], Surmodics [27.36%], LendingTree [26.36%], Rocky Brands[24.92%] Best Smallcap Stocks Daily:
Surmodics [29.74%], Rocky Brands[28.41%], TransMedics Group[24.93%], Ventyx Biosciences[24.63%], Eyenovia [21.84%], LendingClub [19.68%], Summit [19.59%], Powell Industries[18.89%], MiMedx Group[18.67%], CareDx [18.30%], A10 s[17.69%]