
 Login Sign Up


| |||||
 |  | ||||

| 12Stocks.com Market Intelligence |
Best SmallCap Stocks
|
| In a hurry? Small Cap Stock Lists: Performance Trends Table, Stock Charts
Sort Small Cap stocks: Daily, Weekly, Year-to-Date, Market Cap & Trends. Filter Small Cap stocks list by sector: Show all, Tech, Finance, Energy, Staples, Retail, Industrial, Materials, Utilities and HealthCare Filter Small Cap stocks list by size: All Large Medium Small and MicroCap |
| 12Stocks.com Small Cap Stocks Performances & Trends Daily | |||||||||
|
|  The overall Smart Investing & Trading Score is 76 (0-bearish to 100-bullish) which puts Small Cap index in short term neutral to bullish trend. The Smart Investing & Trading Score from previous trading session is 90 and hence a deterioration of trend.
| ||||||||
Here are the Smart Investing & Trading Scores of the most requested small cap stocks at 12Stocks.com (click stock name for detailed review):
|


| 12Stocks.com: Investing in Smallcap Index with Stocks | |
|
The following table helps investors and traders sort through current performance and trends (as measured by Smart Investing & Trading Score) of various
stocks in the Smallcap Index. Quick View: Move mouse or cursor over stock symbol (ticker) to view short-term technical chart and over stock name to view long term chart. Click on  to add stock symbol to your watchlist and to add stock symbol to your watchlist and  to view watchlist. Click on any ticker or stock name for detailed market intelligence report for that stock. to view watchlist. Click on any ticker or stock name for detailed market intelligence report for that stock. |
12Stocks.com Performance of Stocks in Smallcap Index
| Ticker | Stock Name | Watchlist | Category | Recent Price | Smart Investing & Trading Score | Change % | YTD Change% |
| AROW | Arrow Financial |   | Financials | 25.09 | 100 | 0.86% | -10.22% |
| UBSI | United Bankshares | | Financials | 34.96 | 100 | 0.84% | -6.90% |
| IIPR | Innovative Industrial | | Financials | 114.61 | 100 | 0.80% | 13.68% |
| PFBC | Preferred Bank | | Financials | 80.51 | 100 | 0.79% | 10.21% |
| SMBC | Southern Missouri | | Financials | 43.59 | 100 | 0.79% | -18.36% |
| EFSC | Enterprise Financial | | Financials | 40.92 | 100 | 0.76% | -8.35% |
| OSBC | Old Second | | Financials | 14.90 | 100 | 0.68% | -3.50% |
| HSHP | Himalaya Shipping | | Industrials | 9.08 | 100 | 0.67% | 34.52% |
| OB | Outbrain | | Services & Goods | 4.72 | 100 | 0.64% | 7.76% |
| WAFD | Washington Federal | | Financials | 29.97 | 100 | 0.60% | -9.07% |
| SITC | SITE Centers | | Financials | 14.36 | 100 | 0.60% | 5.32% |
| CWK | Cushman & Wakefield | | Financials | 11.71 | 100 | 0.52% | 8.43% |
| ALTR | Altair Engineering | | Technology | 91.45 | 100 | 0.41% | 8.67% |
| ESE | ESCO | | Technology | 108.57 | 100 | 0.38% | -7.23% |
| KRO | Kronos Worldwide | | Materials | 13.25 | 100 | 0.23% | 33.30% |
| BCBP | BCB Bancorp | | Financials | 10.89 | 100 | 0.23% | -15.29% |
| TRS | TriMas | | Industrials | 27.86 | 100 | 0.22% | 9.99% |
| VSH | Vishay Inter | | Technology | 23.85 | 100 | 0.17% | -0.50% |
| KREF | KKR Real | | Financials | 9.85 | 100 | 0.14% | -25.52% |
| ABM | ABM Industries | | Services & Goods | 46.72 | 100 | 0.13% | 4.22% |
| NWE | NorthWestern | | Utilities | 52.61 | 100 | 0.13% | 3.38% |
| NSP | Insperity | | Services & Goods | 105.27 | 100 | 0.04% | -10.19% |
| BFS | Saul Centers | | Financials | 37.91 | 100 | 0.00% | -3.46% |
| CDZI | Cadiz | | Utilities | 3.00 | 100 | 0.00% | 7.14% |
| ESSA | ESSA Bancorp | | Financials | 17.78 | 100 | 0.00% | -11.19% |
| For chart view version of above stock list: Chart View ➞ 0 - 25 , 25 - 50 , 50 - 75 , 75 - 100 , 100 - 125 , 125 - 150 , 150 - 175 , 175 - 200 , 200 - 225 , 225 - 250 , 250 - 275 , 275 - 300 , 300 - 325 , 325 - 350 , 350 - 375 , 375 - 400 , 400 - 425 , 425 - 450 , 450 - 475 , 475 - 500 , 500 - 525 , 525 - 550 , 550 - 575 , 575 - 600 , 600 - 625 , 625 - 650 , 650 - 675 , 675 - 700 , 700 - 725 , 725 - 750 , 750 - 775 , 775 - 800 , 800 - 825 , 825 - 850 , 850 - 875 , 875 - 900 , 900 - 925 , 925 - 950 , 950 - 975 , 975 - 1000 , 1000 - 1025 , 1025 - 1050 , 1050 - 1075 , 1075 - 1100 , 1100 - 1125 , 1125 - 1150 , 1150 - 1175 , 1175 - 1200 , 1200 - 1225 , 1225 - 1250 , 1250 - 1275 , 1275 - 1300 , 1300 - 1325 , 1325 - 1350 , 1350 - 1375 , 1375 - 1400 , 1400 - 1425 , 1425 - 1450 , 1450 - 1475 , 1475 - 1500 , 1500 - 1525 , 1525 - 1550 | ||
 | Click To Change The Sort Order: By Market Cap or Company Size Performance: Year-to-date, Week and Day |  |
| Too many stocks? View smallcap stocks filtered by marketcap & sector |
| Marketcap: All SmallCap Stocks (default-no microcap), Large, Mid-Range, Small |
| Smallcap Sector: Tech, Finance, Energy, Staples, Retail, Industrial, Materials, & Medical |
|
Get the most comprehensive stock market coverage daily at 12Stocks.com ➞ Best Stocks Today ➞ Best Stocks Weekly ➞ Best Stocks Year-to-Date ➞ Best Stocks Trends ➞  Best Stocks Today 12Stocks.com Best Nasdaq Stocks ➞ Best S&P 500 Stocks ➞ Best Tech Stocks ➞ Best Biotech Stocks ➞ |
| Detailed Overview of SmallCap Stocks |
| SmallCap Technical Overview, Leaders & Laggards, Top SmallCap ETF Funds & Detailed SmallCap Stocks List, Charts, Trends & More |
| Smallcap: Technical Analysis, Trends & YTD Performance | |
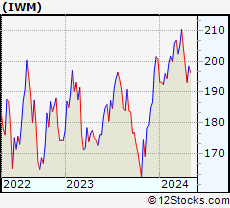
| SmallCap segment as represented by
IWM, an exchange-traded fund [ETF], holds basket of thousands of smallcap stocks from across all major sectors of the US stock market. The smallcap index (contains stocks like Riverbed & Sotheby's) is up by 3.74% and is currently underperforming the overall market by -6.66% year-to-date. Below is a quick view of technical charts and trends: | |
 IWM Weekly Chart |
|
| Long Term Trend: Very Good | |
| Medium Term Trend: Very Good | |
 IWM Daily Chart |
|
| Short Term Trend: Good | |
| Overall Trend Score: 76 | |
| YTD Performance: 3.74% | |
| **Trend Scores & Views Are Only For Educational Purposes And Not For Investing | |
| 12Stocks.com: Top Performing Small Cap Index Stocks | ||||||||||||||||||||||||||||||||||||||||||||||||
 The top performing Small Cap Index stocks year to date are
Now, more recently, over last week, the top performing Small Cap Index stocks on the move are


|
||||||||||||||||||||||||||||||||||||||||||||||||
| 12Stocks.com: Investing in Smallcap Index using Exchange Traded Funds | |
|
The following table shows list of key exchange traded funds (ETF) that
help investors track Smallcap index. The following list also includes leveraged ETF funds that track twice or thrice the daily returns of Smallcap indices. Short or inverse ETF funds move in the opposite direction to the index they track and are useful during market pullbacks or during bear markets. Quick View: Move mouse or cursor over ETF symbol (ticker) to view short-term technical chart and over ETF name to view long term chart. Click on ticker or stock name for detailed view. Click on to add stock symbol to your watchlist and to view watchlist. |
12Stocks.com List of ETFs that track Smallcap Index
| Ticker | ETF Name | Watchlist | Recent Price | Smart Investing & Trading Score | Change % | Week % | Year-to-date % |
| IWM | iShares Russell 2000 | | 208.22 | 76 | 0.14 | 1.92 | 3.74% |
| VTWO | Vanguard Russell 2000 ETF | | 84.23 | 78 | 0.14 | 1.94 | 3.86% |
| IJR | iShares Core S&P Small-Cap | | 110.44 | 76 | -0.17 | 1.34 | 2.03% |
| IWN | iShares Russell 2000 Value | | 158.65 | 76 | -0.11 | 1.57 | 2.13% |
| IWO | iShares Russell 2000 Growth | | 265.60 | 70 | -0.58 | 2.19 | 5.3% |
| IJS | iShares S&P Small-Cap 600 Value | | 101.96 | 76 | -0.06 | 1.43 | -1.08% |
| IJT | iShares S&P Small-Cap 600 Growth | | 131.39 | 71 | 0.08 | 1.18 | 4.99% |
| XSLV | PowerShares S&P SmallCap Low Volatil ETF | | 44.51 | 83 | 0.07 | 0.63 | 0.82% |
| SMLV | SPDR SSGA US Small Cap Low Volatil ETF | | 112.80 | 90 | 0.01 | 1.42 | 0.25% |
| SAA | ProShares Ultra SmallCap600 | | 24.93 | 71 | 0.61 | 2.38 | -0.08% |
| SBB | ProShares Short SmallCap600 | | 15.71 | 18 | 0.01 | -1.52 | -1.37% |
| SDD | ProShares UltraShort SmallCap600 | | 17.72 | 20 | 0.31 | -3.04 | -3.81% |
| 12Stocks.com: Charts, Trends, Fundamental Data and Performances of SmallCap Stocks | |
|
We now take in-depth look at all SmallCap stocks including charts, multi-period performances and overall trends (as measured by Smart Investing & Trading Score). One can sort SmallCap stocks (click link to choose) by Daily, Weekly and by Year-to-Date performances. Also, one can sort by size of the company or by market capitalization. |
| Select Your Default Chart Type: | |||||
| |||||
| Click on stock symbol or name for detailed view. Click on to add stock symbol to your watchlist and to view watchlist. Quick View: Move mouse or cursor over "Daily" to quickly view daily technical stock chart and over "Weekly" to view weekly technical stock chart. | |||||

 | AROW Arrow Financial Corporation |
| Sector: Financials | |
| SubSector: Regional - Northeast Banks | |
| MarketCap: 413.999 Millions | |
| Recent Price: 25.09 Smart Investing & Trading Score: 100 | |
| Day Percent Change: 0.86% Day Change: 0.21 | |
| Week Change: 5.67% Year-to-date Change: -10.2% | |
| AROW Links: Profile News Message Board | |
| Charts:- Daily , Weekly | |
| Add AROW to Watchlist: View: Get Complete AROW Trend Analysis ➞ | |
 | UBSI United Bankshares, Inc. |
| Sector: Financials | |
| SubSector: Regional - Mid-Atlantic Banks | |
| MarketCap: 2286.79 Millions | |
| Recent Price: 34.96 Smart Investing & Trading Score: 100 | |
| Day Percent Change: 0.84% Day Change: 0.29 | |
| Week Change: 1.6% Year-to-date Change: -6.9% | |
| UBSI Links: Profile News Message Board | |
| Charts:- Daily , Weekly | |
| Add UBSI to Watchlist: View: Get Complete UBSI Trend Analysis ➞ | |
 | IIPR Innovative Industrial Properties, Inc. |
| Sector: Financials | |
| SubSector: REIT - Industrial | |
| MarketCap: 1193.29 Millions | |
| Recent Price: 114.61 Smart Investing & Trading Score: 100 | |
| Day Percent Change: 0.80% Day Change: 0.91 | |
| Week Change: 9.75% Year-to-date Change: 13.7% | |
| IIPR Links: Profile News Message Board | |
| Charts:- Daily , Weekly | |
| Add IIPR to Watchlist: View: Get Complete IIPR Trend Analysis ➞ | |
 | PFBC Preferred Bank |
| Sector: Financials | |
| SubSector: Regional - Pacific Banks | |
| MarketCap: 559.629 Millions | |
| Recent Price: 80.51 Smart Investing & Trading Score: 100 | |
| Day Percent Change: 0.79% Day Change: 0.63 | |
| Week Change: 2.29% Year-to-date Change: 10.2% | |
| PFBC Links: Profile News Message Board | |
| Charts:- Daily , Weekly | |
| Add PFBC to Watchlist: View: Get Complete PFBC Trend Analysis ➞ | |
 | SMBC Southern Missouri Bancorp, Inc. |
| Sector: Financials | |
| SubSector: Savings & Loans | |
| MarketCap: 272.53 Millions | |
| Recent Price: 43.59 Smart Investing & Trading Score: 100 | |
| Day Percent Change: 0.79% Day Change: 0.34 | |
| Week Change: 3.54% Year-to-date Change: -18.4% | |
| SMBC Links: Profile News Message Board | |
| Charts:- Daily , Weekly | |
| Add SMBC to Watchlist: View: Get Complete SMBC Trend Analysis ➞ | |
 | EFSC Enterprise Financial Services Corp |
| Sector: Financials | |
| SubSector: Regional - Southwest Banks | |
| MarketCap: 770.165 Millions | |
| Recent Price: 40.92 Smart Investing & Trading Score: 100 | |
| Day Percent Change: 0.76% Day Change: 0.31 | |
| Week Change: 2.43% Year-to-date Change: -8.4% | |
| EFSC Links: Profile News Message Board | |
| Charts:- Daily , Weekly | |
| Add EFSC to Watchlist: View: Get Complete EFSC Trend Analysis ➞ | |
 | OSBC Old Second Bancorp, Inc. |
| Sector: Financials | |
| SubSector: Regional - Midwest Banks | |
| MarketCap: 237.17 Millions | |
| Recent Price: 14.90 Smart Investing & Trading Score: 100 | |
| Day Percent Change: 0.68% Day Change: 0.10 | |
| Week Change: 2.26% Year-to-date Change: -3.5% | |
| OSBC Links: Profile News Message Board | |
| Charts:- Daily , Weekly | |
| Add OSBC to Watchlist: View: Get Complete OSBC Trend Analysis ➞ | |
 | HSHP Himalaya Shipping Ltd. |
| Sector: Industrials | |
| SubSector: Marine Shipping | |
| MarketCap: 179 Millions | |
| Recent Price: 9.08 Smart Investing & Trading Score: 100 | |
| Day Percent Change: 0.67% Day Change: 0.06 | |
| Week Change: 6.32% Year-to-date Change: 34.5% | |
| HSHP Links: Profile News Message Board | |
| Charts:- Daily , Weekly | |
| Add HSHP to Watchlist: View: Get Complete HSHP Trend Analysis ➞ | |
 | OB Outbrain Inc. |
| Sector: Services & Goods | |
| SubSector: Internet Content & Information | |
| MarketCap: 250 Millions | |
| Recent Price: 4.72 Smart Investing & Trading Score: 100 | |
| Day Percent Change: 0.64% Day Change: 0.03 | |
| Week Change: 4.89% Year-to-date Change: 7.8% | |
| OB Links: Profile News Message Board | |
| Charts:- Daily , Weekly | |
| Add OB to Watchlist: View: Get Complete OB Trend Analysis ➞ | |
 | WAFD Washington Federal, Inc. |
| Sector: Financials | |
| SubSector: Savings & Loans | |
| MarketCap: 2219.2 Millions | |
| Recent Price: 29.97 Smart Investing & Trading Score: 100 | |
| Day Percent Change: 0.60% Day Change: 0.18 | |
| Week Change: 4.79% Year-to-date Change: -9.1% | |
| WAFD Links: Profile News Message Board | |
| Charts:- Daily , Weekly | |
| Add WAFD to Watchlist: View: Get Complete WAFD Trend Analysis ➞ | |
 | SITC SITE Centers Corp. |
| Sector: Financials | |
| SubSector: REIT - Retail | |
| MarketCap: 1449.54 Millions | |
| Recent Price: 14.36 Smart Investing & Trading Score: 100 | |
| Day Percent Change: 0.60% Day Change: 0.09 | |
| Week Change: 3.38% Year-to-date Change: 5.3% | |
| SITC Links: Profile News Message Board | |
| Charts:- Daily , Weekly | |
| Add SITC to Watchlist: View: Get Complete SITC Trend Analysis ➞ | |
 | CWK Cushman & Wakefield plc |
| Sector: Financials | |
| SubSector: Property Management | |
| MarketCap: 2651.62 Millions | |
| Recent Price: 11.71 Smart Investing & Trading Score: 100 | |
| Day Percent Change: 0.52% Day Change: 0.06 | |
| Week Change: 12.33% Year-to-date Change: 8.4% | |
| CWK Links: Profile News Message Board | |
| Charts:- Daily , Weekly | |
| Add CWK to Watchlist: View: Get Complete CWK Trend Analysis ➞ | |
 | ALTR Altair Engineering Inc. |
| Sector: Technology | |
| SubSector: Semiconductor - Specialized | |
| MarketCap: 2072.2 Millions | |
| Recent Price: 91.45 Smart Investing & Trading Score: 100 | |
| Day Percent Change: 0.41% Day Change: 0.37 | |
| Week Change: 7.07% Year-to-date Change: 8.7% | |
| ALTR Links: Profile News Message Board | |
| Charts:- Daily , Weekly | |
| Add ALTR to Watchlist: View: Get Complete ALTR Trend Analysis ➞ | |
 | ESE ESCO Technologies Inc. |
| Sector: Technology | |
| SubSector: Scientific & Technical Instruments | |
| MarketCap: 1968.03 Millions | |
| Recent Price: 108.57 Smart Investing & Trading Score: 100 | |
| Day Percent Change: 0.38% Day Change: 0.41 | |
| Week Change: 3.4% Year-to-date Change: -7.2% | |
| ESE Links: Profile News Message Board | |
| Charts:- Daily , Weekly | |
| Add ESE to Watchlist: View: Get Complete ESE Trend Analysis ➞ | |
 | KRO Kronos Worldwide, Inc. |
| Sector: Materials | |
| SubSector: Specialty Chemicals | |
| MarketCap: 1046.57 Millions | |
| Recent Price: 13.25 Smart Investing & Trading Score: 100 | |
| Day Percent Change: 0.23% Day Change: 0.03 | |
| Week Change: 2.63% Year-to-date Change: 33.3% | |
| KRO Links: Profile News Message Board | |
| Charts:- Daily , Weekly | |
| Add KRO to Watchlist: View: Get Complete KRO Trend Analysis ➞ | |
 | BCBP BCB Bancorp, Inc. |
| Sector: Financials | |
| SubSector: Regional - Northeast Banks | |
| MarketCap: 196.799 Millions | |
| Recent Price: 10.89 Smart Investing & Trading Score: 100 | |
| Day Percent Change: 0.23% Day Change: 0.03 | |
| Week Change: 3.57% Year-to-date Change: -15.3% | |
| BCBP Links: Profile News Message Board | |
| Charts:- Daily , Weekly | |
| Add BCBP to Watchlist: View: Get Complete BCBP Trend Analysis ➞ | |
 | TRS TriMas Corporation |
| Sector: Industrials | |
| SubSector: Industrial Equipment & Components | |
| MarketCap: 963.509 Millions | |
| Recent Price: 27.86 Smart Investing & Trading Score: 100 | |
| Day Percent Change: 0.22% Day Change: 0.06 | |
| Week Change: 3.96% Year-to-date Change: 10.0% | |
| TRS Links: Profile News Message Board | |
| Charts:- Daily , Weekly | |
| Add TRS to Watchlist: View: Get Complete TRS Trend Analysis ➞ | |
 | VSH Vishay Intertechnology, Inc. |
| Sector: Technology | |
| SubSector: Semiconductor - Broad Line | |
| MarketCap: 2132.52 Millions | |
| Recent Price: 23.85 Smart Investing & Trading Score: 100 | |
| Day Percent Change: 0.17% Day Change: 0.04 | |
| Week Change: 5.95% Year-to-date Change: -0.5% | |
| VSH Links: Profile News Message Board | |
| Charts:- Daily , Weekly | |
| Add VSH to Watchlist: View: Get Complete VSH Trend Analysis ➞ | |
 | KREF KKR Real Estate Finance Trust Inc. |
| Sector: Financials | |
| SubSector: Mortgage Investment | |
| MarketCap: 645.939 Millions | |
| Recent Price: 9.85 Smart Investing & Trading Score: 100 | |
| Day Percent Change: 0.14% Day Change: 0.01 | |
| Week Change: 3.18% Year-to-date Change: -25.5% | |
| KREF Links: Profile News Message Board | |
| Charts:- Daily , Weekly | |
| Add KREF to Watchlist: View: Get Complete KREF Trend Analysis ➞ | |
 | ABM ABM Industries Incorporated |
| Sector: Services & Goods | |
| SubSector: Business Services | |
| MarketCap: 1706.72 Millions | |
| Recent Price: 46.72 Smart Investing & Trading Score: 100 | |
| Day Percent Change: 0.13% Day Change: 0.06 | |
| Week Change: 1.76% Year-to-date Change: 4.2% | |
| ABM Links: Profile News Message Board | |
| Charts:- Daily , Weekly | |
| Add ABM to Watchlist: View: Get Complete ABM Trend Analysis ➞ | |
 | NWE NorthWestern Corporation |
| Sector: Utilities | |
| SubSector: Diversified Utilities | |
| MarketCap: 2801.8 Millions | |
| Recent Price: 52.61 Smart Investing & Trading Score: 100 | |
| Day Percent Change: 0.13% Day Change: 0.07 | |
| Week Change: 1.62% Year-to-date Change: 3.4% | |
| NWE Links: Profile News Message Board | |
| Charts:- Daily , Weekly | |
| Add NWE to Watchlist: View: Get Complete NWE Trend Analysis ➞ | |
 | NSP Insperity, Inc. |
| Sector: Services & Goods | |
| SubSector: Business Services | |
| MarketCap: 1385.32 Millions | |
| Recent Price: 105.27 Smart Investing & Trading Score: 100 | |
| Day Percent Change: 0.04% Day Change: 0.04 | |
| Week Change: 0.11% Year-to-date Change: -10.2% | |
| NSP Links: Profile News Message Board | |
| Charts:- Daily , Weekly | |
| Add NSP to Watchlist: View: Get Complete NSP Trend Analysis ➞ | |
 | BFS Saul Centers, Inc. |
| Sector: Financials | |
| SubSector: REIT - Retail | |
| MarketCap: 689.914 Millions | |
| Recent Price: 37.91 Smart Investing & Trading Score: 100 | |
| Day Percent Change: 0.00% Day Change: 0.00 | |
| Week Change: 2.76% Year-to-date Change: -3.5% | |
| BFS Links: Profile News Message Board | |
| Charts:- Daily , Weekly | |
| Add BFS to Watchlist: View: Get Complete BFS Trend Analysis ➞ | |
 | CDZI Cadiz Inc. |
| Sector: Utilities | |
| SubSector: Water Utilities | |
| MarketCap: 265.502 Millions | |
| Recent Price: 3.00 Smart Investing & Trading Score: 100 | |
| Day Percent Change: 0.00% Day Change: 0.00 | |
| Week Change: 28.76% Year-to-date Change: 7.1% | |
| CDZI Links: Profile News Message Board | |
| Charts:- Daily , Weekly | |
| Add CDZI to Watchlist: View: Get Complete CDZI Trend Analysis ➞ | |
 | ESSA ESSA Bancorp, Inc. |
| Sector: Financials | |
| SubSector: Savings & Loans | |
| MarketCap: 171.33 Millions | |
| Recent Price: 17.78 Smart Investing & Trading Score: 100 | |
| Day Percent Change: 0.00% Day Change: 0.00 | |
| Week Change: 2.54% Year-to-date Change: -11.2% | |
| ESSA Links: Profile News Message Board | |
| Charts:- Daily , Weekly | |
| Add ESSA to Watchlist: View: Get Complete ESSA Trend Analysis ➞ | |
| For tabular summary view of above stock list: Summary View ➞ 0 - 25 , 25 - 50 , 50 - 75 , 75 - 100 , 100 - 125 , 125 - 150 , 150 - 175 , 175 - 200 , 200 - 225 , 225 - 250 , 250 - 275 , 275 - 300 , 300 - 325 , 325 - 350 , 350 - 375 , 375 - 400 , 400 - 425 , 425 - 450 , 450 - 475 , 475 - 500 , 500 - 525 , 525 - 550 , 550 - 575 , 575 - 600 , 600 - 625 , 625 - 650 , 650 - 675 , 675 - 700 , 700 - 725 , 725 - 750 , 750 - 775 , 775 - 800 , 800 - 825 , 825 - 850 , 850 - 875 , 875 - 900 , 900 - 925 , 925 - 950 , 950 - 975 , 975 - 1000 , 1000 - 1025 , 1025 - 1050 , 1050 - 1075 , 1075 - 1100 , 1100 - 1125 , 1125 - 1150 , 1150 - 1175 , 1175 - 1200 , 1200 - 1225 , 1225 - 1250 , 1250 - 1275 , 1275 - 1300 , 1300 - 1325 , 1325 - 1350 , 1350 - 1375 , 1375 - 1400 , 1400 - 1425 , 1425 - 1450 , 1450 - 1475 , 1475 - 1500 , 1500 - 1525 , 1525 - 1550 | ||
| Click To Change The Sort Order: By Market Cap or Company Size Performance: Year-to-date, Week and Day | |
| Select Chart Type: | ||
| Too many stocks? View smallcap stocks filtered by marketcap & sector |
| Marketcap: All SmallCap Stocks (default-no microcap), Large, Mid-Range, Small & MicroCap |
| Sector: Tech, Finance, Energy, Staples, Retail, Industrial, Materials, Utilities & Medical |
|
Best Stocks Today 12Stocks.com |
© 2024 12Stocks.com Terms & Conditions Privacy Contact Us
All Information Provided Only For Education And Not To Be Used For Investing or Trading. See Terms & Conditions


One More Thing ... Get Best Stocks Delivered Daily!
Never Ever Miss A Move With Our Top Ten Stocks Lists
Find Best Stocks In Any Market - Bull or Bear Market
Take A Peek At Our Top Ten Stocks Lists: Daily, Weekly, Year-to-Date & Top Trends
Find Best Stocks In Any Market - Bull or Bear Market
Take A Peek At Our Top Ten Stocks Lists: Daily, Weekly, Year-to-Date & Top Trends
Smallcap Stocks With Best Up Trends [0-bearish to 100-bullish]: Hecla Mining[100], Coeur Mining[100], MicroStrategy [100], Fossil Group[100], Energy Fuels[100], NovaGold Resources[100], Gannett Co[100], Rayonier Advanced[100], Shore Bancshares[100], Arbutus Biopharma[100], Palomar [100]
Best Smallcap Stocks Year-to-Date:
CareMax [471.13%], Bakkt [364.13%], Janux [340.72%], Viking [266.74%], Longboard [233.72%], Super Micro[220.71%], Avidity Biosciences[220.69%], Sweetgreen [180.18%], Novavax [175.1%], Vera [170.54%], Arcutis Bio[169.5%] Best Smallcap Stocks This Week:
Maxeon Solar[49.31%], Novavax [48.7%], MacroGenics [44.71%], Fossil Group[37.51%], Humacyte [37.02%], Workhorse Group[36.06%], ProKidney [34.88%], Allbirds [34.21%], Tellurian [33.56%], MicroStrategy [32.16%], Emergent BioSolutions[31.72%] Best Smallcap Stocks Daily:
Presto Automation[23.56%], Sangamo [10.71%], Children s[10.61%], Hecla Mining[10.56%], Coeur Mining[9.68%], Emergent BioSolutions[8.73%], MicroStrategy [8.35%], Tellurian [7.43%], American Vanguard[7.42%], Fossil Group[6.83%], Energy Fuels[6.67%]