
 Login Sign Up


| |||||
 |  | ||||

| 12Stocks.com Market Intelligence |
Best SmallCap Stocks
|
| In a hurry? Small Cap Stock Lists: Performance Trends Table, Stock Charts
Sort Small Cap stocks: Daily, Weekly, Year-to-Date, Market Cap & Trends. Filter Small Cap stocks list by sector: Show all, Tech, Finance, Energy, Staples, Retail, Industrial, Materials, Utilities and HealthCare Filter Small Cap stocks list by size: All Large Medium Small and MicroCap |
| 12Stocks.com Small Cap Stocks Performances & Trends Daily | |||||||||
|
|  The overall Smart Investing & Trading Score is 41 (0-bearish to 100-bullish) which puts Small Cap index in short term neutral trend. The Smart Investing & Trading Score from previous trading session is 88 and hence a deterioration of trend.
| ||||||||
Here are the Smart Investing & Trading Scores of the most requested small cap stocks at 12Stocks.com (click stock name for detailed review):
|


| 12Stocks.com: Investing in Smallcap Index with Stocks | |
|
The following table helps investors and traders sort through current performance and trends (as measured by Smart Investing & Trading Score) of various
stocks in the Smallcap Index. Quick View: Move mouse or cursor over stock symbol (ticker) to view short-term technical chart and over stock name to view long term chart. Click on  to add stock symbol to your watchlist and to add stock symbol to your watchlist and  to view watchlist. Click on any ticker or stock name for detailed market intelligence report for that stock. to view watchlist. Click on any ticker or stock name for detailed market intelligence report for that stock. |
12Stocks.com Performance of Stocks in Smallcap Index
| Ticker | Stock Name | Watchlist | Category | Recent Price | Smart Investing & Trading Score | Change % | YTD Change% |
| BLFS | BioLife Solutions |   | Health Care | 17.54 | 93 | -1.63% | 7.94% |
| FULT | Fulton Financial | | Financials | 16.55 | 93 | -1.49% | 0.55% |
| TTMI | TTM | | Technology | 14.93 | 93 | -1.45% | -5.57% |
| EXPO | Exponent | | Services & Goods | 91.91 | 93 | -1.38% | 4.40% |
| DOLE | Dole | | Consumer Staples | 12.17 | 93 | -1.38% | -1.34% |
| SLCA | U.S. Silica | | Materials | 15.43 | 93 | -0.84% | 36.43% |
| DEI | Douglas Emmett | | Financials | 13.71 | 93 | -0.72% | -5.45% |
| PDM | Piedmont Office | | Financials | 6.89 | 93 | -0.72% | -3.09% |
| VSTO | Vista Outdoor | | Consumer Staples | 35.09 | 93 | -0.71% | 18.67% |
| CERE | Cerevel | | Health Care | 42.71 | 93 | -0.09% | 0.75% |
| DCPH | Deciphera | | Health Care | 25.27 | 93 | -0.04% | 56.66% |
| NVAX | Novavax | | Health Care | 4.33 | 93 | 0.93% | -9.79% |
| EPRT | Essential Properties | | Financials | 26.34 | 93 | 0.11% | 3.05% |
| NWE | NorthWestern | | Utilities | 50.44 | 93 | -0.08% | -0.88% |
| VKTX | Viking | | Health Care | 79.58 | 90 | 5.39% | 327.62% |
| ARLO | Arlo | | Technology | 12.38 | 90 | 2.40% | 30.04% |
| TPB | Turning Point | | Consumer Staples | 28.84 | 90 | 1.51% | 9.57% |
| AFCG | AFC Gamma | | Financials | 12.00 | 90 | 0.93% | -0.41% |
| KNSA | Kiniksa | | Health Care | 18.72 | 90 | 0.92% | 6.73% |
| SLDP | Solid Power | | Industrials | 1.70 | 90 | 0.89% | 18.95% |
| USLM | United States | | Industrials | 310.00 | 90 | 0.32% | 34.58% |
| AGTI | Agiliti | | Health Care | 10.15 | 90 | 0.30% | 28.81% |
| WWW | Wolverine World | | Consumer Staples | 10.74 | 90 | 0.09% | 20.81% |
| SHAK | Shake Shack | | Services & Goods | 105.85 | 90 | 0.05% | 42.81% |
| PBH | Prestige Consumer | | Health Care | 71.76 | 90 | 0.03% | 17.22% |


| Too many stocks? View smallcap stocks filtered by marketcap & sector |
| Marketcap: All SmallCap Stocks (default-no microcap), Large, Mid-Range, Small |
| Smallcap Sector: Tech, Finance, Energy, Staples, Retail, Industrial, Materials, & Medical |
|
Get the most comprehensive stock market coverage daily at 12Stocks.com ➞ Best Stocks Today ➞ Best Stocks Weekly ➞ Best Stocks Year-to-Date ➞ Best Stocks Trends ➞  Best Stocks Today 12Stocks.com Best Nasdaq Stocks ➞ Best S&P 500 Stocks ➞ Best Tech Stocks ➞ Best Biotech Stocks ➞ |
| Detailed Overview of SmallCap Stocks |
| SmallCap Technical Overview, Leaders & Laggards, Top SmallCap ETF Funds & Detailed SmallCap Stocks List, Charts, Trends & More |
| Smallcap: Technical Analysis, Trends & YTD Performance | |
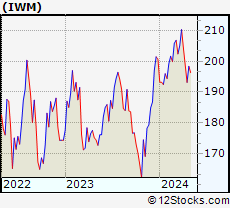
| SmallCap segment as represented by
IWM, an exchange-traded fund [ETF], holds basket of thousands of smallcap stocks from across all major sectors of the US stock market. The smallcap index (contains stocks like Riverbed & Sotheby's) is down by -2.4% and is currently underperforming the overall market by -7.2% year-to-date. Below is a quick view of technical charts and trends: | |
 IWM Weekly Chart |
|
| Long Term Trend: Good | |
| Medium Term Trend: Not Good | |
 IWM Daily Chart |
|
| Short Term Trend: Not Good | |
| Overall Trend Score: 41 | |
| YTD Performance: -2.4% | |
| **Trend Scores & Views Are Only For Educational Purposes And Not For Investing | |
| 12Stocks.com: Top Performing Small Cap Index Stocks | ||||||||||||||||||||||||||||||||||||||||||||||||
 The top performing Small Cap Index stocks year to date are
Now, more recently, over last week, the top performing Small Cap Index stocks on the move are


|
||||||||||||||||||||||||||||||||||||||||||||||||
| 12Stocks.com: Investing in Smallcap Index using Exchange Traded Funds | |
|
The following table shows list of key exchange traded funds (ETF) that
help investors track Smallcap index. The following list also includes leveraged ETF funds that track twice or thrice the daily returns of Smallcap indices. Short or inverse ETF funds move in the opposite direction to the index they track and are useful during market pullbacks or during bear markets. Quick View: Move mouse or cursor over ETF symbol (ticker) to view short-term technical chart and over ETF name to view long term chart. Click on ticker or stock name for detailed view. Click on to add stock symbol to your watchlist and to view watchlist. |
12Stocks.com List of ETFs that track Smallcap Index
| Ticker | ETF Name | Watchlist | Recent Price | Smart Investing & Trading Score | Change % | Week % | Year-to-date % |
| IWM | iShares Russell 2000 | | 195.90 | 41 | -2.03 | -1.26 | -2.4% |
| IJR | iShares Core S&P Small-Cap | | 104.39 | 86 | -1.90 | -1.19 | -3.57% |
| VTWO | Vanguard Russell 2000 ETF | | 79.16 | 81 | -2.01 | -1.32 | -2.39% |
| IWN | iShares Russell 2000 Value | | 149.04 | 86 | -1.98 | -1.39 | -4.05% |
| IWO | iShares Russell 2000 Growth | | 250.32 | 81 | -2.12 | -1.09 | -0.75% |
| IJS | iShares S&P Small-Cap 600 Value | | 96.08 | 68 | -1.91 | -1.14 | -6.78% |
| IJT | iShares S&P Small-Cap 600 Growth | | 124.60 | 88 | -1.86 | -1.18 | -0.43% |
| XSLV | PowerShares S&P SmallCap Low Volatil ETF | | 42.54 | 73 | -0.77 | -0.42 | -3.65% |
| SMLV | SPDR SSGA US Small Cap Low Volatil ETF | | 106.26 | 61 | -1.40 | -1.17 | -5.56% |
| SDD | ProShares UltraShort SmallCap600 | | 19.57 | 17 | 2.51 | 1.14 | 6.21% |
| SAA | ProShares Ultra SmallCap600 | | 22.60 | 81 | -2.88 | -1.91 | -9.42% |
| SBB | ProShares Short SmallCap600 | | 16.55 | 15 | 1.66 | 1.01 | 3.89% |
| 12Stocks.com: Charts, Trends, Fundamental Data and Performances of SmallCap Stocks | |
|
We now take in-depth look at all SmallCap stocks including charts, multi-period performances and overall trends (as measured by Smart Investing & Trading Score). One can sort SmallCap stocks (click link to choose) by Daily, Weekly and by Year-to-Date performances. Also, one can sort by size of the company or by market capitalization. |
| Select Your Default Chart Type: | |||||
| |||||
| Click on stock symbol or name for detailed view. Click on to add stock symbol to your watchlist and to view watchlist. Quick View: Move mouse or cursor over "Daily" to quickly view daily technical stock chart and over "Weekly" to view weekly technical stock chart. | |||||

 | BLFS BioLife Solutions, Inc. |
| Sector: Health Care | |
| SubSector: Medical Instruments & Supplies | |
| MarketCap: 264.36 Millions | |
| Recent Price: 17.54 Smart Investing & Trading Score: 93 | |
| Day Percent Change: -1.63% Day Change: -0.29 | |
| Week Change: 0.06% Year-to-date Change: 7.9% | |
| BLFS Links: Profile News Message Board | |
| Charts:- Daily , Weekly | |
| Add BLFS to Watchlist: View: Get Complete BLFS Trend Analysis ➞ | |
 | FULT Fulton Financial Corporation |
| Sector: Financials | |
| SubSector: Regional - Northeast Banks | |
| MarketCap: 2030.89 Millions | |
| Recent Price: 16.55 Smart Investing & Trading Score: 93 | |
| Day Percent Change: -1.49% Day Change: -0.25 | |
| Week Change: 5.95% Year-to-date Change: 0.6% | |
| FULT Links: Profile News Message Board | |
| Charts:- Daily , Weekly | |
| Add FULT to Watchlist: View: Get Complete FULT Trend Analysis ➞ | |
 | TTMI TTM Technologies, Inc. |
| Sector: Technology | |
| SubSector: Printed Circuit Boards | |
| MarketCap: 1028.35 Millions | |
| Recent Price: 14.93 Smart Investing & Trading Score: 93 | |
| Day Percent Change: -1.45% Day Change: -0.22 | |
| Week Change: -1.32% Year-to-date Change: -5.6% | |
| TTMI Links: Profile News Message Board | |
| Charts:- Daily , Weekly | |
| Add TTMI to Watchlist: View: Get Complete TTMI Trend Analysis ➞ | |
 | EXPO Exponent, Inc. |
| Sector: Services & Goods | |
| SubSector: Management Services | |
| MarketCap: 3605.95 Millions | |
| Recent Price: 91.91 Smart Investing & Trading Score: 93 | |
| Day Percent Change: -1.38% Day Change: -1.29 | |
| Week Change: -3.47% Year-to-date Change: 4.4% | |
| EXPO Links: Profile News Message Board | |
| Charts:- Daily , Weekly | |
| Add EXPO to Watchlist: View: Get Complete EXPO Trend Analysis ➞ | |
 | DOLE Dole plc |
| Sector: Consumer Staples | |
| SubSector: Farm Products | |
| MarketCap: 1300 Millions | |
| Recent Price: 12.17 Smart Investing & Trading Score: 93 | |
| Day Percent Change: -1.38% Day Change: -0.17 | |
| Week Change: -0.08% Year-to-date Change: -1.3% | |
| DOLE Links: Profile News Message Board | |
| Charts:- Daily , Weekly | |
| Add DOLE to Watchlist: View: Get Complete DOLE Trend Analysis ➞ | |
 | SLCA U.S. Silica Holdings, Inc. |
| Sector: Materials | |
| SubSector: Industrial Metals & Minerals | |
| MarketCap: 93 Millions | |
| Recent Price: 15.43 Smart Investing & Trading Score: 93 | |
| Day Percent Change: -0.84% Day Change: -0.13 | |
| Week Change: -2.89% Year-to-date Change: 36.4% | |
| SLCA Links: Profile News Message Board | |
| Charts:- Daily , Weekly | |
| Add SLCA to Watchlist: View: Get Complete SLCA Trend Analysis ➞ | |
 | DEI Douglas Emmett, Inc. |
| Sector: Financials | |
| SubSector: REIT - Diversified | |
| MarketCap: 4917.83 Millions | |
| Recent Price: 13.71 Smart Investing & Trading Score: 93 | |
| Day Percent Change: -0.72% Day Change: -0.10 | |
| Week Change: 2.54% Year-to-date Change: -5.5% | |
| DEI Links: Profile News Message Board | |
| Charts:- Daily , Weekly | |
| Add DEI to Watchlist: View: Get Complete DEI Trend Analysis ➞ | |
 | PDM Piedmont Office Realty Trust, Inc. |
| Sector: Financials | |
| SubSector: REIT - Office | |
| MarketCap: 2097.46 Millions | |
| Recent Price: 6.89 Smart Investing & Trading Score: 93 | |
| Day Percent Change: -0.72% Day Change: -0.05 | |
| Week Change: 2.68% Year-to-date Change: -3.1% | |
| PDM Links: Profile News Message Board | |
| Charts:- Daily , Weekly | |
| Add PDM to Watchlist: View: Get Complete PDM Trend Analysis ➞ | |
 | VSTO Vista Outdoor Inc. |
| Sector: Consumer Staples | |
| SubSector: Sporting Goods | |
| MarketCap: 405.144 Millions | |
| Recent Price: 35.09 Smart Investing & Trading Score: 93 | |
| Day Percent Change: -0.71% Day Change: -0.25 | |
| Week Change: 0.34% Year-to-date Change: 18.7% | |
| VSTO Links: Profile News Message Board | |
| Charts:- Daily , Weekly | |
| Add VSTO to Watchlist: View: Get Complete VSTO Trend Analysis ➞ | |
 | CERE Cerevel Therapeutics Holdings, Inc. |
| Sector: Health Care | |
| SubSector: Biotechnology | |
| MarketCap: 21587 Millions | |
| Recent Price: 42.71 Smart Investing & Trading Score: 93 | |
| Day Percent Change: -0.09% Day Change: -0.04 | |
| Week Change: 0.57% Year-to-date Change: 0.8% | |
| CERE Links: Profile News Message Board | |
| Charts:- Daily , Weekly | |
| Add CERE to Watchlist: View: Get Complete CERE Trend Analysis ➞ | |
 | DCPH Deciphera Pharmaceuticals, Inc. |
| Sector: Health Care | |
| SubSector: Biotechnology | |
| MarketCap: 2329.95 Millions | |
| Recent Price: 25.27 Smart Investing & Trading Score: 93 | |
| Day Percent Change: -0.04% Day Change: -0.01 | |
| Week Change: 72.49% Year-to-date Change: 56.7% | |
| DCPH Links: Profile News Message Board | |
| Charts:- Daily , Weekly | |
| Add DCPH to Watchlist: View: Get Complete DCPH Trend Analysis ➞ | |
 | NVAX Novavax, Inc. |
| Sector: Health Care | |
| SubSector: Biotechnology | |
| MarketCap: 376.185 Millions | |
| Recent Price: 4.33 Smart Investing & Trading Score: 93 | |
| Day Percent Change: 0.93% Day Change: 0.04 | |
| Week Change: 5.87% Year-to-date Change: -9.8% | |
| NVAX Links: Profile News Message Board | |
| Charts:- Daily , Weekly | |
| Add NVAX to Watchlist: View: Get Complete NVAX Trend Analysis ➞ | |
 | EPRT Essential Properties Realty Trust, Inc. |
| Sector: Financials | |
| SubSector: REIT - Diversified | |
| MarketCap: 1424.43 Millions | |
| Recent Price: 26.34 Smart Investing & Trading Score: 93 | |
| Day Percent Change: 0.11% Day Change: 0.03 | |
| Week Change: 2.53% Year-to-date Change: 3.1% | |
| EPRT Links: Profile News Message Board | |
| Charts:- Daily , Weekly | |
| Add EPRT to Watchlist: View: Get Complete EPRT Trend Analysis ➞ | |
 | NWE NorthWestern Corporation |
| Sector: Utilities | |
| SubSector: Diversified Utilities | |
| MarketCap: 2801.8 Millions | |
| Recent Price: 50.44 Smart Investing & Trading Score: 93 | |
| Day Percent Change: -0.08% Day Change: -0.04 | |
| Week Change: 1.8% Year-to-date Change: -0.9% | |
| NWE Links: Profile News Message Board | |
| Charts:- Daily , Weekly | |
| Add NWE to Watchlist: View: Get Complete NWE Trend Analysis ➞ | |
 | VKTX Viking Therapeutics, Inc. |
| Sector: Health Care | |
| SubSector: Biotechnology | |
| MarketCap: 388.585 Millions | |
| Recent Price: 79.58 Smart Investing & Trading Score: 90 | |
| Day Percent Change: 5.39% Day Change: 4.07 | |
| Week Change: 7.09% Year-to-date Change: 327.6% | |
| VKTX Links: Profile News Message Board | |
| Charts:- Daily , Weekly | |
| Add VKTX to Watchlist: View: Get Complete VKTX Trend Analysis ➞ | |
 | ARLO Arlo Technologies, Inc. |
| Sector: Technology | |
| SubSector: Security Software & Services | |
| MarketCap: 163.317 Millions | |
| Recent Price: 12.38 Smart Investing & Trading Score: 90 | |
| Day Percent Change: 2.40% Day Change: 0.29 | |
| Week Change: 4.92% Year-to-date Change: 30.0% | |
| ARLO Links: Profile News Message Board | |
| Charts:- Daily , Weekly | |
| Add ARLO to Watchlist: View: Get Complete ARLO Trend Analysis ➞ | |
 | TPB Turning Point Brands, Inc. |
| Sector: Consumer Staples | |
| SubSector: Tobacco Products, Other | |
| MarketCap: 381.97 Millions | |
| Recent Price: 28.84 Smart Investing & Trading Score: 90 | |
| Day Percent Change: 1.51% Day Change: 0.43 | |
| Week Change: 2.12% Year-to-date Change: 9.6% | |
| TPB Links: Profile News Message Board | |
| Charts:- Daily , Weekly | |
| Add TPB to Watchlist: View: Get Complete TPB Trend Analysis ➞ | |
 | AFCG AFC Gamma, Inc. |
| Sector: Financials | |
| SubSector: REIT - Specialty | |
| MarketCap: 269 Millions | |
| Recent Price: 12.00 Smart Investing & Trading Score: 90 | |
| Day Percent Change: 0.93% Day Change: 0.11 | |
| Week Change: 1.52% Year-to-date Change: -0.4% | |
| AFCG Links: Profile News Message Board | |
| Charts:- Daily , Weekly | |
| Add AFCG to Watchlist: View: Get Complete AFCG Trend Analysis ➞ | |
 | KNSA Kiniksa Pharmaceuticals, Ltd. |
| Sector: Health Care | |
| SubSector: Biotechnology | |
| MarketCap: 780.285 Millions | |
| Recent Price: 18.72 Smart Investing & Trading Score: 90 | |
| Day Percent Change: 0.92% Day Change: 0.17 | |
| Week Change: 4.7% Year-to-date Change: 6.7% | |
| KNSA Links: Profile News Message Board | |
| Charts:- Daily , Weekly | |
| Add KNSA to Watchlist: View: Get Complete KNSA Trend Analysis ➞ | |
 | SLDP Solid Power, Inc. |
| Sector: Industrials | |
| SubSector: Electrical Equipment & Parts | |
| MarketCap: 445 Millions | |
| Recent Price: 1.70 Smart Investing & Trading Score: 90 | |
| Day Percent Change: 0.89% Day Change: 0.02 | |
| Week Change: -0.88% Year-to-date Change: 19.0% | |
| SLDP Links: Profile News Message Board | |
| Charts:- Daily , Weekly | |
| Add SLDP to Watchlist: View: Get Complete SLDP Trend Analysis ➞ | |
 | USLM United States Lime & Minerals, Inc. |
| Sector: Industrials | |
| SubSector: General Building Materials | |
| MarketCap: 427.653 Millions | |
| Recent Price: 310.00 Smart Investing & Trading Score: 90 | |
| Day Percent Change: 0.32% Day Change: 1.00 | |
| Week Change: 0.83% Year-to-date Change: 34.6% | |
| USLM Links: Profile News Message Board | |
| Charts:- Daily , Weekly | |
| Add USLM to Watchlist: View: Get Complete USLM Trend Analysis ➞ | |
 | AGTI Agiliti, Inc. |
| Sector: Health Care | |
| SubSector: Health Information Services | |
| MarketCap: 2270 Millions | |
| Recent Price: 10.15 Smart Investing & Trading Score: 90 | |
| Day Percent Change: 0.30% Day Change: 0.03 | |
| Week Change: 1% Year-to-date Change: 28.8% | |
| AGTI Links: Profile News Message Board | |
| Charts:- Daily , Weekly | |
| Add AGTI to Watchlist: View: Get Complete AGTI Trend Analysis ➞ | |
 | WWW Wolverine World Wide, Inc. |
| Sector: Consumer Staples | |
| SubSector: Textile - Apparel Footwear & Accessories | |
| MarketCap: 1390.7 Millions | |
| Recent Price: 10.74 Smart Investing & Trading Score: 90 | |
| Day Percent Change: 0.09% Day Change: 0.01 | |
| Week Change: -1.47% Year-to-date Change: 20.8% | |
| WWW Links: Profile News Message Board | |
| Charts:- Daily , Weekly | |
| Add WWW to Watchlist: View: Get Complete WWW Trend Analysis ➞ | |
 | SHAK Shake Shack Inc. |
| Sector: Services & Goods | |
| SubSector: Specialty Eateries | |
| MarketCap: 1497.67 Millions | |
| Recent Price: 105.85 Smart Investing & Trading Score: 90 | |
| Day Percent Change: 0.05% Day Change: 0.05 | |
| Week Change: 0.92% Year-to-date Change: 42.8% | |
| SHAK Links: Profile News Message Board | |
| Charts:- Daily , Weekly | |
| Add SHAK to Watchlist: View: Get Complete SHAK Trend Analysis ➞ | |
 | PBH Prestige Consumer Healthcare Inc. |
| Sector: Health Care | |
| SubSector: Medical Appliances & Equipment | |
| MarketCap: 1639.6 Millions | |
| Recent Price: 71.76 Smart Investing & Trading Score: 90 | |
| Day Percent Change: 0.03% Day Change: 0.02 | |
| Week Change: 1.83% Year-to-date Change: 17.2% | |
| PBH Links: Profile News Message Board | |
| Charts:- Daily , Weekly | |
| Add PBH to Watchlist: View: Get Complete PBH Trend Analysis ➞ | |
| Too many stocks? View smallcap stocks filtered by marketcap & sector |
| Marketcap: All SmallCap Stocks (default-no microcap), Large, Mid-Range, Small & MicroCap |
| Sector: Tech, Finance, Energy, Staples, Retail, Industrial, Materials, Utilities & Medical |
|
Best Stocks Today 12Stocks.com |
© 2024 12Stocks.com Terms & Conditions Privacy Contact Us
All Information Provided Only For Education And Not To Be Used For Investing or Trading. See Terms & Conditions


One More Thing ... Get Best Stocks Delivered Daily!
Never Ever Miss A Move With Our Top Ten Stocks Lists
Find Best Stocks In Any Market - Bull or Bear Market
Take A Peek At Our Top Ten Stocks Lists: Daily, Weekly, Year-to-Date & Top Trends
Find Best Stocks In Any Market - Bull or Bear Market
Take A Peek At Our Top Ten Stocks Lists: Daily, Weekly, Year-to-Date & Top Trends
Smallcap Stocks With Best Up Trends [0-bearish to 100-bullish]: Allegheny [100], Brinker [100], Day One[100], Heartland Financial[100], Carpenter [100], LTC Properties[100], Semtech [100], California Water[100], Impinj [100], Sensient [100], Costamare [100]
Best Smallcap Stocks Year-to-Date:
Janux [431.32%], Viking [327.62%], Longboard [248.2%], Alpine Immune[239.23%], Super Micro[202.12%], Bakkt [200.9%], Avidity Biosciences[167.04%], Cullinan Oncology[164.88%], Arcutis Bio[157.59%], Vera [155.36%], Hippo [134.8%] Best Smallcap Stocks This Week:
Deciphera [72.49%], Cue Biopharma[39.19%], GrowGeneration [34.68%], Phibro Animal[31.19%], LendingTree [27.36%], Janux [20.3%], Seres [20.07%], Eyenovia [19.55%], P3 Health[18.22%], Heartland Financial[17.89%], Harmonic [16.74%] Best Smallcap Stocks Daily:
Cue Biopharma[33.80%], GrowGeneration [30.00%], LendingTree [29.24%], SES AI[17.04%], Allegheny [15.03%], AnaptysBio [14.27%], Harmonic [14.26%], LSB Industries[13.14%], P3 Health[12.09%], Clearwater Paper[10.69%], Seres [8.98%]