
 Login Sign Up


| |||||
 |  | ||||

| 12Stocks.com Market Intelligence |
Best SmallCap Stocks
|
| In a hurry? Small Cap Stock Lists: Performance Trends Table, Stock Charts
Sort Small Cap stocks: Daily, Weekly, Year-to-Date, Market Cap & Trends. Filter Small Cap stocks list by sector: Show all, Tech, Finance, Energy, Staples, Retail, Industrial, Materials, Utilities and HealthCare Filter Small Cap stocks list by size: All Large Medium Small and MicroCap |
| 12Stocks.com Small Cap Stocks Performances & Trends Daily | |||||||||
|
|  The overall Smart Investing & Trading Score is 87 (0-bearish to 100-bullish) which puts Small Cap index in short term bullish trend. The Smart Investing & Trading Score from previous trading session is 82 and hence an improvement of trend.
| ||||||||
Here are the Smart Investing & Trading Scores of the most requested small cap stocks at 12Stocks.com (click stock name for detailed review):
|


| 12Stocks.com: Investing in Smallcap Index with Stocks | |
|
The following table helps investors and traders sort through current performance and trends (as measured by Smart Investing & Trading Score) of various
stocks in the Smallcap Index. Quick View: Move mouse or cursor over stock symbol (ticker) to view short-term technical chart and over stock name to view long term chart. Click on  to add stock symbol to your watchlist and to add stock symbol to your watchlist and  to view watchlist. Click on any ticker or stock name for detailed market intelligence report for that stock. to view watchlist. Click on any ticker or stock name for detailed market intelligence report for that stock. |
12Stocks.com Performance of Stocks in Smallcap Index
| Ticker | Stock Name | Watchlist | Category | Recent Price | Smart Investing & Trading Score | Change % | YTD Change% |
| OXM | Oxford Industries |   | Consumer Staples | 109.57 | 95 | 0.75% | 9.57% |
| SBRA | Sabra Health | | Financials | 14.72 | 95 | 0.75% | 3.15% |
| HLNE | Hamilton Lane | | Financials | 118.62 | 95 | 0.69% | 4.57% |
| CVCO | Cavco Industries | | Industrials | 384.08 | 95 | 0.67% | 10.81% |
| TRN | Trinity Industries | | Transports | 30.69 | 95 | 0.59% | 15.42% |
| CDMO | Avid Bioservices | | Health Care | 8.46 | 95 | 0.59% | 30.15% |
| PEBO | Peoples Bancorp | | Financials | 30.15 | 95 | 0.55% | -10.71% |
| CPF | Central Pacific | | Financials | 21.02 | 95 | 0.55% | 6.78% |
| APOG | Apogee Enterprises | | Industrials | 65.00 | 95 | 0.53% | 21.69% |
| POR | Portland General | | Utilities | 44.53 | 95 | 0.52% | 2.75% |
| EBF | Ennis | | Consumer Staples | 20.44 | 95 | 0.49% | -6.71% |
| SITM | SiTime | | Technology | 97.11 | 95 | 0.48% | -20.46% |
| BKH | Black Hills | | Utilities | 56.73 | 95 | 0.44% | 5.15% |
| NBTB | NBT Bancorp | | Financials | 37.37 | 95 | 0.40% | -10.83% |
| KALU | Kaiser Aluminum | | Materials | 98.17 | 95 | 0.39% | 37.90% |
| UVV | Universal | | Consumer Staples | 53.41 | 95 | 0.38% | -20.66% |
| VSH | Vishay Inter | | Technology | 23.18 | 95 | 0.37% | -3.32% |
| PFBC | Preferred Bank | | Financials | 79.42 | 95 | 0.34% | 8.72% |
| BSRR | Sierra Bancorp | | Financials | 21.39 | 95 | 0.33% | -5.14% |
| AVA | Avista | | Utilities | 37.50 | 95 | 0.32% | 4.92% |
| SKWD | Skyward Specialty | | Financials | 37.61 | 95 | 0.17% | 10.78% |
| AWR | American States | | Utilities | 74.14 | 95 | 0.12% | -7.81% |
| STRA | Strategic Education | | Services & Goods | 123.14 | 95 | 0.11% | 33.31% |
| FCF | First Commonwealth | | Financials | 13.79 | 95 | 0.11% | -10.72% |
| UMBF | UMB Financial | | Financials | 82.20 | 95 | 0.11% | -1.62% |


| Too many stocks? View smallcap stocks filtered by marketcap & sector |
| Marketcap: All SmallCap Stocks (default-no microcap), Large, Mid-Range, Small |
| Smallcap Sector: Tech, Finance, Energy, Staples, Retail, Industrial, Materials, & Medical |
|
Get the most comprehensive stock market coverage daily at 12Stocks.com ➞ Best Stocks Today ➞ Best Stocks Weekly ➞ Best Stocks Year-to-Date ➞ Best Stocks Trends ➞  Best Stocks Today 12Stocks.com Best Nasdaq Stocks ➞ Best S&P 500 Stocks ➞ Best Tech Stocks ➞ Best Biotech Stocks ➞ |
| Detailed Overview of SmallCap Stocks |
| SmallCap Technical Overview, Leaders & Laggards, Top SmallCap ETF Funds & Detailed SmallCap Stocks List, Charts, Trends & More |
| Smallcap: Technical Analysis, Trends & YTD Performance | |
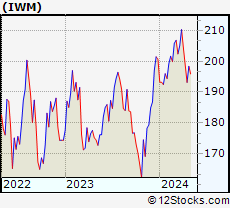
| SmallCap segment as represented by
IWM, an exchange-traded fund [ETF], holds basket of thousands of smallcap stocks from across all major sectors of the US stock market. The smallcap index (contains stocks like Riverbed & Sotheby's) is up by 2.24% and is currently underperforming the overall market by -5.83% year-to-date. Below is a quick view of technical charts and trends: | |
 IWM Weekly Chart |
|
| Long Term Trend: Very Good | |
| Medium Term Trend: Very Good | |
 IWM Daily Chart |
|
| Short Term Trend: Very Good | |
| Overall Trend Score: 87 | |
| YTD Performance: 2.24% | |
| **Trend Scores & Views Are Only For Educational Purposes And Not For Investing | |
| 12Stocks.com: Top Performing Small Cap Index Stocks | ||||||||||||||||||||||||||||||||||||||||||||||||
 The top performing Small Cap Index stocks year to date are
Now, more recently, over last week, the top performing Small Cap Index stocks on the move are


|
||||||||||||||||||||||||||||||||||||||||||||||||
| 12Stocks.com: Investing in Smallcap Index using Exchange Traded Funds | |
|
The following table shows list of key exchange traded funds (ETF) that
help investors track Smallcap index. The following list also includes leveraged ETF funds that track twice or thrice the daily returns of Smallcap indices. Short or inverse ETF funds move in the opposite direction to the index they track and are useful during market pullbacks or during bear markets. Quick View: Move mouse or cursor over ETF symbol (ticker) to view short-term technical chart and over ETF name to view long term chart. Click on ticker or stock name for detailed view. Click on to add stock symbol to your watchlist and to view watchlist. |
12Stocks.com List of ETFs that track Smallcap Index
| Ticker | ETF Name | Watchlist | Recent Price | Smart Investing & Trading Score | Change % | Week % | Year-to-date % |
| IWM | iShares Russell 2000 | | 205.21 | 87 | 0.34 | 1.64 | 2.24% |
| IJR | iShares Core S&P Small-Cap | | 108.92 | 100 | 0.61 | 1.67 | 0.62% |
| VTWO | Vanguard Russell 2000 ETF | | 82.84 | 82 | 0.22 | 1.51 | 2.15% |
| IWN | iShares Russell 2000 Value | | 156.07 | 100 | 0.27 | 1.21 | 0.48% |
| IWO | iShares Russell 2000 Growth | | 262.32 | 69 | 0.50 | 2.12 | 4% |
| IJS | iShares S&P Small-Cap 600 Value | | 100.02 | 82 | 0.27 | 1.32 | -2.96% |
| XSLV | PowerShares S&P SmallCap Low Volatil ETF | | 44.03 | 100 | 1.02 | 1.86 | -0.28% |
| IJT | iShares S&P Small-Cap 600 Growth | | 129.88 | 95 | 0.59 | 1.66 | 3.79% |
| SDD | ProShares UltraShort SmallCap600 | | 18.22 | 10 | -1.10 | -3.33 | -1.13% |
| SAA | ProShares Ultra SmallCap600 | | 24.47 | 95 | 1.49 | 3.73 | -1.92% |
| SMLV | SPDR SSGA US Small Cap Low Volatil ETF | | 110.38 | 82 | -0.19 | 0.63 | -1.9% |
| SBB | ProShares Short SmallCap600 | | 16.04 | 13 | -0.04 | -0.72 | 0.72% |
| 12Stocks.com: Charts, Trends, Fundamental Data and Performances of SmallCap Stocks | |
|
We now take in-depth look at all SmallCap stocks including charts, multi-period performances and overall trends (as measured by Smart Investing & Trading Score). One can sort SmallCap stocks (click link to choose) by Daily, Weekly and by Year-to-Date performances. Also, one can sort by size of the company or by market capitalization. |
| Select Your Default Chart Type: | |||||
| |||||
| Click on stock symbol or name for detailed view. Click on to add stock symbol to your watchlist and to view watchlist. Quick View: Move mouse or cursor over "Daily" to quickly view daily technical stock chart and over "Weekly" to view weekly technical stock chart. | |||||

 | OXM Oxford Industries, Inc. |
| Sector: Consumer Staples | |
| SubSector: Textile - Apparel Clothing | |
| MarketCap: 647.665 Millions | |
| Recent Price: 109.57 Smart Investing & Trading Score: 95 | |
| Day Percent Change: 0.75% Day Change: 0.82 | |
| Week Change: 0.69% Year-to-date Change: 9.6% | |
| OXM Links: Profile News Message Board | |
| Charts:- Daily , Weekly | |
| Add OXM to Watchlist: View: Get Complete OXM Trend Analysis ➞ | |
 | SBRA Sabra Health Care REIT, Inc. |
| Sector: Financials | |
| SubSector: REIT - Healthcare Facilities | |
| MarketCap: 2576.54 Millions | |
| Recent Price: 14.72 Smart Investing & Trading Score: 95 | |
| Day Percent Change: 0.75% Day Change: 0.11 | |
| Week Change: 2.58% Year-to-date Change: 3.2% | |
| SBRA Links: Profile News Message Board | |
| Charts:- Daily , Weekly | |
| Add SBRA to Watchlist: View: Get Complete SBRA Trend Analysis ➞ | |
 | HLNE Hamilton Lane Incorporated |
| Sector: Financials | |
| SubSector: Asset Management | |
| MarketCap: 2484.13 Millions | |
| Recent Price: 118.62 Smart Investing & Trading Score: 95 | |
| Day Percent Change: 0.69% Day Change: 0.81 | |
| Week Change: 2.55% Year-to-date Change: 4.6% | |
| HLNE Links: Profile News Message Board | |
| Charts:- Daily , Weekly | |
| Add HLNE to Watchlist: View: Get Complete HLNE Trend Analysis ➞ | |
 | CVCO Cavco Industries, Inc. |
| Sector: Industrials | |
| SubSector: Residential Construction | |
| MarketCap: 1375.86 Millions | |
| Recent Price: 384.08 Smart Investing & Trading Score: 95 | |
| Day Percent Change: 0.67% Day Change: 2.55 | |
| Week Change: 1.8% Year-to-date Change: 10.8% | |
| CVCO Links: Profile News Message Board | |
| Charts:- Daily , Weekly | |
| Add CVCO to Watchlist: View: Get Complete CVCO Trend Analysis ➞ | |
 | TRN Trinity Industries, Inc. |
| Sector: Transports | |
| SubSector: Railroads | |
| MarketCap: 2058.22 Millions | |
| Recent Price: 30.69 Smart Investing & Trading Score: 95 | |
| Day Percent Change: 0.59% Day Change: 0.18 | |
| Week Change: 0.82% Year-to-date Change: 15.4% | |
| TRN Links: Profile News Message Board | |
| Charts:- Daily , Weekly | |
| Add TRN to Watchlist: View: Get Complete TRN Trend Analysis ➞ | |
 | CDMO Avid Bioservices, Inc. |
| Sector: Health Care | |
| SubSector: Biotechnology | |
| MarketCap: 203.685 Millions | |
| Recent Price: 8.46 Smart Investing & Trading Score: 95 | |
| Day Percent Change: 0.59% Day Change: 0.05 | |
| Week Change: 2.55% Year-to-date Change: 30.2% | |
| CDMO Links: Profile News Message Board | |
| Charts:- Daily , Weekly | |
| Add CDMO to Watchlist: View: Get Complete CDMO Trend Analysis ➞ | |
 | PEBO Peoples Bancorp Inc. |
| Sector: Financials | |
| SubSector: Regional - Midwest Banks | |
| MarketCap: 449.77 Millions | |
| Recent Price: 30.15 Smart Investing & Trading Score: 95 | |
| Day Percent Change: 0.55% Day Change: 0.16 | |
| Week Change: 0.55% Year-to-date Change: -10.7% | |
| PEBO Links: Profile News Message Board | |
| Charts:- Daily , Weekly | |
| Add PEBO to Watchlist: View: Get Complete PEBO Trend Analysis ➞ | |
 | CPF Central Pacific Financial Corp. |
| Sector: Financials | |
| SubSector: Regional - Pacific Banks | |
| MarketCap: 407.429 Millions | |
| Recent Price: 21.02 Smart Investing & Trading Score: 95 | |
| Day Percent Change: 0.55% Day Change: 0.12 | |
| Week Change: 0.79% Year-to-date Change: 6.8% | |
| CPF Links: Profile News Message Board | |
| Charts:- Daily , Weekly | |
| Add CPF to Watchlist: View: Get Complete CPF Trend Analysis ➞ | |
 | APOG Apogee Enterprises, Inc. |
| Sector: Industrials | |
| SubSector: General Building Materials | |
| MarketCap: 510.653 Millions | |
| Recent Price: 65.00 Smart Investing & Trading Score: 95 | |
| Day Percent Change: 0.53% Day Change: 0.34 | |
| Week Change: 2.29% Year-to-date Change: 21.7% | |
| APOG Links: Profile News Message Board | |
| Charts:- Daily , Weekly | |
| Add APOG to Watchlist: View: Get Complete APOG Trend Analysis ➞ | |
 | POR Portland General Electric Company |
| Sector: Utilities | |
| SubSector: Electric Utilities | |
| MarketCap: 4291.84 Millions | |
| Recent Price: 44.53 Smart Investing & Trading Score: 95 | |
| Day Percent Change: 0.52% Day Change: 0.23 | |
| Week Change: 1.74% Year-to-date Change: 2.8% | |
| POR Links: Profile News Message Board | |
| Charts:- Daily , Weekly | |
| Add POR to Watchlist: View: Get Complete POR Trend Analysis ➞ | |
 | EBF Ennis, Inc. |
| Sector: Consumer Staples | |
| SubSector: Office Supplies | |
| MarketCap: 464.5 Millions | |
| Recent Price: 20.44 Smart Investing & Trading Score: 95 | |
| Day Percent Change: 0.49% Day Change: 0.10 | |
| Week Change: 0.89% Year-to-date Change: -6.7% | |
| EBF Links: Profile News Message Board | |
| Charts:- Daily , Weekly | |
| Add EBF to Watchlist: View: Get Complete EBF Trend Analysis ➞ | |
 | SITM SiTime Corporation |
| Sector: Technology | |
| SubSector: Semiconductor - Specialized | |
| MarketCap: 403.76 Millions | |
| Recent Price: 97.11 Smart Investing & Trading Score: 95 | |
| Day Percent Change: 0.48% Day Change: 0.47 | |
| Week Change: 5.26% Year-to-date Change: -20.5% | |
| SITM Links: Profile News Message Board | |
| Charts:- Daily , Weekly | |
| Add SITM to Watchlist: View: Get Complete SITM Trend Analysis ➞ | |
 | BKH Black Hills Corporation |
| Sector: Utilities | |
| SubSector: Electric Utilities | |
| MarketCap: 3666.94 Millions | |
| Recent Price: 56.73 Smart Investing & Trading Score: 95 | |
| Day Percent Change: 0.44% Day Change: 0.25 | |
| Week Change: 1.72% Year-to-date Change: 5.2% | |
| BKH Links: Profile News Message Board | |
| Charts:- Daily , Weekly | |
| Add BKH to Watchlist: View: Get Complete BKH Trend Analysis ➞ | |
 | NBTB NBT Bancorp Inc. |
| Sector: Financials | |
| SubSector: Regional - Northeast Banks | |
| MarketCap: 1451.89 Millions | |
| Recent Price: 37.37 Smart Investing & Trading Score: 95 | |
| Day Percent Change: 0.40% Day Change: 0.15 | |
| Week Change: 1.3% Year-to-date Change: -10.8% | |
| NBTB Links: Profile News Message Board | |
| Charts:- Daily , Weekly | |
| Add NBTB to Watchlist: View: Get Complete NBTB Trend Analysis ➞ | |
 | KALU Kaiser Aluminum Corporation |
| Sector: Materials | |
| SubSector: Aluminum | |
| MarketCap: 969.808 Millions | |
| Recent Price: 98.17 Smart Investing & Trading Score: 95 | |
| Day Percent Change: 0.39% Day Change: 0.38 | |
| Week Change: 2.14% Year-to-date Change: 37.9% | |
| KALU Links: Profile News Message Board | |
| Charts:- Daily , Weekly | |
| Add KALU to Watchlist: View: Get Complete KALU Trend Analysis ➞ | |
 | UVV Universal Corporation |
| Sector: Consumer Staples | |
| SubSector: Tobacco Products, Other | |
| MarketCap: 1107.7 Millions | |
| Recent Price: 53.41 Smart Investing & Trading Score: 95 | |
| Day Percent Change: 0.38% Day Change: 0.20 | |
| Week Change: 0.04% Year-to-date Change: -20.7% | |
| UVV Links: Profile News Message Board | |
| Charts:- Daily , Weekly | |
| Add UVV to Watchlist: View: Get Complete UVV Trend Analysis ➞ | |
 | VSH Vishay Intertechnology, Inc. |
| Sector: Technology | |
| SubSector: Semiconductor - Broad Line | |
| MarketCap: 2132.52 Millions | |
| Recent Price: 23.18 Smart Investing & Trading Score: 95 | |
| Day Percent Change: 0.37% Day Change: 0.09 | |
| Week Change: 1.78% Year-to-date Change: -3.3% | |
| VSH Links: Profile News Message Board | |
| Charts:- Daily , Weekly | |
| Add VSH to Watchlist: View: Get Complete VSH Trend Analysis ➞ | |
 | PFBC Preferred Bank |
| Sector: Financials | |
| SubSector: Regional - Pacific Banks | |
| MarketCap: 559.629 Millions | |
| Recent Price: 79.42 Smart Investing & Trading Score: 95 | |
| Day Percent Change: 0.34% Day Change: 0.27 | |
| Week Change: 0.06% Year-to-date Change: 8.7% | |
| PFBC Links: Profile News Message Board | |
| Charts:- Daily , Weekly | |
| Add PFBC to Watchlist: View: Get Complete PFBC Trend Analysis ➞ | |
 | BSRR Sierra Bancorp |
| Sector: Financials | |
| SubSector: Regional - Pacific Banks | |
| MarketCap: 256.929 Millions | |
| Recent Price: 21.39 Smart Investing & Trading Score: 95 | |
| Day Percent Change: 0.33% Day Change: 0.07 | |
| Week Change: 2.59% Year-to-date Change: -5.1% | |
| BSRR Links: Profile News Message Board | |
| Charts:- Daily , Weekly | |
| Add BSRR to Watchlist: View: Get Complete BSRR Trend Analysis ➞ | |
 | AVA Avista Corporation |
| Sector: Utilities | |
| SubSector: Diversified Utilities | |
| MarketCap: 2755.7 Millions | |
| Recent Price: 37.50 Smart Investing & Trading Score: 95 | |
| Day Percent Change: 0.32% Day Change: 0.12 | |
| Week Change: 0.54% Year-to-date Change: 4.9% | |
| AVA Links: Profile News Message Board | |
| Charts:- Daily , Weekly | |
| Add AVA to Watchlist: View: Get Complete AVA Trend Analysis ➞ | |
 | SKWD Skyward Specialty Insurance Group, Inc. |
| Sector: Financials | |
| SubSector: Insurance - Property & Casualty | |
| MarketCap: 936 Millions | |
| Recent Price: 37.61 Smart Investing & Trading Score: 95 | |
| Day Percent Change: 0.17% Day Change: 0.06 | |
| Week Change: 2.69% Year-to-date Change: 10.8% | |
| SKWD Links: Profile News Message Board | |
| Charts:- Daily , Weekly | |
| Add SKWD to Watchlist: View: Get Complete SKWD Trend Analysis ➞ | |
 | AWR American States Water Company |
| Sector: Utilities | |
| SubSector: Water Utilities | |
| MarketCap: 3519.12 Millions | |
| Recent Price: 74.14 Smart Investing & Trading Score: 95 | |
| Day Percent Change: 0.12% Day Change: 0.09 | |
| Week Change: 0.83% Year-to-date Change: -7.8% | |
| AWR Links: Profile News Message Board | |
| Charts:- Daily , Weekly | |
| Add AWR to Watchlist: View: Get Complete AWR Trend Analysis ➞ | |
 | STRA Strategic Education, Inc. |
| Sector: Services & Goods | |
| SubSector: Education & Training Services | |
| MarketCap: 2621.56 Millions | |
| Recent Price: 123.14 Smart Investing & Trading Score: 95 | |
| Day Percent Change: 0.11% Day Change: 0.14 | |
| Week Change: 2.06% Year-to-date Change: 33.3% | |
| STRA Links: Profile News Message Board | |
| Charts:- Daily , Weekly | |
| Add STRA to Watchlist: View: Get Complete STRA Trend Analysis ➞ | |
 | FCF First Commonwealth Financial Corporation |
| Sector: Financials | |
| SubSector: Regional - Northeast Banks | |
| MarketCap: 900.299 Millions | |
| Recent Price: 13.79 Smart Investing & Trading Score: 95 | |
| Day Percent Change: 0.11% Day Change: 0.02 | |
| Week Change: 0.84% Year-to-date Change: -10.7% | |
| FCF Links: Profile News Message Board | |
| Charts:- Daily , Weekly | |
| Add FCF to Watchlist: View: Get Complete FCF Trend Analysis ➞ | |
 | UMBF UMB Financial Corporation |
| Sector: Financials | |
| SubSector: Regional - Southwest Banks | |
| MarketCap: 2207.35 Millions | |
| Recent Price: 82.20 Smart Investing & Trading Score: 95 | |
| Day Percent Change: 0.11% Day Change: 0.09 | |
| Week Change: -0.44% Year-to-date Change: -1.6% | |
| UMBF Links: Profile News Message Board | |
| Charts:- Daily , Weekly | |
| Add UMBF to Watchlist: View: Get Complete UMBF Trend Analysis ➞ | |
| Too many stocks? View smallcap stocks filtered by marketcap & sector |
| Marketcap: All SmallCap Stocks (default-no microcap), Large, Mid-Range, Small & MicroCap |
| Sector: Tech, Finance, Energy, Staples, Retail, Industrial, Materials, Utilities & Medical |
|
Best Stocks Today 12Stocks.com |
© 2024 12Stocks.com Terms & Conditions Privacy Contact Us
All Information Provided Only For Education And Not To Be Used For Investing or Trading. See Terms & Conditions


One More Thing ... Get Best Stocks Delivered Daily!
Never Ever Miss A Move With Our Top Ten Stocks Lists
Find Best Stocks In Any Market - Bull or Bear Market
Take A Peek At Our Top Ten Stocks Lists: Daily, Weekly, Year-to-Date & Top Trends
Find Best Stocks In Any Market - Bull or Bear Market
Take A Peek At Our Top Ten Stocks Lists: Daily, Weekly, Year-to-Date & Top Trends
Smallcap Stocks With Best Up Trends [0-bearish to 100-bullish]: Design [100], Origin Materials[100], Ambac Financial[100], Coca-Cola Consolidated[100], Zeta Global[100], EverQuote [100], Sterling Construction[100], J & J Snack Foods[100], Summit [100], Bandwidth [100], Vanda [100]
Best Smallcap Stocks Year-to-Date:
Janux [473.85%], Viking [322.84%], Longboard [262.68%], Alpine Immune[239.34%], Bakkt [228.25%], Super Micro[187.4%], Cullinan Oncology[185.34%], Vera [181.98%], Avidity Biosciences[176.83%], Y-mAbs [155.72%], Arcutis Bio[146.44%] Best Smallcap Stocks This Week:
Perficient [52.43%], Thoughtworks Holding[35.11%], Trupanion [28.46%], DASAN Zhone[26.29%], Great Lakes[25%], Lineage Cell[24.06%], Workhorse Group[23.69%], Ambac Financial[23.52%], Bandwidth [22.95%], Aceto [22.07%], P3 Health[21.66%] Best Smallcap Stocks Daily:
Design [25.96%], Great Lakes[23.58%], Thoughtworks Holding[20.63%], Origin Materials[20.53%], Ambac Financial[19.84%], Coca-Cola Consolidated[18.33%], Zeta Global[18.28%], EverQuote [18.19%], Children s[16.19%], Sterling Construction[16.02%], J & J Snack Foods[15.85%]