
 Login Sign Up


| |||||
 |  | ||||

| 12Stocks.com Market Intelligence |
Best SmallCap Stocks
|
| In a hurry? Small Cap Stock Lists: Performance Trends Table, Stock Charts
Sort Small Cap stocks: Daily, Weekly, Year-to-Date, Market Cap & Trends. Filter Small Cap stocks list by sector: Show all, Tech, Finance, Energy, Staples, Retail, Industrial, Materials, Utilities and HealthCare Filter Small Cap stocks list by size: All Large Medium Small and MicroCap |
| 12Stocks.com Small Cap Stocks Performances & Trends Daily | |||||||||
|
|  The overall Smart Investing & Trading Score is 58 (0-bearish to 100-bullish) which puts Small Cap index in short term neutral trend. The Smart Investing & Trading Score from previous trading session is 63 and hence a deterioration of trend.
| ||||||||
Here are the Smart Investing & Trading Scores of the most requested small cap stocks at 12Stocks.com (click stock name for detailed review):
|


| 12Stocks.com: Investing in Smallcap Index with Stocks | |
|
The following table helps investors and traders sort through current performance and trends (as measured by Smart Investing & Trading Score) of various
stocks in the Smallcap Index. Quick View: Move mouse or cursor over stock symbol (ticker) to view short-term technical chart and over stock name to view long term chart. Click on  to add stock symbol to your watchlist and to add stock symbol to your watchlist and  to view watchlist. Click on any ticker or stock name for detailed market intelligence report for that stock. to view watchlist. Click on any ticker or stock name for detailed market intelligence report for that stock. |
12Stocks.com Performance of Stocks in Smallcap Index
| Ticker | Stock Name | Watchlist | Category | Recent Price | Smart Investing & Trading Score | Change % | YTD Change% |
| LGND | Ligand |   | Health Care | 71.00 | 20 | 1.59% | -0.59% |
| ZIP | ZipRecruiter | | Industrials | 10.51 | 20 | 0.82% | -25.04% |
| NEWT | Newtek Business | | Services & Goods | 11.00 | 20 | 0.46% | -20.29% |
| STNE | StoneCo | | Technology | 15.83 | 20 | 0.32% | -12.20% |
| NAT | Nordic American | | Transports | 3.79 | 20 | 0.26% | -9.76% |
| PRTA | Prothena | | Health Care | 20.56 | 20 | 0.00% | -43.42% |
| CWK | Cushman & Wakefield | | Financials | 9.63 | 20 | 0.00% | -10.83% |
| FGEN | FibroGen | | Health Care | 0.98 | 20 | -8.01% | 11.06% |
| SCLX | Scilex Holding | | Health Care | 0.91 | 20 | -7.61% | -53.62% |
| STRO | Sutro Biopharma | | Health Care | 3.47 | 20 | -6.72% | -19.11% |
| EYE | National Vision | | Services & Goods | 17.73 | 20 | -5.89% | -15.29% |
| AMPX | Amprius | | Industrials | 1.65 | 20 | -5.71% | -67.07% |
| GNLX | Genelux | | Health Care | 3.30 | 20 | -5.31% | -78.32% |
| BFLY | Butterfly | | Health Care | 0.71 | 20 | -4.74% | -37.45% |
| TPIC | TPI Composites | | Industrials | 2.47 | 20 | -4.63% | -40.34% |
| CCO | Clear Channel | | Services & Goods | 1.44 | 20 | -4.00% | -20.88% |
| OOMA | Ooma | | Technology | 6.71 | 20 | -3.80% | -37.47% |
| LAW | CS Disco | | Technology | 7.44 | 20 | -3.75% | -2.62% |
| VLD | Velo3D | | Technology | 0.24 | 20 | -3.72% | -40.04% |
| AKRO | Akero | | Health Care | 20.26 | 20 | -3.52% | -13.23% |
| FOSL | Fossil Group | | Consumer Staples | 0.81 | 20 | -3.42% | -44.66% |
| PIII | P3 Health | | Health Care | 0.50 | 20 | -3.02% | -66.11% |
| ALLK | Allakos | | Health Care | 1.02 | 20 | -2.86% | -62.64% |
| RAMP | LiveRamp | | Technology | 32.36 | 20 | -2.50% | -14.57% |
| RVNC | Revance | | Health Care | 3.57 | 20 | -2.46% | -59.39% |


| Too many stocks? View smallcap stocks filtered by marketcap & sector |
| Marketcap: All SmallCap Stocks (default-no microcap), Large, Mid-Range, Small |
| Smallcap Sector: Tech, Finance, Energy, Staples, Retail, Industrial, Materials, & Medical |
|
Get the most comprehensive stock market coverage daily at 12Stocks.com ➞ Best Stocks Today ➞ Best Stocks Weekly ➞ Best Stocks Year-to-Date ➞ Best Stocks Trends ➞  Best Stocks Today 12Stocks.com Best Nasdaq Stocks ➞ Best S&P 500 Stocks ➞ Best Tech Stocks ➞ Best Biotech Stocks ➞ |
| Detailed Overview of SmallCap Stocks |
| SmallCap Technical Overview, Leaders & Laggards, Top SmallCap ETF Funds & Detailed SmallCap Stocks List, Charts, Trends & More |
| Smallcap: Technical Analysis, Trends & YTD Performance | |
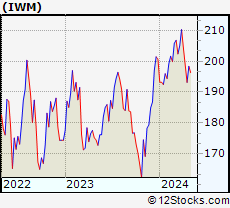
| SmallCap segment as represented by
IWM, an exchange-traded fund [ETF], holds basket of thousands of smallcap stocks from across all major sectors of the US stock market. The smallcap index (contains stocks like Riverbed & Sotheby's) is down by -1.51% and is currently underperforming the overall market by -7.17% year-to-date. Below is a quick view of technical charts and trends: | |
 IWM Weekly Chart |
|
| Long Term Trend: Good | |
| Medium Term Trend: Not Good | |
 IWM Daily Chart |
|
| Short Term Trend: Very Good | |
| Overall Trend Score: 58 | |
| YTD Performance: -1.51% | |
| **Trend Scores & Views Are Only For Educational Purposes And Not For Investing | |
| 12Stocks.com: Top Performing Small Cap Index Stocks | ||||||||||||||||||||||||||||||||||||||||||||||||
 The top performing Small Cap Index stocks year to date are
Now, more recently, over last week, the top performing Small Cap Index stocks on the move are


|
||||||||||||||||||||||||||||||||||||||||||||||||
| 12Stocks.com: Investing in Smallcap Index using Exchange Traded Funds | |
|
The following table shows list of key exchange traded funds (ETF) that
help investors track Smallcap index. The following list also includes leveraged ETF funds that track twice or thrice the daily returns of Smallcap indices. Short or inverse ETF funds move in the opposite direction to the index they track and are useful during market pullbacks or during bear markets. Quick View: Move mouse or cursor over ETF symbol (ticker) to view short-term technical chart and over ETF name to view long term chart. Click on ticker or stock name for detailed view. Click on to add stock symbol to your watchlist and to view watchlist. |
12Stocks.com List of ETFs that track Smallcap Index
| Ticker | ETF Name | Watchlist | Recent Price | Smart Investing & Trading Score | Change % | Week % | Year-to-date % |
| IWM | iShares Russell 2000 | | 197.68 | 58 | -0.45 | 2.35 | -1.51% |
| IJR | iShares Core S&P Small-Cap | | 105.71 | 85 | -0.24 | 2.41 | -2.35% |
| VTWO | Vanguard Russell 2000 ETF | | 79.93 | 48 | -0.45 | 2.37 | -1.44% |
| IWN | iShares Russell 2000 Value | | 151.28 | 75 | -0.30 | 2.37 | -2.61% |
| IWO | iShares Russell 2000 Growth | | 251.27 | 58 | -0.44 | 2.44 | -0.38% |
| IJS | iShares S&P Small-Cap 600 Value | | 97.71 | 45 | -0.43 | 2.2 | -5.2% |
| IJT | iShares S&P Small-Cap 600 Growth | | 125.37 | 48 | -0.28 | 2.59 | 0.18% |
| XSLV | PowerShares S&P SmallCap Low Volatil ETF | | 42.94 | 48 | -0.26 | 1.8 | -2.74% |
| SBB | ProShares Short SmallCap600 | | 16.37 | 33 | -0.02 | -2.79 | 2.76% |
| SMLV | SPDR SSGA US Small Cap Low Volatil ETF | | 108.43 | 73 | -0.31 | 2.21 | -3.63% |
| SAA | ProShares Ultra SmallCap600 | | 23.01 | 58 | -0.60 | 5.55 | -7.78% |
| SDD | ProShares UltraShort SmallCap600 | | 19.49 | 42 | 1.35 | -4.18 | 5.77% |
| 12Stocks.com: Charts, Trends, Fundamental Data and Performances of SmallCap Stocks | |
|
We now take in-depth look at all SmallCap stocks including charts, multi-period performances and overall trends (as measured by Smart Investing & Trading Score). One can sort SmallCap stocks (click link to choose) by Daily, Weekly and by Year-to-Date performances. Also, one can sort by size of the company or by market capitalization. |
| Select Your Default Chart Type: | |||||
| |||||
| Click on stock symbol or name for detailed view. Click on to add stock symbol to your watchlist and to view watchlist. Quick View: Move mouse or cursor over "Daily" to quickly view daily technical stock chart and over "Weekly" to view weekly technical stock chart. | |||||

 | LGND Ligand Pharmaceuticals Incorporated |
| Sector: Health Care | |
| SubSector: Biotechnology | |
| MarketCap: 1344.45 Millions | |
| Recent Price: 71.00 Smart Investing & Trading Score: 20 | |
| Day Percent Change: 1.59% Day Change: 1.11 | |
| Week Change: -2.03% Year-to-date Change: -0.6% | |
| LGND Links: Profile News Message Board | |
| Charts:- Daily , Weekly | |
| Add LGND to Watchlist: View: Get Complete LGND Trend Analysis ➞ | |
 | ZIP ZipRecruiter, Inc. |
| Sector: Industrials | |
| SubSector: Staffing & Employment Services | |
| MarketCap: 1730 Millions | |
| Recent Price: 10.51 Smart Investing & Trading Score: 20 | |
| Day Percent Change: 0.82% Day Change: 0.09 | |
| Week Change: -0.14% Year-to-date Change: -25.0% | |
| ZIP Links: Profile News Message Board | |
| Charts:- Daily , Weekly | |
| Add ZIP to Watchlist: View: Get Complete ZIP Trend Analysis ➞ | |
 | NEWT Newtek Business Services Corp. |
| Sector: Services & Goods | |
| SubSector: Business Services | |
| MarketCap: 243.982 Millions | |
| Recent Price: 11.00 Smart Investing & Trading Score: 20 | |
| Day Percent Change: 0.46% Day Change: 0.05 | |
| Week Change: 0.92% Year-to-date Change: -20.3% | |
| NEWT Links: Profile News Message Board | |
| Charts:- Daily , Weekly | |
| Add NEWT to Watchlist: View: Get Complete NEWT Trend Analysis ➞ | |
 | STNE StoneCo Ltd. |
| Sector: Technology | |
| SubSector: Application Software | |
| MarketCap: 7347.82 Millions | |
| Recent Price: 15.83 Smart Investing & Trading Score: 20 | |
| Day Percent Change: 0.32% Day Change: 0.05 | |
| Week Change: 3.46% Year-to-date Change: -12.2% | |
| STNE Links: Profile News Message Board | |
| Charts:- Daily , Weekly | |
| Add STNE to Watchlist: View: Get Complete STNE Trend Analysis ➞ | |
 | NAT Nordic American Tankers Limited |
| Sector: Transports | |
| SubSector: Shipping | |
| MarketCap: 416.114 Millions | |
| Recent Price: 3.79 Smart Investing & Trading Score: 20 | |
| Day Percent Change: 0.26% Day Change: 0.01 | |
| Week Change: -0.26% Year-to-date Change: -9.8% | |
| NAT Links: Profile News Message Board | |
| Charts:- Daily , Weekly | |
| Add NAT to Watchlist: View: Get Complete NAT Trend Analysis ➞ | |
 | PRTA Prothena Corporation plc |
| Sector: Health Care | |
| SubSector: Biotechnology | |
| MarketCap: 357.985 Millions | |
| Recent Price: 20.56 Smart Investing & Trading Score: 20 | |
| Day Percent Change: 0.00% Day Change: 0.00 | |
| Week Change: -2.84% Year-to-date Change: -43.4% | |
| PRTA Links: Profile News Message Board | |
| Charts:- Daily , Weekly | |
| Add PRTA to Watchlist: View: Get Complete PRTA Trend Analysis ➞ | |
 | CWK Cushman & Wakefield plc |
| Sector: Financials | |
| SubSector: Property Management | |
| MarketCap: 2651.62 Millions | |
| Recent Price: 9.63 Smart Investing & Trading Score: 20 | |
| Day Percent Change: 0.00% Day Change: 0.00 | |
| Week Change: 3.22% Year-to-date Change: -10.8% | |
| CWK Links: Profile News Message Board | |
| Charts:- Daily , Weekly | |
| Add CWK to Watchlist: View: Get Complete CWK Trend Analysis ➞ | |
 | FGEN FibroGen, Inc. |
| Sector: Health Care | |
| SubSector: Biotechnology | |
| MarketCap: 2502.95 Millions | |
| Recent Price: 0.98 Smart Investing & Trading Score: 20 | |
| Day Percent Change: -8.01% Day Change: -0.09 | |
| Week Change: -14.41% Year-to-date Change: 11.1% | |
| FGEN Links: Profile News Message Board | |
| Charts:- Daily , Weekly | |
| Add FGEN to Watchlist: View: Get Complete FGEN Trend Analysis ➞ | |
 | SCLX Scilex Holding Company |
| Sector: Health Care | |
| SubSector: Drug Manufacturers - General | |
| MarketCap: 927 Millions | |
| Recent Price: 0.91 Smart Investing & Trading Score: 20 | |
| Day Percent Change: -7.61% Day Change: -0.07 | |
| Week Change: 1.26% Year-to-date Change: -53.6% | |
| SCLX Links: Profile News Message Board | |
| Charts:- Daily , Weekly | |
| Add SCLX to Watchlist: View: Get Complete SCLX Trend Analysis ➞ | |
 | STRO Sutro Biopharma, Inc. |
| Sector: Health Care | |
| SubSector: Biotechnology | |
| MarketCap: 196.485 Millions | |
| Recent Price: 3.47 Smart Investing & Trading Score: 20 | |
| Day Percent Change: -6.72% Day Change: -0.25 | |
| Week Change: -4.54% Year-to-date Change: -19.1% | |
| STRO Links: Profile News Message Board | |
| Charts:- Daily , Weekly | |
| Add STRO to Watchlist: View: Get Complete STRO Trend Analysis ➞ | |
 | EYE National Vision Holdings, Inc. |
| Sector: Services & Goods | |
| SubSector: Specialty Retail, Other | |
| MarketCap: 1290.84 Millions | |
| Recent Price: 17.73 Smart Investing & Trading Score: 20 | |
| Day Percent Change: -5.89% Day Change: -1.11 | |
| Week Change: -5.69% Year-to-date Change: -15.3% | |
| EYE Links: Profile News Message Board | |
| Charts:- Daily , Weekly | |
| Add EYE to Watchlist: View: Get Complete EYE Trend Analysis ➞ | |
 | AMPX Amprius Technologies, Inc. |
| Sector: Industrials | |
| SubSector: Electrical Equipment & Parts | |
| MarketCap: 608 Millions | |
| Recent Price: 1.65 Smart Investing & Trading Score: 20 | |
| Day Percent Change: -5.71% Day Change: -0.10 | |
| Week Change: -6.25% Year-to-date Change: -67.1% | |
| AMPX Links: Profile News Message Board | |
| Charts:- Daily , Weekly | |
| Add AMPX to Watchlist: View: Get Complete AMPX Trend Analysis ➞ | |
 | GNLX Genelux Corporation |
| Sector: Health Care | |
| SubSector: Biotechnology | |
| MarketCap: 820 Millions | |
| Recent Price: 3.30 Smart Investing & Trading Score: 20 | |
| Day Percent Change: -5.31% Day Change: -0.19 | |
| Week Change: -20.1% Year-to-date Change: -78.3% | |
| GNLX Links: Profile News Message Board | |
| Charts:- Daily , Weekly | |
| Add GNLX to Watchlist: View: Get Complete GNLX Trend Analysis ➞ | |
 | BFLY Butterfly Network, Inc. |
| Sector: Health Care | |
| SubSector: Medical Devices | |
| MarketCap: 461 Millions | |
| Recent Price: 0.71 Smart Investing & Trading Score: 20 | |
| Day Percent Change: -4.74% Day Change: -0.04 | |
| Week Change: -7.56% Year-to-date Change: -37.5% | |
| BFLY Links: Profile News Message Board | |
| Charts:- Daily , Weekly | |
| Add BFLY to Watchlist: View: Get Complete BFLY Trend Analysis ➞ | |
 | TPIC TPI Composites, Inc. |
| Sector: Industrials | |
| SubSector: Diversified Machinery | |
| MarketCap: 451.016 Millions | |
| Recent Price: 2.47 Smart Investing & Trading Score: 20 | |
| Day Percent Change: -4.63% Day Change: -0.12 | |
| Week Change: -7.84% Year-to-date Change: -40.3% | |
| TPIC Links: Profile News Message Board | |
| Charts:- Daily , Weekly | |
| Add TPIC to Watchlist: View: Get Complete TPIC Trend Analysis ➞ | |
 | CCO Clear Channel Outdoor Holdings, Inc. |
| Sector: Services & Goods | |
| SubSector: Marketing Services | |
| MarketCap: 312.715 Millions | |
| Recent Price: 1.44 Smart Investing & Trading Score: 20 | |
| Day Percent Change: -4.00% Day Change: -0.06 | |
| Week Change: -3.36% Year-to-date Change: -20.9% | |
| CCO Links: Profile News Message Board | |
| Charts:- Daily , Weekly | |
| Add CCO to Watchlist: View: Get Complete CCO Trend Analysis ➞ | |
 | OOMA Ooma, Inc. |
| Sector: Technology | |
| SubSector: Diversified Communication Services | |
| MarketCap: 222.064 Millions | |
| Recent Price: 6.71 Smart Investing & Trading Score: 20 | |
| Day Percent Change: -3.80% Day Change: -0.26 | |
| Week Change: -4.96% Year-to-date Change: -37.5% | |
| OOMA Links: Profile News Message Board | |
| Charts:- Daily , Weekly | |
| Add OOMA to Watchlist: View: Get Complete OOMA Trend Analysis ➞ | |
 | LAW CS Disco, Inc. |
| Sector: Technology | |
| SubSector: Software - Application | |
| MarketCap: 505 Millions | |
| Recent Price: 7.44 Smart Investing & Trading Score: 20 | |
| Day Percent Change: -3.75% Day Change: -0.29 | |
| Week Change: -0.4% Year-to-date Change: -2.6% | |
| LAW Links: Profile News Message Board | |
| Charts:- Daily , Weekly | |
| Add LAW to Watchlist: View: Get Complete LAW Trend Analysis ➞ | |
 | VLD Velo3D, Inc. |
| Sector: Technology | |
| SubSector: Computer Hardware | |
| MarketCap: 404 Millions | |
| Recent Price: 0.24 Smart Investing & Trading Score: 20 | |
| Day Percent Change: -3.72% Day Change: -0.01 | |
| Week Change: -5.84% Year-to-date Change: -40.0% | |
| VLD Links: Profile News Message Board | |
| Charts:- Daily , Weekly | |
| Add VLD to Watchlist: View: Get Complete VLD Trend Analysis ➞ | |
 | AKRO Akero Therapeutics, Inc. |
| Sector: Health Care | |
| SubSector: Biotechnology | |
| MarketCap: 675.085 Millions | |
| Recent Price: 20.26 Smart Investing & Trading Score: 20 | |
| Day Percent Change: -3.52% Day Change: -0.74 | |
| Week Change: -2.41% Year-to-date Change: -13.2% | |
| AKRO Links: Profile News Message Board | |
| Charts:- Daily , Weekly | |
| Add AKRO to Watchlist: View: Get Complete AKRO Trend Analysis ➞ | |
 | FOSL Fossil Group, Inc. |
| Sector: Consumer Staples | |
| SubSector: Textile - Apparel Footwear & Accessories | |
| MarketCap: 215.87 Millions | |
| Recent Price: 0.81 Smart Investing & Trading Score: 20 | |
| Day Percent Change: -3.42% Day Change: -0.03 | |
| Week Change: -4.98% Year-to-date Change: -44.7% | |
| FOSL Links: Profile News Message Board | |
| Charts:- Daily , Weekly | |
| Add FOSL to Watchlist: View: Get Complete FOSL Trend Analysis ➞ | |
 | PIII P3 Health Partners Inc. |
| Sector: Health Care | |
| SubSector: Medical Care Facilities | |
| MarketCap: 944 Millions | |
| Recent Price: 0.50 Smart Investing & Trading Score: 20 | |
| Day Percent Change: -3.02% Day Change: -0.02 | |
| Week Change: -0.81% Year-to-date Change: -66.1% | |
| PIII Links: Profile News Message Board | |
| Charts:- Daily , Weekly | |
| Add PIII to Watchlist: View: Get Complete PIII Trend Analysis ➞ | |
 | ALLK Allakos Inc. |
| Sector: Health Care | |
| SubSector: Biotechnology | |
| MarketCap: 3233.55 Millions | |
| Recent Price: 1.02 Smart Investing & Trading Score: 20 | |
| Day Percent Change: -2.86% Day Change: -0.03 | |
| Week Change: -4.23% Year-to-date Change: -62.6% | |
| ALLK Links: Profile News Message Board | |
| Charts:- Daily , Weekly | |
| Add ALLK to Watchlist: View: Get Complete ALLK Trend Analysis ➞ | |
 | RAMP LiveRamp Holdings, Inc. |
| Sector: Technology | |
| SubSector: Information Technology Services | |
| MarketCap: 2124.38 Millions | |
| Recent Price: 32.36 Smart Investing & Trading Score: 20 | |
| Day Percent Change: -2.50% Day Change: -0.83 | |
| Week Change: 0.9% Year-to-date Change: -14.6% | |
| RAMP Links: Profile News Message Board | |
| Charts:- Daily , Weekly | |
| Add RAMP to Watchlist: View: Get Complete RAMP Trend Analysis ➞ | |
 | RVNC Revance Therapeutics, Inc. |
| Sector: Health Care | |
| SubSector: Biotechnology | |
| MarketCap: 854.185 Millions | |
| Recent Price: 3.57 Smart Investing & Trading Score: 20 | |
| Day Percent Change: -2.46% Day Change: -0.09 | |
| Week Change: -5.56% Year-to-date Change: -59.4% | |
| RVNC Links: Profile News Message Board | |
| Charts:- Daily , Weekly | |
| Add RVNC to Watchlist: View: Get Complete RVNC Trend Analysis ➞ | |
| Too many stocks? View smallcap stocks filtered by marketcap & sector |
| Marketcap: All SmallCap Stocks (default-no microcap), Large, Mid-Range, Small & MicroCap |
| Sector: Tech, Finance, Energy, Staples, Retail, Industrial, Materials, Utilities & Medical |
|
Best Stocks Today 12Stocks.com |
© 2024 12Stocks.com Terms & Conditions Privacy Contact Us
All Information Provided Only For Education And Not To Be Used For Investing or Trading. See Terms & Conditions


One More Thing ... Get Best Stocks Delivered Daily!
Never Ever Miss A Move With Our Top Ten Stocks Lists
Find Best Stocks In Any Market - Bull or Bear Market
Take A Peek At Our Top Ten Stocks Lists: Daily, Weekly, Year-to-Date & Top Trends
Find Best Stocks In Any Market - Bull or Bear Market
Take A Peek At Our Top Ten Stocks Lists: Daily, Weekly, Year-to-Date & Top Trends
Smallcap Stocks With Best Up Trends [0-bearish to 100-bullish]: B. Riley[100], Ribbon [100], Group 1[100], Trustmark [100], MBIA [100], Integer [100], EchoStar [100], Comstock Resources[100], Vishay Inter[100], Jamf Holding[100], SunOpta [100]
Best Smallcap Stocks Year-to-Date:
CareMax [574.23%], Janux [352.07%], Viking [249.65%], Alpine Immune[239.13%], Longboard [223.4%], Avidity Biosciences[177.71%], Arcutis Bio[170.9%], Super Micro[165.5%], Vera [149.61%], Hippo [130.79%], Y-mAbs [124.19%] Best Smallcap Stocks This Week:
Matterport [166.09%], B. Riley[48.82%], Seres [30.29%], Riot Blockchain[30.12%], CareMax [27.24%], Ribbon [25.97%], ProKidney [23.28%], SoundHound AI[22.54%], Cipher Mining[22.14%], Hibbett Sports[21.61%], Cullinan Oncology[20.69%] Best Smallcap Stocks Daily:
B. Riley[36.97%], Ribbon [26.46%], Babcock & Wilcox Enterprises[15.57%], Cullinan Oncology[13.55%], Amneal [12.04%], Comtech Tele[10.76%], Innodata [10.28%], Gritstone Oncology[10.06%], Navitas Semiconductor[8.83%], Eyenovia [8.68%], K12 [8.64%]