
 Login Sign Up


| |||||
 |  | ||||

| 12Stocks.com Market Intelligence |
Best S&P 500 Stocks
|
On this page, you will find the most comprehensive analysis of S&P 500 stocks and ETFs - from latest trends to performances to charts ➞. First, here are the year-to-date (YTD) performances of the most requested S&P 500 stocks at 12Stocks.com (click stock for review):
| NVIDIA 68% | ||
| Merck 18% | ||
| Amazon.com 18% | ||
| Google 17% | ||
| JPMorgan Chase 13% | ||
| Walmart 12% | ||
| Caterpillar 12% | ||
| Goldman Sachs 11% | ||
| Chevron 7% | ||
| Microsoft 5% | ||
| Johnson & Johnson -4% | ||
| McDonald s -7% | ||
| Apple -12% | ||
| Gilead -19% | ||
| Starbucks -22% | ||
| Boeing -34% | ||
| Intel -40% | ||
| Quick: S&P 500 Stocks Lists: Performances & Trends, S&P 500 Stock Charts
Sort S&P 500 stocks: Daily, Weekly, Year-to-Date, Market Cap & Trends. Filter S&P 500 stocks list by sector: Show all, Tech, Finance, Energy, Staples, Retail, Industrial, Materials, Utilities and HealthCare |
| 12Stocks.com S&P 500 Stocks Performances & Trends Daily Report | |||||||||
|
| 
The overall Smart Investing & Trading Score is 7 (0-bearish to 100-bullish) which puts S&P 500 index in short term bearish trend. The Smart Investing & Trading Score from previous trading session is 41 and hence a deterioration of trend. | ||||||||
Here are the Smart Investing & Trading Scores of the most requested S&P 500 stocks at 12Stocks.com (click stock name for detailed review):
|


| 12Stocks.com: Top Performing S&P 500 Index Stocks | ||||||||||||||||||||||||||||||||||||||||||||||||
 The top performing S&P 500 Index stocks year to date are
Now, more recently, over last week, the top performing S&P 500 Index stocks on the move are


|
||||||||||||||||||||||||||||||||||||||||||||||||
| 12Stocks.com: Investing in S&P 500 Index with Stocks | |
|
The following table helps investors and traders sort through current performance and trends (as measured by Smart Investing & Trading Score) of various
stocks in the S&P 500 Index. Quick View: Move mouse or cursor over stock symbol (ticker) to view short-term technical chart and over stock name to view long term chart. Click on  to add stock symbol to your watchlist and to add stock symbol to your watchlist and  to view watchlist. Click on any ticker or stock name for detailed market intelligence report for that stock. to view watchlist. Click on any ticker or stock name for detailed market intelligence report for that stock. |
12Stocks.com Performance of Stocks in S&P 500 Index
| Ticker | Stock Name | Watchlist | Category | Recent Price | Smart Investing & Trading Score | Change % | Weekly Change% |
| ANET | Arista Networks |   | Technology | 255.21 | 17 | -0.53% | -3.59% |
| SBAC | SBA | | Technology | 189.12 | 0 | 1.61% | -3.62% |
| VFC | V.F | | Consumer Staples | 12.18 | 23 | -2.25% | -3.64% |
| MPWR | Monolithic Power | | Technology | 652.59 | 17 | -2.50% | -3.64% |
| BXP | Boston Properties | | Financials | 59.25 | 0 | -4.27% | -3.67% |
| ANSS | ANSYS | | Technology | 321.48 | 0 | -1.05% | -3.68% |
| ROK | Rockwell Automation | | Industrials | 269.75 | 0 | -0.45% | -3.70% |
| ORLY | O Reilly | | Services & Goods | 1005.11 | 0 | -0.80% | -3.72% |
| CVX | Chevron | | Energy | 159.63 | 51 | -1.02% | -3.77% |
| ETN | Eaton | | Industrials | 312.03 | 33 | -1.96% | -3.78% |
| TRGP | Targa Resources | | Energy | 112.41 | 31 | -1.45% | -3.81% |
| NUE | Nucor | | Materials | 168.67 | 10 | 0.08% | -3.85% |
| NSC | Norfolk Southern | | Transports | 230.58 | 0 | 0.11% | -3.90% |
| SNPS | Synopsys | | Technology | 522.18 | 7 | -1.59% | -3.95% |
| ADI | Analog Devices | | Technology | 193.89 | 48 | -3.35% | -4.00% |
| BBY | Best Buy | | Services & Goods | 72.03 | 0 | -2.19% | -4.02% |
| NKE | NIKE | | Consumer Staples | 90.34 | 10 | -2.08% | -4.02% |
| CCL | Carnival | | Services & Goods | 14.47 | 32 | -2.36% | -4.05% |
| BX | Blackstone | | Financials | 117.49 | 0 | 0.75% | -4.08% |
| UAL | United Airlines | | Transports | 50.67 | 56 | -1.54% | -4.11% |
| SLB | Schlumberger | | Energy | 47.16 | 10 | -0.67% | -4.15% |
| QRVO | Qorvo | | Technology | 111.89 | 15 | -4.24% | -4.16% |
| EOG | EOG Resources | | Energy | 129.95 | 36 | -1.65% | -4.24% |
| HPE | Hewlett Packard | | Technology | 16.44 | 26 | -3.29% | -4.25% |
| ROST | Ross Stores | | Services & Goods | 127.82 | 0 | -1.34% | -4.33% |
| For chart view version of above stock list: Chart View ➞ 0 - 25 , 25 - 50 , 50 - 75 , 75 - 100 , 100 - 125 , 125 - 150 , 150 - 175 , 175 - 200 , 200 - 225 , 225 - 250 , 250 - 275 , 275 - 300 , 300 - 325 , 325 - 350 , 350 - 375 , 375 - 400 , 400 - 425 , 425 - 450 , 450 - 475 , 475 - 500 | ||
 | Click To Change The Sort Order: By Market Cap or Company Size Performance: Year-to-date, Week and Day |  |
|
Get the most comprehensive stock market coverage daily at 12Stocks.com ➞ Best Stocks Today ➞ Best Stocks Weekly ➞ Best Stocks Year-to-Date ➞ Best Stocks Trends ➞  Best Stocks Today 12Stocks.com Best Nasdaq Stocks ➞ Best S&P 500 Stocks ➞ Best Tech Stocks ➞ Best Biotech Stocks ➞ |
| Detailed Overview of S&P 500 Stocks |
| S&P 500 Technical Overview, Leaders & Laggards, Top S&P 500 ETF Funds & Detailed S&P 500 Stocks List, Charts, Trends & More |
| S&P 500: Technical Analysis, Trends & YTD Performance | |
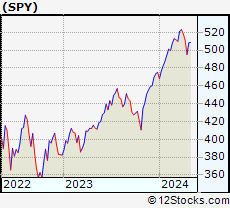
| S&P 500 index as represented by
SPY, an exchange-traded fund [ETF], holds basket of five hundred (mostly largecap) stocks from across all major sectors of the US stock market. The S&P 500 index (contains stocks like Apple and Exxon) is up by 5.27% and is currently outperforming the overall market by 0.73% year-to-date. Below is a quick view of technical charts and trends: | |
 SPY Weekly Chart |
|
| Long Term Trend: Not Good | |
| Medium Term Trend: Not Good | |
 SPY Daily Chart |
|
| Short Term Trend: Not Good | |
| Overall Trend Score: 7 | |
| YTD Performance: 5.27% | |
| **Trend Scores & Views Are Only For Educational Purposes And Not For Investing | |
| 12Stocks.com: Investing in S&P 500 Index using Exchange Traded Funds | |
|
The following table shows list of key exchange traded funds (ETF) that
help investors track S&P 500 index. The following list also includes leveraged ETF funds that track twice or thrice the daily returns of S&P 500 indices. Short or inverse ETF funds move in the opposite direction to the index they track and are useful during market pullbacks or during bear markets. Quick View: Move mouse or cursor over ETF symbol (ticker) to view short-term technical chart and over ETF name to view long term chart. Click on ticker or stock name for detailed view. Click on to add stock symbol to your watchlist and to view watchlist. |
12Stocks.com List of ETFs that track S&P 500 Index
| Ticker | ETF Name | Watchlist | Recent Price | Smart Investing & Trading Score | Change % | Week % | Year-to-date % |
| SPY | SPDR S&P 500 ETF | | 500.35 | 7 | -0.32 | -1.56 | 5.27% |
| IVV | iShares Core S&P 500 ETF | | 502.86 | 7 | -0.31 | -1.55 | 5.28% |
| VOO | Vanguard 500 ETF | | 459.93 | 7 | -0.33 | -1.56 | 5.3% |
| OEF | iShares S&P 100 | | 237.48 | 7 | -0.40 | -1.69 | 6.31% |
| SSO | ProShares Ultra S&P500 | | 70.39 | 7 | -0.68 | -3.19 | 8.18% |
| UPRO | ProShares UltraPro S&P500 | | 60.70 | 7 | -1.14 | -4.89 | 10.89% |
| SPXL | Direxion Daily S&P500 Bull 3X ETF | | 115.35 | 7 | -1.09 | -4.78 | 10.92% |
| SH | ProShares Short S&P500 | | 12.49 | 93 | 0.48 | 1.71 | -3.85% |
| SDS | ProShares UltraShort S&P500 | | 27.40 | 93 | 0.74 | 3.28 | -8.42% |
| SPXU | ProShares UltraPro Short S&P500 | | 37.21 | 88 | 0.98 | 4.82 | -13.47% |
| SPXS | Direxion Daily S&P 500 Bear 3X ETF | | 10.07 | 88 | 1.10 | 4.79 | -12.81% |
| 12Stocks.com: Charts, Trends, Fundamental Data and Performances of S&P 500 Stocks | |
|
We now take in-depth look at all S&P 500 stocks including charts, multi-period performances and overall trends (as measured by Smart Investing & Trading Score). One can sort S&P 500 stocks (click link to choose) by Daily, Weekly and by Year-to-Date performances. Also, one can sort by size of the company or by market capitalization. |
| Select Your Default Chart Type: | |||||
| |||||
| Click on stock symbol or name for detailed view. Click on to add stock symbol to your watchlist and to view watchlist. Quick View: Move mouse or cursor over "Daily" to quickly view daily technical stock chart and over "Weekly" to view weekly technical stock chart. | |||||

 | ANET Arista Networks, Inc. |
| Sector: Technology | |
| SubSector: Diversified Computer Systems | |
| MarketCap: 14071.2 Millions | |
| Recent Price: 255.21 Smart Investing & Trading Score: 17 | |
| Day Percent Change: -0.53% Day Change: -1.35 | |
| Week Change: -3.59% Year-to-date Change: 8.4% | |
| ANET Links: Profile News Message Board | |
| Charts:- Daily , Weekly | |
| Add ANET to Watchlist: View: Get ANET Trend Analysis ➞ | |
 | SBAC SBA Communications Corporation |
| Sector: Technology | |
| SubSector: Diversified Communication Services | |
| MarketCap: 26712.3 Millions | |
| Recent Price: 189.12 Smart Investing & Trading Score: 0 | |
| Day Percent Change: 1.61% Day Change: 3.00 | |
| Week Change: -3.62% Year-to-date Change: -25.5% | |
| SBAC Links: Profile News Message Board | |
| Charts:- Daily , Weekly | |
| Add SBAC to Watchlist: View: Get SBAC Trend Analysis ➞ | |
 | VFC V.F. Corporation |
| Sector: Consumer Staples | |
| SubSector: Textile - Apparel Clothing | |
| MarketCap: 23607.5 Millions | |
| Recent Price: 12.18 Smart Investing & Trading Score: 23 | |
| Day Percent Change: -2.25% Day Change: -0.28 | |
| Week Change: -3.64% Year-to-date Change: -35.2% | |
| VFC Links: Profile News Message Board | |
| Charts:- Daily , Weekly | |
| Add VFC to Watchlist: View: Get VFC Trend Analysis ➞ | |
 | MPWR Monolithic Power Systems, Inc. |
| Sector: Technology | |
| SubSector: Semiconductor - Specialized | |
| MarketCap: 6436.4 Millions | |
| Recent Price: 652.59 Smart Investing & Trading Score: 17 | |
| Day Percent Change: -2.50% Day Change: -16.74 | |
| Week Change: -3.64% Year-to-date Change: 3.5% | |
| MPWR Links: Profile News Message Board | |
| Charts:- Daily , Weekly | |
| Add MPWR to Watchlist: View: Get MPWR Trend Analysis ➞ | |
 | BXP Boston Properties, Inc. |
| Sector: Financials | |
| SubSector: REIT - Office | |
| MarketCap: 13788.6 Millions | |
| Recent Price: 59.25 Smart Investing & Trading Score: 0 | |
| Day Percent Change: -4.27% Day Change: -2.64 | |
| Week Change: -3.67% Year-to-date Change: -15.6% | |
| BXP Links: Profile News Message Board | |
| Charts:- Daily , Weekly | |
| Add BXP to Watchlist: View: Get BXP Trend Analysis ➞ | |
 | ANSS ANSYS, Inc. |
| Sector: Technology | |
| SubSector: Application Software | |
| MarketCap: 19497.4 Millions | |
| Recent Price: 321.48 Smart Investing & Trading Score: 0 | |
| Day Percent Change: -1.05% Day Change: -3.40 | |
| Week Change: -3.68% Year-to-date Change: -11.4% | |
| ANSS Links: Profile News Message Board | |
| Charts:- Daily , Weekly | |
| Add ANSS to Watchlist: View: Get ANSS Trend Analysis ➞ | |
 | ROK Rockwell Automation, Inc. |
| Sector: Industrials | |
| SubSector: Diversified Machinery | |
| MarketCap: 15666.1 Millions | |
| Recent Price: 269.75 Smart Investing & Trading Score: 0 | |
| Day Percent Change: -0.45% Day Change: -1.21 | |
| Week Change: -3.7% Year-to-date Change: -13.1% | |
| ROK Links: Profile News Message Board | |
| Charts:- Daily , Weekly | |
| Add ROK to Watchlist: View: Get ROK Trend Analysis ➞ | |
 | ORLY O Reilly Automotive, Inc. |
| Sector: Services & Goods | |
| SubSector: Auto Parts Stores | |
| MarketCap: 22391.5 Millions | |
| Recent Price: 1005.11 Smart Investing & Trading Score: 0 | |
| Day Percent Change: -0.80% Day Change: -8.15 | |
| Week Change: -3.72% Year-to-date Change: 5.8% | |
| ORLY Links: Profile News Message Board | |
| Charts:- Daily , Weekly | |
| Add ORLY to Watchlist: View: Get ORLY Trend Analysis ➞ | |
 | CVX Chevron Corporation |
| Sector: Energy | |
| SubSector: Major Integrated Oil & Gas | |
| MarketCap: 121521 Millions | |
| Recent Price: 159.63 Smart Investing & Trading Score: 51 | |
| Day Percent Change: -1.02% Day Change: -1.64 | |
| Week Change: -3.77% Year-to-date Change: 7.0% | |
| CVX Links: Profile News Message Board | |
| Charts:- Daily , Weekly | |
| Add CVX to Watchlist: View: Get CVX Trend Analysis ➞ | |
 | ETN Eaton Corporation plc |
| Sector: Industrials | |
| SubSector: Diversified Machinery | |
| MarketCap: 29829.4 Millions | |
| Recent Price: 312.03 Smart Investing & Trading Score: 33 | |
| Day Percent Change: -1.96% Day Change: -6.23 | |
| Week Change: -3.78% Year-to-date Change: 29.6% | |
| ETN Links: Profile News Message Board | |
| Charts:- Daily , Weekly | |
| Add ETN to Watchlist: View: Get ETN Trend Analysis ➞ | |
 | TRGP Targa Resources Corp. |
| Sector: Energy | |
| SubSector: Oil & Gas Pipelines | |
| MarketCap: 2210.65 Millions | |
| Recent Price: 112.41 Smart Investing & Trading Score: 31 | |
| Day Percent Change: -1.45% Day Change: -1.65 | |
| Week Change: -3.81% Year-to-date Change: 29.4% | |
| TRGP Links: Profile News Message Board | |
| Charts:- Daily , Weekly | |
| Add TRGP to Watchlist: View: Get TRGP Trend Analysis ➞ | |
 | NUE Nucor Corporation |
| Sector: Materials | |
| SubSector: Steel & Iron | |
| MarketCap: 10281.8 Millions | |
| Recent Price: 168.67 Smart Investing & Trading Score: 10 | |
| Day Percent Change: 0.08% Day Change: 0.14 | |
| Week Change: -3.85% Year-to-date Change: -3.1% | |
| NUE Links: Profile News Message Board | |
| Charts:- Daily , Weekly | |
| Add NUE to Watchlist: View: Get NUE Trend Analysis ➞ | |
 | NSC Norfolk Southern Corporation |
| Sector: Transports | |
| SubSector: Railroads | |
| MarketCap: 36165.4 Millions | |
| Recent Price: 230.58 Smart Investing & Trading Score: 0 | |
| Day Percent Change: 0.11% Day Change: 0.26 | |
| Week Change: -3.9% Year-to-date Change: -2.5% | |
| NSC Links: Profile News Message Board | |
| Charts:- Daily , Weekly | |
| Add NSC to Watchlist: View: Get NSC Trend Analysis ➞ | |
 | SNPS Synopsys, Inc. |
| Sector: Technology | |
| SubSector: Semiconductor Equipment & Materials | |
| MarketCap: 18273.8 Millions | |
| Recent Price: 522.18 Smart Investing & Trading Score: 7 | |
| Day Percent Change: -1.59% Day Change: -8.41 | |
| Week Change: -3.95% Year-to-date Change: 1.4% | |
| SNPS Links: Profile News Message Board | |
| Charts:- Daily , Weekly | |
| Add SNPS to Watchlist: View: Get SNPS Trend Analysis ➞ | |
 | ADI Analog Devices, Inc. |
| Sector: Technology | |
| SubSector: Semiconductor - Integrated Circuits | |
| MarketCap: 32859 Millions | |
| Recent Price: 193.89 Smart Investing & Trading Score: 48 | |
| Day Percent Change: -3.35% Day Change: -6.72 | |
| Week Change: -4% Year-to-date Change: -2.4% | |
| ADI Links: Profile News Message Board | |
| Charts:- Daily , Weekly | |
| Add ADI to Watchlist: View: Get ADI Trend Analysis ➞ | |
 | BBY Best Buy Co., Inc. |
| Sector: Services & Goods | |
| SubSector: Electronics Stores | |
| MarketCap: 15771.3 Millions | |
| Recent Price: 72.03 Smart Investing & Trading Score: 0 | |
| Day Percent Change: -2.19% Day Change: -1.61 | |
| Week Change: -4.02% Year-to-date Change: -8.0% | |
| BBY Links: Profile News Message Board | |
| Charts:- Daily , Weekly | |
| Add BBY to Watchlist: View: Get BBY Trend Analysis ➞ | |
 | NKE NIKE, Inc. |
| Sector: Consumer Staples | |
| SubSector: Textile - Apparel Footwear & Accessories | |
| MarketCap: 118918 Millions | |
| Recent Price: 90.34 Smart Investing & Trading Score: 10 | |
| Day Percent Change: -2.08% Day Change: -1.92 | |
| Week Change: -4.02% Year-to-date Change: -16.8% | |
| NKE Links: Profile News Message Board | |
| Charts:- Daily , Weekly | |
| Add NKE to Watchlist: View: Get NKE Trend Analysis ➞ | |
 | CCL Carnival Corporation & Plc |
| Sector: Services & Goods | |
| SubSector: Resorts & Casinos | |
| MarketCap: 11725.4 Millions | |
| Recent Price: 14.47 Smart Investing & Trading Score: 32 | |
| Day Percent Change: -2.36% Day Change: -0.35 | |
| Week Change: -4.05% Year-to-date Change: -22.0% | |
| CCL Links: Profile News Message Board | |
| Charts:- Daily , Weekly | |
| Add CCL to Watchlist: View: Get CCL Trend Analysis ➞ | |
 | BX The Blackstone Group Inc. |
| Sector: Financials | |
| SubSector: Asset Management | |
| MarketCap: 50957.7 Millions | |
| Recent Price: 117.49 Smart Investing & Trading Score: 0 | |
| Day Percent Change: 0.75% Day Change: 0.88 | |
| Week Change: -4.08% Year-to-date Change: -10.3% | |
| BX Links: Profile News Message Board | |
| Charts:- Daily , Weekly | |
| Add BX to Watchlist: View: Get BX Trend Analysis ➞ | |
 | UAL United Airlines Holdings, Inc. |
| Sector: Transports | |
| SubSector: Major Airlines | |
| MarketCap: 8083.25 Millions | |
| Recent Price: 50.67 Smart Investing & Trading Score: 56 | |
| Day Percent Change: -1.54% Day Change: -0.79 | |
| Week Change: -4.11% Year-to-date Change: 22.8% | |
| UAL Links: Profile News Message Board | |
| Charts:- Daily , Weekly | |
| Add UAL to Watchlist: View: Get UAL Trend Analysis ➞ | |
 | SLB Schlumberger Limited |
| Sector: Energy | |
| SubSector: Oil & Gas Equipment & Services | |
| MarketCap: 23892 Millions | |
| Recent Price: 47.16 Smart Investing & Trading Score: 10 | |
| Day Percent Change: -0.67% Day Change: -0.32 | |
| Week Change: -4.15% Year-to-date Change: -9.4% | |
| SLB Links: Profile News Message Board | |
| Charts:- Daily , Weekly | |
| Add SLB to Watchlist: View: Get SLB Trend Analysis ➞ | |
 | QRVO Qorvo, Inc. |
| Sector: Technology | |
| SubSector: Semiconductor - Broad Line | |
| MarketCap: 9524.32 Millions | |
| Recent Price: 111.89 Smart Investing & Trading Score: 15 | |
| Day Percent Change: -4.24% Day Change: -4.95 | |
| Week Change: -4.16% Year-to-date Change: -0.6% | |
| QRVO Links: Profile News Message Board | |
| Charts:- Daily , Weekly | |
| Add QRVO to Watchlist: View: Get QRVO Trend Analysis ➞ | |
 | EOG EOG Resources, Inc. |
| Sector: Energy | |
| SubSector: Independent Oil & Gas | |
| MarketCap: 24282.1 Millions | |
| Recent Price: 129.95 Smart Investing & Trading Score: 36 | |
| Day Percent Change: -1.65% Day Change: -2.18 | |
| Week Change: -4.24% Year-to-date Change: 7.4% | |
| EOG Links: Profile News Message Board | |
| Charts:- Daily , Weekly | |
| Add EOG to Watchlist: View: Get EOG Trend Analysis ➞ | |
 | HPE Hewlett Packard Enterprise Company |
| Sector: Technology | |
| SubSector: Communication Equipment | |
| MarketCap: 12886.1 Millions | |
| Recent Price: 16.44 Smart Investing & Trading Score: 26 | |
| Day Percent Change: -3.29% Day Change: -0.56 | |
| Week Change: -4.25% Year-to-date Change: -3.2% | |
| HPE Links: Profile News Message Board | |
| Charts:- Daily , Weekly | |
| Add HPE to Watchlist: View: Get HPE Trend Analysis ➞ | |
 | ROST Ross Stores, Inc. |
| Sector: Services & Goods | |
| SubSector: Apparel Stores | |
| MarketCap: 24938.8 Millions | |
| Recent Price: 127.82 Smart Investing & Trading Score: 0 | |
| Day Percent Change: -1.34% Day Change: -1.73 | |
| Week Change: -4.33% Year-to-date Change: -7.6% | |
| ROST Links: Profile News Message Board | |
| Charts:- Daily , Weekly | |
| Add ROST to Watchlist: View: Get ROST Trend Analysis ➞ | |
| For tabular summary view of above stock list: Summary View ➞ 0 - 25 , 25 - 50 , 50 - 75 , 75 - 100 , 100 - 125 , 125 - 150 , 150 - 175 , 175 - 200 , 200 - 225 , 225 - 250 , 250 - 275 , 275 - 300 , 300 - 325 , 325 - 350 , 350 - 375 , 375 - 400 , 400 - 425 , 425 - 450 , 450 - 475 , 475 - 500 | ||
| Click To Change The Sort Order: By Market Cap or Company Size Performance: Year-to-date, Week and Day | |
| Select Chart Type: | ||
|
Best Stocks Today 12Stocks.com |
© 2024 12Stocks.com Terms & Conditions Privacy Contact Us
All Information Provided Only For Education And Not To Be Used For Investing or Trading. See Terms & Conditions


One More Thing ... Get Best Stocks Delivered Daily!
Never Ever Miss A Move With Our Top Ten Stocks Lists
Find Best Stocks In Any Market - Bull or Bear Market
Take A Peek At Our Top Ten Stocks Lists: Daily, Weekly, Year-to-Date & Top Trends
Find Best Stocks In Any Market - Bull or Bear Market
Take A Peek At Our Top Ten Stocks Lists: Daily, Weekly, Year-to-Date & Top Trends
S&P 500 Stocks With Best Up Trends [0-bearish to 100-bullish]: Garmin [100], Amcor [100], DuPont de[100], Pfizer [100], American Electric[100], NextEra [100], Arch Capital[100], American Water[100], 3M [100], PPL [100], Pinnacle West[100]
Best S&P 500 Stocks Year-to-Date:
NVIDIA [67.69%], Constellation [57.66%], NRG [42.48%], Chipotle Mexican[37.24%], Western Digital[34.64%], DaVita [33.4%], Eli Lilly[33.25%], Progressive [32.97%], Leidos Holdings[31.37%], Eaton [29.57%], Targa Resources[29.4%] Best S&P 500 Stocks This Week:
Bio-Techne [14.67%], Garmin [13.92%], Amcor [9.25%], Leidos Holdings[9.07%], 3M [7.2%], Pfizer [7.01%], Tesla [6.95%], Corning [6.86%], DuPont de[6.24%], Eli Lilly[5.89%], Cincinnati Financial[5.79%] Best S&P 500 Stocks Daily:
Bio-Techne [16.22%], Garmin [13.12%], Amcor [9.62%], DuPont de[8.01%], Verisk Analytics[6.81%], Pfizer [6.09%], Johnson & Johnson[4.56%], Globe Life[4.35%], Humana [4.01%], Extra Space[3.29%], American Tower[3.08%]