
 Login Sign Up


| |||||
 |  | ||||

| 12Stocks.com Market Intelligence |
Best S&P 500 Stocks
|
On this page, you will find the most comprehensive analysis of S&P 500 stocks and ETFs - from latest trends to performances to charts ➞. First, here are the year-to-date (YTD) performances of the most requested S&P 500 stocks at 12Stocks.com (click stock for review):
| NVIDIA 71% | ||
| Caterpillar 21% | ||
| Amazon.com 18% | ||
| Merck 15% | ||
| Walmart 13% | ||
| Google 12% | ||
| Microsoft 8% | ||
| JPMorgan Chase 7% | ||
| Chevron 6% | ||
| Goldman Sachs 4% | ||
| Johnson & Johnson -7% | ||
| McDonald s -9% | ||
| Starbucks -9% | ||
| Apple -13% | ||
| Gilead -18% | ||
| Intel -30% | ||
| Boeing -35% | ||
| Quick: S&P 500 Stocks Lists: Performances & Trends, S&P 500 Stock Charts
Sort S&P 500 stocks: Daily, Weekly, Year-to-Date, Market Cap & Trends. Filter S&P 500 stocks list by sector: Show all, Tech, Finance, Energy, Staples, Retail, Industrial, Materials, Utilities and HealthCare |
| 12Stocks.com S&P 500 Stocks Performances & Trends Daily Report | |||||||||
|
| 
The overall Smart Investing & Trading Score is 36 (0-bearish to 100-bullish) which puts S&P 500 index in short term bearish to neutral trend. The Smart Investing & Trading Score from previous trading session is 26 and hence an improvement of trend. | ||||||||
Here are the Smart Investing & Trading Scores of the most requested S&P 500 stocks at 12Stocks.com (click stock name for detailed review):
|


| 12Stocks.com: Top Performing S&P 500 Index Stocks | ||||||||||||||||||||||||||||||||||||||||||||||||
 The top performing S&P 500 Index stocks year to date are
Now, more recently, over last week, the top performing S&P 500 Index stocks on the move are


|
||||||||||||||||||||||||||||||||||||||||||||||||
| 12Stocks.com: Investing in S&P 500 Index with Stocks | |
|
The following table helps investors and traders sort through current performance and trends (as measured by Smart Investing & Trading Score) of various
stocks in the S&P 500 Index. Quick View: Move mouse or cursor over stock symbol (ticker) to view short-term technical chart and over stock name to view long term chart. Click on  to add stock symbol to your watchlist and to add stock symbol to your watchlist and  to view watchlist. Click on any ticker or stock name for detailed market intelligence report for that stock. to view watchlist. Click on any ticker or stock name for detailed market intelligence report for that stock. |
12Stocks.com Performance of Stocks in S&P 500 Index
| Ticker | Stock Name | Watchlist | Category | Recent Price | Smart Investing & Trading Score | Change % | Weekly Change% |
| APA | Apache |   | Energy | 32.43 | 46 | 0.53% | -3.83% |
| BLDR | Builders FirstSource | | Industrials | 182.28 | 43 | 1.66% | -3.83% |
| DHI | D.R. Horton | | Industrials | 145.88 | 43 | 0.10% | -3.84% |
| PYPL | PayPal Holdings | | Financials | 62.10 | 36 | -1.83% | -3.86% |
| BIIB | Biogen | | Health Care | 190.52 | 0 | -0.85% | -3.87% |
| SWKS | Skyworks Solutions | | Technology | 97.62 | 0 | -0.86% | -3.87% |
| ULTA | Ulta Beauty | | Services & Goods | 425.11 | 10 | 0.13% | -3.89% |
| CPRT | Copart | | Services & Goods | 53.20 | 26 | -1.52% | -3.94% |
| MSCI | MSCI | | Technology | 505.76 | 0 | -1.19% | -3.96% |
| ROK | Rockwell Automation | | Industrials | 273.50 | 26 | -1.85% | -3.97% |
| NVDA | NVIDIA | | Technology | 846.71 | 41 | 0.76% | -3.99% |
| IDXX | IDEXX | | Health Care | 477.79 | 10 | -0.09% | -4.02% |
| DLR | Digital Realty | | Financials | 136.66 | 7 | 0.67% | -4.09% |
| ZBH | Zimmer Biomet | | Health Care | 119.33 | 0 | -1.62% | -4.14% |
| MOH | Molina Healthcare | | Health Care | 360.94 | 51 | 0.30% | -4.15% |
| BWA | BorgWarner | | Consumer Staples | 32.11 | 10 | 0.78% | -4.15% |
| FANG | Diamondback | | Energy | 199.60 | 51 | -0.77% | -4.16% |
| MSFT | Microsoft | | Technology | 404.27 | 26 | -1.84% | -4.18% |
| TMO | Thermo Fisher | | Health Care | 541.52 | 13 | -1.05% | -4.19% |
| ORCL | Oracle | | Technology | 116.00 | 26 | -2.25% | -4.22% |
| EW | Edwards Life | | Health Care | 86.45 | 36 | -0.91% | -4.24% |
| PAYX | Paychex | | Services & Goods | 117.79 | 0 | -1.13% | -4.24% |
| AXON | Axovant | | Health Care | 297.59 | 33 | -0.74% | -4.25% |
| SYK | Stryker | | Health Care | 327.45 | 0 | -2.55% | -4.27% |
| OXY | Occidental | | Energy | 66.04 | 51 | 0.09% | -4.30% |
| For chart view version of above stock list: Chart View ➞ 0 - 25 , 25 - 50 , 50 - 75 , 75 - 100 , 100 - 125 , 125 - 150 , 150 - 175 , 175 - 200 , 200 - 225 , 225 - 250 , 250 - 275 , 275 - 300 , 300 - 325 , 325 - 350 , 350 - 375 , 375 - 400 , 400 - 425 , 425 - 450 , 450 - 475 , 475 - 500 | ||
 | Click To Change The Sort Order: By Market Cap or Company Size Performance: Year-to-date, Week and Day |  |
|
Get the most comprehensive stock market coverage daily at 12Stocks.com ➞ Best Stocks Today ➞ Best Stocks Weekly ➞ Best Stocks Year-to-Date ➞ Best Stocks Trends ➞  Best Stocks Today 12Stocks.com Best Nasdaq Stocks ➞ Best S&P 500 Stocks ➞ Best Tech Stocks ➞ Best Biotech Stocks ➞ |
| Detailed Overview of S&P 500 Stocks |
| S&P 500 Technical Overview, Leaders & Laggards, Top S&P 500 ETF Funds & Detailed S&P 500 Stocks List, Charts, Trends & More |
| S&P 500: Technical Analysis, Trends & YTD Performance | |
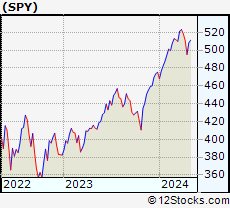
| S&P 500 index as represented by
SPY, an exchange-traded fund [ETF], holds basket of five hundred (mostly largecap) stocks from across all major sectors of the US stock market. The S&P 500 index (contains stocks like Apple and Exxon) is up by 5.09% and is currently outperforming the overall market by 0.9% year-to-date. Below is a quick view of technical charts and trends: | |
 SPY Weekly Chart |
|
| Long Term Trend: Good | |
| Medium Term Trend: Not Good | |
 SPY Daily Chart |
|
| Short Term Trend: Not Good | |
| Overall Trend Score: 36 | |
| YTD Performance: 5.09% | |
| **Trend Scores & Views Are Only For Educational Purposes And Not For Investing | |
| 12Stocks.com: Investing in S&P 500 Index using Exchange Traded Funds | |
|
The following table shows list of key exchange traded funds (ETF) that
help investors track S&P 500 index. The following list also includes leveraged ETF funds that track twice or thrice the daily returns of S&P 500 indices. Short or inverse ETF funds move in the opposite direction to the index they track and are useful during market pullbacks or during bear markets. Quick View: Move mouse or cursor over ETF symbol (ticker) to view short-term technical chart and over ETF name to view long term chart. Click on ticker or stock name for detailed view. Click on to add stock symbol to your watchlist and to view watchlist. |
12Stocks.com List of ETFs that track S&P 500 Index
| Ticker | ETF Name | Watchlist | Recent Price | Smart Investing & Trading Score | Change % | Week % | Year-to-date % |
| SPY | SPDR S&P 500 ETF | | 499.52 | 36 | -0.21 | -2.22 | 5.09% |
| IVV | iShares Core S&P 500 ETF | | 501.88 | 36 | -0.23 | -2.23 | 5.08% |
| VOO | Vanguard 500 ETF | | 458.94 | 36 | -0.23 | -2.26 | 5.07% |
| OEF | iShares S&P 100 | | 237.62 | 36 | -0.13 | -2.27 | 6.37% |
| SSO | ProShares Ultra S&P500 | | 70.33 | 36 | -0.47 | -4.52 | 8.08% |
| UPRO | ProShares UltraPro S&P500 | | 60.78 | 36 | -0.78 | -6.78 | 11.03% |
| SPXL | Direxion Daily S&P500 Bull 3X ETF | | 115.53 | 36 | -0.70 | -6.71 | 11.1% |
| SH | ProShares Short S&P500 | | 12.47 | 74 | 0.24 | 2.3 | -4% |
| SDS | ProShares UltraShort S&P500 | | 27.41 | 74 | 0.51 | 4.74 | -8.39% |
| SPXU | ProShares UltraPro Short S&P500 | | 37.33 | 69 | 0.70 | 7.09 | -13.19% |
| SPXS | Direxion Daily S&P 500 Bear 3X ETF | | 10.11 | 69 | 1.00 | 7.32 | -12.47% |
| 12Stocks.com: Charts, Trends, Fundamental Data and Performances of S&P 500 Stocks | |
|
We now take in-depth look at all S&P 500 stocks including charts, multi-period performances and overall trends (as measured by Smart Investing & Trading Score). One can sort S&P 500 stocks (click link to choose) by Daily, Weekly and by Year-to-Date performances. Also, one can sort by size of the company or by market capitalization. |
| Select Your Default Chart Type: | |||||
| |||||
| Click on stock symbol or name for detailed view. Click on to add stock symbol to your watchlist and to view watchlist. Quick View: Move mouse or cursor over "Daily" to quickly view daily technical stock chart and over "Weekly" to view weekly technical stock chart. | |||||

 | APA Apache Corporation |
| Sector: Energy | |
| SubSector: Independent Oil & Gas | |
| MarketCap: 1937.53 Millions | |
| Recent Price: 32.43 Smart Investing & Trading Score: 46 | |
| Day Percent Change: 0.53% Day Change: 0.17 | |
| Week Change: -3.83% Year-to-date Change: -9.6% | |
| APA Links: Profile News Message Board | |
| Charts:- Daily , Weekly | |
| Add APA to Watchlist: View: Get APA Trend Analysis ➞ | |
 | BLDR Builders FirstSource, Inc. |
| Sector: Industrials | |
| SubSector: General Building Materials | |
| MarketCap: 1714.63 Millions | |
| Recent Price: 182.28 Smart Investing & Trading Score: 43 | |
| Day Percent Change: 1.66% Day Change: 2.97 | |
| Week Change: -3.83% Year-to-date Change: 9.2% | |
| BLDR Links: Profile News Message Board | |
| Charts:- Daily , Weekly | |
| Add BLDR to Watchlist: View: Get BLDR Trend Analysis ➞ | |
 | DHI D.R. Horton, Inc. |
| Sector: Industrials | |
| SubSector: Residential Construction | |
| MarketCap: 13372.6 Millions | |
| Recent Price: 145.88 Smart Investing & Trading Score: 43 | |
| Day Percent Change: 0.10% Day Change: 0.14 | |
| Week Change: -3.84% Year-to-date Change: -4.0% | |
| DHI Links: Profile News Message Board | |
| Charts:- Daily , Weekly | |
| Add DHI to Watchlist: View: Get DHI Trend Analysis ➞ | |
 | PYPL PayPal Holdings, Inc. |
| Sector: Financials | |
| SubSector: Credit Services | |
| MarketCap: 108949 Millions | |
| Recent Price: 62.10 Smart Investing & Trading Score: 36 | |
| Day Percent Change: -1.83% Day Change: -1.16 | |
| Week Change: -3.86% Year-to-date Change: 1.1% | |
| PYPL Links: Profile News Message Board | |
| Charts:- Daily , Weekly | |
| Add PYPL to Watchlist: View: Get PYPL Trend Analysis ➞ | |
 | BIIB Biogen Inc. |
| Sector: Health Care | |
| SubSector: Biotechnology | |
| MarketCap: 53102.6 Millions | |
| Recent Price: 190.52 Smart Investing & Trading Score: 0 | |
| Day Percent Change: -0.85% Day Change: -1.64 | |
| Week Change: -3.87% Year-to-date Change: -26.4% | |
| BIIB Links: Profile News Message Board | |
| Charts:- Daily , Weekly | |
| Add BIIB to Watchlist: View: Get BIIB Trend Analysis ➞ | |
 | SWKS Skyworks Solutions, Inc. |
| Sector: Technology | |
| SubSector: Semiconductor - Integrated Circuits | |
| MarketCap: 13981 Millions | |
| Recent Price: 97.62 Smart Investing & Trading Score: 0 | |
| Day Percent Change: -0.86% Day Change: -0.85 | |
| Week Change: -3.87% Year-to-date Change: -13.2% | |
| SWKS Links: Profile News Message Board | |
| Charts:- Daily , Weekly | |
| Add SWKS to Watchlist: View: Get SWKS Trend Analysis ➞ | |
 | ULTA Ulta Beauty, Inc. |
| Sector: Services & Goods | |
| SubSector: Specialty Retail, Other | |
| MarketCap: 9429.94 Millions | |
| Recent Price: 425.11 Smart Investing & Trading Score: 10 | |
| Day Percent Change: 0.13% Day Change: 0.56 | |
| Week Change: -3.89% Year-to-date Change: -13.2% | |
| ULTA Links: Profile News Message Board | |
| Charts:- Daily , Weekly | |
| Add ULTA to Watchlist: View: Get ULTA Trend Analysis ➞ | |
 | CPRT Copart, Inc. |
| Sector: Services & Goods | |
| SubSector: Auto Dealerships | |
| MarketCap: 15462.1 Millions | |
| Recent Price: 53.20 Smart Investing & Trading Score: 26 | |
| Day Percent Change: -1.52% Day Change: -0.82 | |
| Week Change: -3.94% Year-to-date Change: 8.6% | |
| CPRT Links: Profile News Message Board | |
| Charts:- Daily , Weekly | |
| Add CPRT to Watchlist: View: Get CPRT Trend Analysis ➞ | |
 | MSCI MSCI Inc. |
| Sector: Technology | |
| SubSector: Processing Systems & Products | |
| MarketCap: 21086.3 Millions | |
| Recent Price: 505.76 Smart Investing & Trading Score: 0 | |
| Day Percent Change: -1.19% Day Change: -6.07 | |
| Week Change: -3.96% Year-to-date Change: -10.6% | |
| MSCI Links: Profile News Message Board | |
| Charts:- Daily , Weekly | |
| Add MSCI to Watchlist: View: Get MSCI Trend Analysis ➞ | |
 | ROK Rockwell Automation, Inc. |
| Sector: Industrials | |
| SubSector: Diversified Machinery | |
| MarketCap: 15666.1 Millions | |
| Recent Price: 273.50 Smart Investing & Trading Score: 26 | |
| Day Percent Change: -1.85% Day Change: -5.15 | |
| Week Change: -3.97% Year-to-date Change: -11.9% | |
| ROK Links: Profile News Message Board | |
| Charts:- Daily , Weekly | |
| Add ROK to Watchlist: View: Get ROK Trend Analysis ➞ | |
 | NVDA NVIDIA Corporation |
| Sector: Technology | |
| SubSector: Semiconductor - Specialized | |
| MarketCap: 143476 Millions | |
| Recent Price: 846.71 Smart Investing & Trading Score: 41 | |
| Day Percent Change: 0.76% Day Change: 6.36 | |
| Week Change: -3.99% Year-to-date Change: 71.0% | |
| NVDA Links: Profile News Message Board | |
| Charts:- Daily , Weekly | |
| Add NVDA to Watchlist: View: Get NVDA Trend Analysis ➞ | |
 | IDXX IDEXX Laboratories, Inc. |
| Sector: Health Care | |
| SubSector: Diagnostic Substances | |
| MarketCap: 15937.1 Millions | |
| Recent Price: 477.79 Smart Investing & Trading Score: 10 | |
| Day Percent Change: -0.09% Day Change: -0.45 | |
| Week Change: -4.02% Year-to-date Change: -13.9% | |
| IDXX Links: Profile News Message Board | |
| Charts:- Daily , Weekly | |
| Add IDXX to Watchlist: View: Get IDXX Trend Analysis ➞ | |
 | DLR Digital Realty Trust, Inc. |
| Sector: Financials | |
| SubSector: REIT - Office | |
| MarketCap: 27038.6 Millions | |
| Recent Price: 136.66 Smart Investing & Trading Score: 7 | |
| Day Percent Change: 0.67% Day Change: 0.91 | |
| Week Change: -4.09% Year-to-date Change: 1.6% | |
| DLR Links: Profile News Message Board | |
| Charts:- Daily , Weekly | |
| Add DLR to Watchlist: View: Get DLR Trend Analysis ➞ | |
 | ZBH Zimmer Biomet Holdings, Inc. |
| Sector: Health Care | |
| SubSector: Medical Appliances & Equipment | |
| MarketCap: 19339.4 Millions | |
| Recent Price: 119.33 Smart Investing & Trading Score: 0 | |
| Day Percent Change: -1.62% Day Change: -1.97 | |
| Week Change: -4.14% Year-to-date Change: -2.0% | |
| ZBH Links: Profile News Message Board | |
| Charts:- Daily , Weekly | |
| Add ZBH to Watchlist: View: Get ZBH Trend Analysis ➞ | |
 | MOH Molina Healthcare, Inc. |
| Sector: Health Care | |
| SubSector: Health Care Plans | |
| MarketCap: 7235.6 Millions | |
| Recent Price: 360.94 Smart Investing & Trading Score: 51 | |
| Day Percent Change: 0.30% Day Change: 1.09 | |
| Week Change: -4.15% Year-to-date Change: -0.1% | |
| MOH Links: Profile News Message Board | |
| Charts:- Daily , Weekly | |
| Add MOH to Watchlist: View: Get MOH Trend Analysis ➞ | |
 | BWA BorgWarner Inc. |
| Sector: Consumer Staples | |
| SubSector: Auto Parts | |
| MarketCap: 4604.09 Millions | |
| Recent Price: 32.11 Smart Investing & Trading Score: 10 | |
| Day Percent Change: 0.78% Day Change: 0.25 | |
| Week Change: -4.15% Year-to-date Change: -10.4% | |
| BWA Links: Profile News Message Board | |
| Charts:- Daily , Weekly | |
| Add BWA to Watchlist: View: Get BWA Trend Analysis ➞ | |
 | FANG Diamondback Energy, Inc. |
| Sector: Energy | |
| SubSector: Independent Oil & Gas | |
| MarketCap: 3009.13 Millions | |
| Recent Price: 199.60 Smart Investing & Trading Score: 51 | |
| Day Percent Change: -0.77% Day Change: -1.55 | |
| Week Change: -4.16% Year-to-date Change: 28.7% | |
| FANG Links: Profile News Message Board | |
| Charts:- Daily , Weekly | |
| Add FANG to Watchlist: View: Get FANG Trend Analysis ➞ | |
 | MSFT Microsoft Corporation |
| Sector: Technology | |
| SubSector: Business Software & Services | |
| MarketCap: 1154150 Millions | |
| Recent Price: 404.27 Smart Investing & Trading Score: 26 | |
| Day Percent Change: -1.84% Day Change: -7.57 | |
| Week Change: -4.18% Year-to-date Change: 7.5% | |
| MSFT Links: Profile News Message Board | |
| Charts:- Daily , Weekly | |
| Add MSFT to Watchlist: View: Get MSFT Trend Analysis ➞ | |
 | TMO Thermo Fisher Scientific Inc. |
| Sector: Health Care | |
| SubSector: Medical Laboratories & Research | |
| MarketCap: 112999 Millions | |
| Recent Price: 541.52 Smart Investing & Trading Score: 13 | |
| Day Percent Change: -1.05% Day Change: -5.73 | |
| Week Change: -4.19% Year-to-date Change: 2.0% | |
| TMO Links: Profile News Message Board | |
| Charts:- Daily , Weekly | |
| Add TMO to Watchlist: View: Get TMO Trend Analysis ➞ | |
 | ORCL Oracle Corporation |
| Sector: Technology | |
| SubSector: Application Software | |
| MarketCap: 164530 Millions | |
| Recent Price: 116.00 Smart Investing & Trading Score: 26 | |
| Day Percent Change: -2.25% Day Change: -2.67 | |
| Week Change: -4.22% Year-to-date Change: 10.0% | |
| ORCL Links: Profile News Message Board | |
| Charts:- Daily , Weekly | |
| Add ORCL to Watchlist: View: Get ORCL Trend Analysis ➞ | |
 | EW Edwards Lifesciences Corporation |
| Sector: Health Care | |
| SubSector: Medical Appliances & Equipment | |
| MarketCap: 36735.5 Millions | |
| Recent Price: 86.45 Smart Investing & Trading Score: 36 | |
| Day Percent Change: -0.91% Day Change: -0.79 | |
| Week Change: -4.24% Year-to-date Change: 13.4% | |
| EW Links: Profile News Message Board | |
| Charts:- Daily , Weekly | |
| Add EW to Watchlist: View: Get EW Trend Analysis ➞ | |
 | PAYX Paychex, Inc. |
| Sector: Services & Goods | |
| SubSector: Staffing & Outsourcing Services | |
| MarketCap: 20928.8 Millions | |
| Recent Price: 117.79 Smart Investing & Trading Score: 0 | |
| Day Percent Change: -1.13% Day Change: -1.35 | |
| Week Change: -4.24% Year-to-date Change: -1.1% | |
| PAYX Links: Profile News Message Board | |
| Charts:- Daily , Weekly | |
| Add PAYX to Watchlist: View: Get PAYX Trend Analysis ➞ | |
 | AXON Axovant Sciences Ltd. |
| Sector: Health Care | |
| SubSector: Biotechnology | |
| MarketCap: 1492.04 Millions | |
| Recent Price: 297.59 Smart Investing & Trading Score: 33 | |
| Day Percent Change: -0.74% Day Change: -2.23 | |
| Week Change: -4.25% Year-to-date Change: 15.2% | |
| AXON Links: Profile News Message Board | |
| Charts:- Daily , Weekly | |
| Add AXON to Watchlist: View: Get AXON Trend Analysis ➞ | |
 | SYK Stryker Corporation |
| Sector: Health Care | |
| SubSector: Medical Appliances & Equipment | |
| MarketCap: 59441.3 Millions | |
| Recent Price: 327.45 Smart Investing & Trading Score: 0 | |
| Day Percent Change: -2.55% Day Change: -8.58 | |
| Week Change: -4.27% Year-to-date Change: 9.4% | |
| SYK Links: Profile News Message Board | |
| Charts:- Daily , Weekly | |
| Add SYK to Watchlist: View: Get SYK Trend Analysis ➞ | |
 | OXY Occidental Petroleum Corporation |
| Sector: Energy | |
| SubSector: Independent Oil & Gas | |
| MarketCap: 9152.73 Millions | |
| Recent Price: 66.04 Smart Investing & Trading Score: 51 | |
| Day Percent Change: 0.09% Day Change: 0.06 | |
| Week Change: -4.3% Year-to-date Change: 10.6% | |
| OXY Links: Profile News Message Board | |
| Charts:- Daily , Weekly | |
| Add OXY to Watchlist: View: Get OXY Trend Analysis ➞ | |
| For tabular summary view of above stock list: Summary View ➞ 0 - 25 , 25 - 50 , 50 - 75 , 75 - 100 , 100 - 125 , 125 - 150 , 150 - 175 , 175 - 200 , 200 - 225 , 225 - 250 , 250 - 275 , 275 - 300 , 300 - 325 , 325 - 350 , 350 - 375 , 375 - 400 , 400 - 425 , 425 - 450 , 450 - 475 , 475 - 500 | ||
| Click To Change The Sort Order: By Market Cap or Company Size Performance: Year-to-date, Week and Day | |
| Select Chart Type: | ||
|
Best Stocks Today 12Stocks.com |
© 2024 12Stocks.com Terms & Conditions Privacy Contact Us
All Information Provided Only For Education And Not To Be Used For Investing or Trading. See Terms & Conditions


One More Thing ... Get Best Stocks Delivered Daily!
Never Ever Miss A Move With Our Top Ten Stocks Lists
Find Best Stocks In Any Market - Bull or Bear Market
Take A Peek At Our Top Ten Stocks Lists: Daily, Weekly, Year-to-Date & Top Trends
Find Best Stocks In Any Market - Bull or Bear Market
Take A Peek At Our Top Ten Stocks Lists: Daily, Weekly, Year-to-Date & Top Trends
S&P 500 Stocks With Best Up Trends [0-bearish to 100-bullish]: Genuine Parts[100], United Airlines[100], Generac Holdings[93], Bunge [93], Charles Schwab[93], Conagra Brands[93], Wells Fargo[90], PepsiCo [85], Lockheed Martin[85], Constellation [83], Progressive [83]
Best S&P 500 Stocks Year-to-Date:
NVIDIA [70.98%], Constellation [59.78%], Meta Platforms[41.76%], NRG [36.4%], Progressive [31.69%], Marathon [31.45%], Micron [31.16%], Western Digital[30.46%], Diamondback [28.71%], Targa Resources[28.68%], Eaton [28.29%] Best S&P 500 Stocks This Week:
United Airlines[23.01%], UnitedHealth [12.29%], Genuine Parts[10.21%], Globe Life[10%], ProShares UltraPro[7.09%], American Airlines[6.62%], Southwest Airlines[5.52%], Morgan Stanley[4.72%], V.F [4.62%], General Mills[4.37%], Estee Lauder[4.33%] Best S&P 500 Stocks Daily:
Genuine Parts[11.22%], United Airlines[5.50%], Estee Lauder[4.90%], Allstate [3.80%], Discover Financial[3.65%], Capital One[3.55%], V.F [3.43%], UnitedHealth [2.96%], Synchrony Financial[2.82%], Globe Life[2.80%], Wells Fargo[2.73%]