
 Login Sign Up


| |||||
 |  | ||||

| 12Stocks.com Market Intelligence |
Best S&P 500 Stocks
|
On this page, you will find the most comprehensive analysis of S&P 500 stocks and ETFs - from latest trends to performances to charts ➞. First, here are the year-to-date (YTD) performances of the most requested S&P 500 stocks at 12Stocks.com (click stock for review):
| NVIDIA 79% | ||
| Amazon.com 23% | ||
| Google 20% | ||
| Merck 17% | ||
| Caterpillar 14% | ||
| Walmart 14% | ||
| Goldman Sachs 14% | ||
| JPMorgan Chase 12% | ||
| Microsoft 8% | ||
| Chevron 7% | ||
| Apple -5% | ||
| Johnson & Johnson -5% | ||
| McDonald s -9% | ||
| Gilead -20% | ||
| Starbucks -24% | ||
| Boeing -31% | ||
| Intel -39% | ||
| Quick: S&P 500 Stocks Lists: Performances & Trends, S&P 500 Stock Charts
Sort S&P 500 stocks: Daily, Weekly, Year-to-Date, Market Cap & Trends. Filter S&P 500 stocks list by sector: Show all, Tech, Finance, Energy, Staples, Retail, Industrial, Materials, Utilities and HealthCare |
| 12Stocks.com S&P 500 Stocks Performances & Trends Daily Report | |||||||||
|
| 
The overall Smart Investing & Trading Score is 60 (0-bearish to 100-bullish) which puts S&P 500 index in short term neutral to bullish trend. The Smart Investing & Trading Score from previous trading session is 30 and hence an improvement of trend. | ||||||||
Here are the Smart Investing & Trading Scores of the most requested S&P 500 stocks at 12Stocks.com (click stock name for detailed review):
|


| 12Stocks.com: Top Performing S&P 500 Index Stocks | ||||||||||||||||||||||||||||||||||||||||||||||||
 The top performing S&P 500 Index stocks year to date are
Now, more recently, over last week, the top performing S&P 500 Index stocks on the move are


|
||||||||||||||||||||||||||||||||||||||||||||||||
| 12Stocks.com: Investing in S&P 500 Index with Stocks | |
|
The following table helps investors and traders sort through current performance and trends (as measured by Smart Investing & Trading Score) of various
stocks in the S&P 500 Index. Quick View: Move mouse or cursor over stock symbol (ticker) to view short-term technical chart and over stock name to view long term chart. Click on  to add stock symbol to your watchlist and to add stock symbol to your watchlist and  to view watchlist. Click on any ticker or stock name for detailed market intelligence report for that stock. to view watchlist. Click on any ticker or stock name for detailed market intelligence report for that stock. |
12Stocks.com Performance of Stocks in S&P 500 Index
| Ticker | Stock Name | Watchlist | Category | Recent Price | Smart Investing & Trading Score | Change % | Weekly Change% |
| NKE | NIKE |   | Consumer Staples | 92.15 | 32 | -0.28% | -2.09% |
| SYK | Stryker | | Health Care | 328.45 | 17 | 0.56% | -2.13% |
| GM | General Motors | | Consumer Staples | 44.86 | 66 | 0.43% | -2.14% |
| ROK | Rockwell Automation | | Industrials | 274.05 | 32 | 1.48% | -2.17% |
| V | Visa | | Financials | 268.49 | 18 | 0.33% | -2.20% |
| TROW | T. Rowe | | Financials | 111.50 | 37 | 0.31% | -2.21% |
| ULTA | Ulta Beauty | | Services & Goods | 397.39 | 10 | 0.02% | -2.21% |
| SYY | Sysco | | Consumer Staples | 75.36 | 40 | 1.49% | -2.22% |
| MSCI | MSCI | | Technology | 467.04 | 25 | -0.14% | -2.25% |
| UAL | United Airlines | | Transports | 51.65 | 76 | -0.06% | -2.25% |
| HES | Hess | | Energy | 158.86 | 78 | 0.19% | -2.26% |
| HLT | Hilton Worldwide | | Services & Goods | 197.54 | 32 | 0.01% | -2.27% |
| MLM | Martin Marietta | | Industrials | 591.03 | 58 | 0.18% | -2.31% |
| NOC | Northrop Grumman | | Industrials | 469.09 | 63 | -1.24% | -2.36% |
| IPG | Interpublic | | Services & Goods | 30.72 | 57 | 0.62% | -2.38% |
| MCHP | Microchip | | Technology | 91.36 | 83 | 2.12% | -2.39% |
| MAR | Marriott | | Services & Goods | 234.59 | 25 | -0.41% | -2.60% |
| COF | Capital One | | Financials | 142.41 | 49 | 0.42% | -2.60% |
| LULU | Lululemon Athletica | | Consumer Staples | 355.15 | 25 | 1.24% | -2.62% |
| MCK | McKesson | | Services & Goods | 528.86 | 48 | -0.27% | -2.66% |
| GOOG | | Technology | 168.99 | 95 | 0.31% | -2.71% | |
| ABNB | Airbnb | | Technology | 159.76 | 70 | 0.90% | -2.72% |
| GOOGL | | Technology | 167.24 | 95 | 0.37% | -2.74% | |
| BKR | Baker Hughes | | Services & Goods | 31.92 | 36 | -0.03% | -2.80% |
| F | Ford Motor | | Consumer Staples | 12.43 | 42 | -0.48% | -2.81% |
| For chart view version of above stock list: Chart View ➞ 0 - 25 , 25 - 50 , 50 - 75 , 75 - 100 , 100 - 125 , 125 - 150 , 150 - 175 , 175 - 200 , 200 - 225 , 225 - 250 , 250 - 275 , 275 - 300 , 300 - 325 , 325 - 350 , 350 - 375 , 375 - 400 , 400 - 425 , 425 - 450 , 450 - 475 , 475 - 500 | ||
 | Click To Change The Sort Order: By Market Cap or Company Size Performance: Year-to-date, Week and Day |  |
|
Get the most comprehensive stock market coverage daily at 12Stocks.com ➞ Best Stocks Today ➞ Best Stocks Weekly ➞ Best Stocks Year-to-Date ➞ Best Stocks Trends ➞  Best Stocks Today 12Stocks.com Best Nasdaq Stocks ➞ Best S&P 500 Stocks ➞ Best Tech Stocks ➞ Best Biotech Stocks ➞ |
| Detailed Overview of S&P 500 Stocks |
| S&P 500 Technical Overview, Leaders & Laggards, Top S&P 500 ETF Funds & Detailed S&P 500 Stocks List, Charts, Trends & More |
| S&P 500: Technical Analysis, Trends & YTD Performance | |
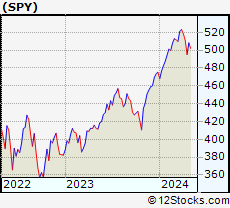
| S&P 500 index as represented by
SPY, an exchange-traded fund [ETF], holds basket of five hundred (mostly largecap) stocks from across all major sectors of the US stock market. The S&P 500 index (contains stocks like Apple and Exxon) is up by 7.57% and is currently outperforming the overall market by 0.69% year-to-date. Below is a quick view of technical charts and trends: | |
 SPY Weekly Chart |
|
| Long Term Trend: Good | |
| Medium Term Trend: Good | |
 SPY Daily Chart |
|
| Short Term Trend: Very Good | |
| Overall Trend Score: 60 | |
| YTD Performance: 7.57% | |
| **Trend Scores & Views Are Only For Educational Purposes And Not For Investing | |
| 12Stocks.com: Investing in S&P 500 Index using Exchange Traded Funds | |
|
The following table shows list of key exchange traded funds (ETF) that
help investors track S&P 500 index. The following list also includes leveraged ETF funds that track twice or thrice the daily returns of S&P 500 indices. Short or inverse ETF funds move in the opposite direction to the index they track and are useful during market pullbacks or during bear markets. Quick View: Move mouse or cursor over ETF symbol (ticker) to view short-term technical chart and over ETF name to view long term chart. Click on ticker or stock name for detailed view. Click on to add stock symbol to your watchlist and to view watchlist. |
12Stocks.com List of ETFs that track S&P 500 Index
| Ticker | ETF Name | Watchlist | Recent Price | Smart Investing & Trading Score | Change % | Week % | Year-to-date % |
| SPY | SPDR S&P 500 ETF | | 511.29 | 60 | 1.24 | 0.6 | 7.57% |
| IVV | iShares Core S&P 500 ETF | | 513.84 | 60 | 1.26 | 0.6 | 7.58% |
| VOO | Vanguard 500 ETF | | 469.98 | 60 | 1.24 | 0.59 | 7.6% |
| OEF | iShares S&P 100 | | 243.74 | 83 | 1.46 | 0.9 | 9.11% |
| SSO | ProShares Ultra S&P500 | | 73.46 | 60 | 2.51 | 1.03 | 12.89% |
| UPRO | ProShares UltraPro S&P500 | | 64.69 | 52 | 3.72 | 1.36 | 18.18% |
| SPXL | Direxion Daily S&P500 Bull 3X ETF | | 122.86 | 52 | 3.73 | 1.42 | 18.15% |
| SH | ProShares Short S&P500 | | 12.23 | 41 | -1.21 | -0.41 | -5.85% |
| SDS | ProShares UltraShort S&P500 | | 26.25 | 28 | -2.42 | -1.06 | -12.27% |
| SPXU | ProShares UltraPro Short S&P500 | | 34.89 | 23 | -3.78 | -1.72 | -18.86% |
| SPXS | Direxion Daily S&P 500 Bear 3X ETF | | 9.46 | 23 | -3.57 | -1.56 | -18.1% |
| 12Stocks.com: Charts, Trends, Fundamental Data and Performances of S&P 500 Stocks | |
|
We now take in-depth look at all S&P 500 stocks including charts, multi-period performances and overall trends (as measured by Smart Investing & Trading Score). One can sort S&P 500 stocks (click link to choose) by Daily, Weekly and by Year-to-Date performances. Also, one can sort by size of the company or by market capitalization. |
| Select Your Default Chart Type: | |||||
| |||||
| Click on stock symbol or name for detailed view. Click on to add stock symbol to your watchlist and to view watchlist. Quick View: Move mouse or cursor over "Daily" to quickly view daily technical stock chart and over "Weekly" to view weekly technical stock chart. | |||||

 | NKE NIKE, Inc. |
| Sector: Consumer Staples | |
| SubSector: Textile - Apparel Footwear & Accessories | |
| MarketCap: 118918 Millions | |
| Recent Price: 92.15 Smart Investing & Trading Score: 32 | |
| Day Percent Change: -0.28% Day Change: -0.26 | |
| Week Change: -2.09% Year-to-date Change: -15.1% | |
| NKE Links: Profile News Message Board | |
| Charts:- Daily , Weekly | |
| Add NKE to Watchlist: View: Get NKE Trend Analysis ➞ | |
 | SYK Stryker Corporation |
| Sector: Health Care | |
| SubSector: Medical Appliances & Equipment | |
| MarketCap: 59441.3 Millions | |
| Recent Price: 328.45 Smart Investing & Trading Score: 17 | |
| Day Percent Change: 0.56% Day Change: 1.82 | |
| Week Change: -2.13% Year-to-date Change: 9.7% | |
| SYK Links: Profile News Message Board | |
| Charts:- Daily , Weekly | |
| Add SYK to Watchlist: View: Get SYK Trend Analysis ➞ | |
 | GM General Motors Company |
| Sector: Consumer Staples | |
| SubSector: Auto Manufacturers - Major | |
| MarketCap: 29252.4 Millions | |
| Recent Price: 44.86 Smart Investing & Trading Score: 66 | |
| Day Percent Change: 0.43% Day Change: 0.19 | |
| Week Change: -2.14% Year-to-date Change: 24.9% | |
| GM Links: Profile News Message Board | |
| Charts:- Daily , Weekly | |
| Add GM to Watchlist: View: Get GM Trend Analysis ➞ | |
 | ROK Rockwell Automation, Inc. |
| Sector: Industrials | |
| SubSector: Diversified Machinery | |
| MarketCap: 15666.1 Millions | |
| Recent Price: 274.05 Smart Investing & Trading Score: 32 | |
| Day Percent Change: 1.48% Day Change: 4.01 | |
| Week Change: -2.17% Year-to-date Change: -11.7% | |
| ROK Links: Profile News Message Board | |
| Charts:- Daily , Weekly | |
| Add ROK to Watchlist: View: Get ROK Trend Analysis ➞ | |
 | V Visa Inc. |
| Sector: Financials | |
| SubSector: Credit Services | |
| MarketCap: 340798 Millions | |
| Recent Price: 268.49 Smart Investing & Trading Score: 18 | |
| Day Percent Change: 0.33% Day Change: 0.88 | |
| Week Change: -2.2% Year-to-date Change: 3.1% | |
| V Links: Profile News Message Board | |
| Charts:- Daily , Weekly | |
| Add V to Watchlist: View: Get V Trend Analysis ➞ | |
 | TROW T. Rowe Price Group, Inc. |
| Sector: Financials | |
| SubSector: Asset Management | |
| MarketCap: 24530 Millions | |
| Recent Price: 111.50 Smart Investing & Trading Score: 37 | |
| Day Percent Change: 0.31% Day Change: 0.34 | |
| Week Change: -2.21% Year-to-date Change: 3.5% | |
| TROW Links: Profile News Message Board | |
| Charts:- Daily , Weekly | |
| Add TROW to Watchlist: View: Get TROW Trend Analysis ➞ | |
 | ULTA Ulta Beauty, Inc. |
| Sector: Services & Goods | |
| SubSector: Specialty Retail, Other | |
| MarketCap: 9429.94 Millions | |
| Recent Price: 397.39 Smart Investing & Trading Score: 10 | |
| Day Percent Change: 0.02% Day Change: 0.06 | |
| Week Change: -2.21% Year-to-date Change: -18.9% | |
| ULTA Links: Profile News Message Board | |
| Charts:- Daily , Weekly | |
| Add ULTA to Watchlist: View: Get ULTA Trend Analysis ➞ | |
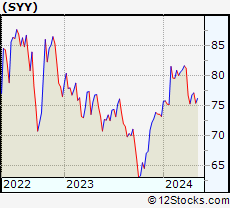 | SYY Sysco Corporation |
| Sector: Consumer Staples | |
| SubSector: Food Wholesale | |
| MarketCap: 22771.9 Millions | |
| Recent Price: 75.36 Smart Investing & Trading Score: 40 | |
| Day Percent Change: 1.49% Day Change: 1.11 | |
| Week Change: -2.22% Year-to-date Change: 3.1% | |
| SYY Links: Profile News Message Board | |
| Charts:- Daily , Weekly | |
| Add SYY to Watchlist: View: Get SYY Trend Analysis ➞ | |
 | MSCI MSCI Inc. |
| Sector: Technology | |
| SubSector: Processing Systems & Products | |
| MarketCap: 21086.3 Millions | |
| Recent Price: 467.04 Smart Investing & Trading Score: 25 | |
| Day Percent Change: -0.14% Day Change: -0.66 | |
| Week Change: -2.25% Year-to-date Change: -17.4% | |
| MSCI Links: Profile News Message Board | |
| Charts:- Daily , Weekly | |
| Add MSCI to Watchlist: View: Get MSCI Trend Analysis ➞ | |
 | UAL United Airlines Holdings, Inc. |
| Sector: Transports | |
| SubSector: Major Airlines | |
| MarketCap: 8083.25 Millions | |
| Recent Price: 51.65 Smart Investing & Trading Score: 76 | |
| Day Percent Change: -0.06% Day Change: -0.03 | |
| Week Change: -2.25% Year-to-date Change: 25.2% | |
| UAL Links: Profile News Message Board | |
| Charts:- Daily , Weekly | |
| Add UAL to Watchlist: View: Get UAL Trend Analysis ➞ | |
 | HES Hess Corporation |
| Sector: Energy | |
| SubSector: Independent Oil & Gas | |
| MarketCap: 10465.3 Millions | |
| Recent Price: 158.86 Smart Investing & Trading Score: 78 | |
| Day Percent Change: 0.19% Day Change: 0.30 | |
| Week Change: -2.26% Year-to-date Change: 10.2% | |
| HES Links: Profile News Message Board | |
| Charts:- Daily , Weekly | |
| Add HES to Watchlist: View: Get HES Trend Analysis ➞ | |
 | HLT Hilton Worldwide Holdings Inc. |
| Sector: Services & Goods | |
| SubSector: Lodging | |
| MarketCap: 18064.6 Millions | |
| Recent Price: 197.54 Smart Investing & Trading Score: 32 | |
| Day Percent Change: 0.01% Day Change: 0.01 | |
| Week Change: -2.27% Year-to-date Change: 8.5% | |
| HLT Links: Profile News Message Board | |
| Charts:- Daily , Weekly | |
| Add HLT to Watchlist: View: Get HLT Trend Analysis ➞ | |
 | MLM Martin Marietta Materials, Inc. |
| Sector: Industrials | |
| SubSector: General Building Materials | |
| MarketCap: 10624.3 Millions | |
| Recent Price: 591.03 Smart Investing & Trading Score: 58 | |
| Day Percent Change: 0.18% Day Change: 1.07 | |
| Week Change: -2.31% Year-to-date Change: 18.5% | |
| MLM Links: Profile News Message Board | |
| Charts:- Daily , Weekly | |
| Add MLM to Watchlist: View: Get MLM Trend Analysis ➞ | |
 | NOC Northrop Grumman Corporation |
| Sector: Industrials | |
| SubSector: Aerospace/Defense - Major Diversified | |
| MarketCap: 52094.9 Millions | |
| Recent Price: 469.09 Smart Investing & Trading Score: 63 | |
| Day Percent Change: -1.24% Day Change: -5.91 | |
| Week Change: -2.36% Year-to-date Change: 0.2% | |
| NOC Links: Profile News Message Board | |
| Charts:- Daily , Weekly | |
| Add NOC to Watchlist: View: Get NOC Trend Analysis ➞ | |
 | IPG The Interpublic Group of Companies, Inc. |
| Sector: Services & Goods | |
| SubSector: Advertising Agencies | |
| MarketCap: 5730.55 Millions | |
| Recent Price: 30.72 Smart Investing & Trading Score: 57 | |
| Day Percent Change: 0.62% Day Change: 0.19 | |
| Week Change: -2.38% Year-to-date Change: -5.9% | |
| IPG Links: Profile News Message Board | |
| Charts:- Daily , Weekly | |
| Add IPG to Watchlist: View: Get IPG Trend Analysis ➞ | |
 | MCHP Microchip Technology Incorporated |
| Sector: Technology | |
| SubSector: Semiconductor - Broad Line | |
| MarketCap: 16826.3 Millions | |
| Recent Price: 91.36 Smart Investing & Trading Score: 83 | |
| Day Percent Change: 2.12% Day Change: 1.90 | |
| Week Change: -2.39% Year-to-date Change: 1.3% | |
| MCHP Links: Profile News Message Board | |
| Charts:- Daily , Weekly | |
| Add MCHP to Watchlist: View: Get MCHP Trend Analysis ➞ | |
 | MAR Marriott International, Inc. |
| Sector: Services & Goods | |
| SubSector: Lodging | |
| MarketCap: 25831.6 Millions | |
| Recent Price: 234.59 Smart Investing & Trading Score: 25 | |
| Day Percent Change: -0.41% Day Change: -0.97 | |
| Week Change: -2.6% Year-to-date Change: 4.0% | |
| MAR Links: Profile News Message Board | |
| Charts:- Daily , Weekly | |
| Add MAR to Watchlist: View: Get MAR Trend Analysis ➞ | |
 | COF Capital One Financial Corporation |
| Sector: Financials | |
| SubSector: Credit Services | |
| MarketCap: 23094.2 Millions | |
| Recent Price: 142.41 Smart Investing & Trading Score: 49 | |
| Day Percent Change: 0.42% Day Change: 0.60 | |
| Week Change: -2.6% Year-to-date Change: 8.6% | |
| COF Links: Profile News Message Board | |
| Charts:- Daily , Weekly | |
| Add COF to Watchlist: View: Get COF Trend Analysis ➞ | |
 | LULU Lululemon Athletica Inc. |
| Sector: Consumer Staples | |
| SubSector: Textile - Apparel Clothing | |
| MarketCap: 24627.8 Millions | |
| Recent Price: 355.15 Smart Investing & Trading Score: 25 | |
| Day Percent Change: 1.24% Day Change: 4.35 | |
| Week Change: -2.62% Year-to-date Change: -30.5% | |
| LULU Links: Profile News Message Board | |
| Charts:- Daily , Weekly | |
| Add LULU to Watchlist: View: Get LULU Trend Analysis ➞ | |
 | MCK McKesson Corporation |
| Sector: Services & Goods | |
| SubSector: Drugs Wholesale | |
| MarketCap: 24096.7 Millions | |
| Recent Price: 528.86 Smart Investing & Trading Score: 48 | |
| Day Percent Change: -0.27% Day Change: -1.41 | |
| Week Change: -2.66% Year-to-date Change: 14.2% | |
| MCK Links: Profile News Message Board | |
| Charts:- Daily , Weekly | |
| Add MCK to Watchlist: View: Get MCK Trend Analysis ➞ | |
 | GOOG Alphabet Inc. |
| Sector: Technology | |
| SubSector: Internet Information Providers | |
| MarketCap: 730159 Millions | |
| Recent Price: 168.99 Smart Investing & Trading Score: 95 | |
| Day Percent Change: 0.31% Day Change: 0.53 | |
| Week Change: -2.71% Year-to-date Change: 19.9% | |
| GOOG Links: Profile News Message Board | |
| Charts:- Daily , Weekly | |
| Add GOOG to Watchlist: View: Get GOOG Trend Analysis ➞ | |
 | ABNB Airbnb, Inc. |
| Sector: Technology | |
| SubSector: Internet Content & Information | |
| MarketCap: 86237 Millions | |
| Recent Price: 159.76 Smart Investing & Trading Score: 70 | |
| Day Percent Change: 0.90% Day Change: 1.43 | |
| Week Change: -2.72% Year-to-date Change: 17.3% | |
| ABNB Links: Profile News Message Board | |
| Charts:- Daily , Weekly | |
| Add ABNB to Watchlist: View: Get ABNB Trend Analysis ➞ | |
 | GOOGL Alphabet Inc. |
| Sector: Technology | |
| SubSector: Internet Information Providers | |
| MarketCap: 801264 Millions | |
| Recent Price: 167.24 Smart Investing & Trading Score: 95 | |
| Day Percent Change: 0.37% Day Change: 0.62 | |
| Week Change: -2.74% Year-to-date Change: 19.7% | |
| GOOGL Links: Profile News Message Board | |
| Charts:- Daily , Weekly | |
| Add GOOGL to Watchlist: View: Get GOOGL Trend Analysis ➞ | |
 | BKR Baker Hughes Company |
| Sector: Services & Goods | |
| SubSector: Technical Services | |
| MarketCap: 1330 Millions | |
| Recent Price: 31.92 Smart Investing & Trading Score: 36 | |
| Day Percent Change: -0.03% Day Change: -0.01 | |
| Week Change: -2.8% Year-to-date Change: -6.6% | |
| BKR Links: Profile News Message Board | |
| Charts:- Daily , Weekly | |
| Add BKR to Watchlist: View: Get BKR Trend Analysis ➞ | |
 | F Ford Motor Company |
| Sector: Consumer Staples | |
| SubSector: Auto Manufacturers - Major | |
| MarketCap: 19052.1 Millions | |
| Recent Price: 12.43 Smart Investing & Trading Score: 42 | |
| Day Percent Change: -0.48% Day Change: -0.06 | |
| Week Change: -2.81% Year-to-date Change: 2.0% | |
| F Links: Profile News Message Board | |
| Charts:- Daily , Weekly | |
| Add F to Watchlist: View: Get F Trend Analysis ➞ | |
| For tabular summary view of above stock list: Summary View ➞ 0 - 25 , 25 - 50 , 50 - 75 , 75 - 100 , 100 - 125 , 125 - 150 , 150 - 175 , 175 - 200 , 200 - 225 , 225 - 250 , 250 - 275 , 275 - 300 , 300 - 325 , 325 - 350 , 350 - 375 , 375 - 400 , 400 - 425 , 425 - 450 , 450 - 475 , 475 - 500 | ||
| Click To Change The Sort Order: By Market Cap or Company Size Performance: Year-to-date, Week and Day | |
| Select Chart Type: | ||
|
Best Stocks Today 12Stocks.com |
© 2024 12Stocks.com Terms & Conditions Privacy Contact Us
All Information Provided Only For Education And Not To Be Used For Investing or Trading. See Terms & Conditions


One More Thing ... Get Best Stocks Delivered Daily!
Never Ever Miss A Move With Our Top Ten Stocks Lists
Find Best Stocks In Any Market - Bull or Bear Market
Take A Peek At Our Top Ten Stocks Lists: Daily, Weekly, Year-to-Date & Top Trends
Find Best Stocks In Any Market - Bull or Bear Market
Take A Peek At Our Top Ten Stocks Lists: Daily, Weekly, Year-to-Date & Top Trends
S&P 500 Stocks With Best Up Trends [0-bearish to 100-bullish]: Amgen [100], First Solar[100], Apple [100], Motorola Solutions[100], Camden Property[100], Aptiv [100], Rollins [100], Teradyne [100], Comerica [100], BorgWarner [100], Bio-Techne [100]
Best S&P 500 Stocks Year-to-Date:
NVIDIA [79.29%], Constellation [66.35%], NRG [48.26%], Chipotle Mexican[37.97%], Western Digital[35.48%], Micron [34.4%], Eaton [33.09%], Progressive [31.04%], Leidos Holdings[30.89%], Diamondback [29.93%], Targa Resources[29.29%] Best S&P 500 Stocks This Week:
Bio-Techne [20.65%], Moderna [15.77%], Garmin [15.7%], C.H. Robinson[15.64%], Amgen [15.3%], Aptiv [13.5%], Amcor [11.59%], BorgWarner [9.79%], Albemarle [9.6%], Pfizer [9.49%], Leidos Holdings[8.68%] Best S&P 500 Stocks Daily:
Amgen [11.82%], Enphase [7.67%], Live Nation[7.24%], First Solar[6.12%], Apple [5.98%], Motorola Solutions[5.19%], Digital Realty[4.89%], Constellation [4.87%], Arista Networks[4.79%], Camden Property[4.53%], Aptiv [3.90%]