
 Login Sign Up


| |||||
 |  | ||||

| 12Stocks.com Market Intelligence |
Best S&P 500 Stocks
|
On this page, you will find the most comprehensive analysis of S&P 500 stocks and ETFs - from latest trends to performances to charts ➞. First, here are the year-to-date (YTD) performances of the most requested S&P 500 stocks at 12Stocks.com (click stock for review):
| NVIDIA 66% | ||
| Caterpillar 22% | ||
| Amazon.com 17% | ||
| Merck 16% | ||
| Google 13% | ||
| Walmart 13% | ||
| JPMorgan Chase 12% | ||
| Goldman Sachs 9% | ||
| Chevron 9% | ||
| Microsoft 9% | ||
| Johnson & Johnson -6% | ||
| McDonald s -8% | ||
| Starbucks -8% | ||
| Apple -13% | ||
| Gilead -18% | ||
| Intel -31% | ||
| Boeing -35% | ||
| Quick: S&P 500 Stocks Lists: Performances & Trends, S&P 500 Stock Charts
Sort S&P 500 stocks: Daily, Weekly, Year-to-Date, Market Cap & Trends. Filter S&P 500 stocks list by sector: Show all, Tech, Finance, Energy, Staples, Retail, Industrial, Materials, Utilities and HealthCare |
| 12Stocks.com S&P 500 Stocks Performances & Trends Daily Report | |||||||||
|
| 
The overall Smart Investing & Trading Score is 58 (0-bearish to 100-bullish) which puts S&P 500 index in short term neutral trend. The Smart Investing & Trading Score from previous trading session is 51 and an improvement of trend continues. | ||||||||
Here are the Smart Investing & Trading Scores of the most requested S&P 500 stocks at 12Stocks.com (click stock name for detailed review):
|


| 12Stocks.com: Top Performing S&P 500 Index Stocks | ||||||||||||||||||||||||||||||||||||||||||||||||
 The top performing S&P 500 Index stocks year to date are
Now, more recently, over last week, the top performing S&P 500 Index stocks on the move are


|
||||||||||||||||||||||||||||||||||||||||||||||||
| 12Stocks.com: Investing in S&P 500 Index with Stocks | |
|
The following table helps investors and traders sort through current performance and trends (as measured by Smart Investing & Trading Score) of various
stocks in the S&P 500 Index. Quick View: Move mouse or cursor over stock symbol (ticker) to view short-term technical chart and over stock name to view long term chart. Click on  to add stock symbol to your watchlist and to add stock symbol to your watchlist and  to view watchlist. Click on any ticker or stock name for detailed market intelligence report for that stock. to view watchlist. Click on any ticker or stock name for detailed market intelligence report for that stock. |
12Stocks.com Performance of Stocks in S&P 500 Index
| Ticker | Stock Name | Watchlist | Category | Recent Price | Smart Investing & Trading Score | Change % | Weekly Change% |
| RMD | ResMed |   | Health Care | 184.45 | 42 | 0.12% | 3.13% |
| IRM | Iron Mountain | | Technology | 77.42 | 65 | 1.07% | 3.09% |
| BAX | Baxter | | Health Care | 40.69 | 75 | -0.82% | 3.08% |
| ZBRA | Zebra Technologies | | Technology | 276.26 | 68 | -0.11% | 3.05% |
| RJF | Raymond James | | Financials | 127.36 | 83 | 0.17% | 3.04% |
| POOL | Pool | | Consumer Staples | 372.11 | 45 | -0.77% | 3.04% |
| MS | Morgan Stanley | | Financials | 93.39 | 100 | -0.40% | 3.01% |
| JPM | JPMorgan Chase | | Financials | 191.26 | 63 | -0.46% | 2.94% |
| CAG | Conagra Brands | | Consumer Staples | 31.52 | 93 | 0.78% | 2.92% |
| ISRG | Intuitive Surgical | | Health Care | 377.00 | 45 | -0.02% | 2.91% |
| SJM | J. M. | | Consumer Staples | 118.08 | 74 | 0.33% | 2.90% |
| HBAN | Huntington Bancshares | | Financials | 13.66 | 88 | 0.22% | 2.86% |
| CPRT | Copart | | Services & Goods | 54.38 | 58 | 0.13% | 2.84% |
| OMC | Omnicom | | Services & Goods | 95.22 | 100 | 1.06% | 2.81% |
| KMX | CarMax | | Services & Goods | 70.25 | 32 | 0.80% | 2.79% |
| AMAT | Applied Materials | | Technology | 195.05 | 63 | 0.94% | 2.78% |
| ENPH | Enphase | | Technology | 109.42 | 83 | -3.58% | 2.76% |
| ROK | Rockwell Automation | | Industrials | 277.34 | 76 | 0.37% | 2.73% |
| CPT | Camden Property | | Financials | 98.87 | 93 | 0.27% | 2.68% |
| DHI | D.R. Horton | | Industrials | 146.00 | 58 | -1.37% | 2.68% |
| EFX | Equifax | | Financials | 221.96 | 32 | -1.11% | 2.66% |
| LDOS | Leidos Holdings | | Technology | 128.23 | 78 | -0.35% | 2.66% |
| BWA | BorgWarner | | Consumer Staples | 33.67 | 60 | 0.99% | 2.65% |
| DRI | Darden Restaurants | | Services & Goods | 156.53 | 57 | 0.40% | 2.64% |
| MTB | M&T Bank | | Financials | 147.16 | 93 | 0.20% | 2.64% |
| For chart view version of above stock list: Chart View ➞ 0 - 25 , 25 - 50 , 50 - 75 , 75 - 100 , 100 - 125 , 125 - 150 , 150 - 175 , 175 - 200 , 200 - 225 , 225 - 250 , 250 - 275 , 275 - 300 , 300 - 325 , 325 - 350 , 350 - 375 , 375 - 400 , 400 - 425 , 425 - 450 , 450 - 475 | ||
 | Click To Change The Sort Order: By Market Cap or Company Size Performance: Year-to-date, Week and Day |  |
|
Get the most comprehensive stock market coverage daily at 12Stocks.com ➞ Best Stocks Today ➞ Best Stocks Weekly ➞ Best Stocks Year-to-Date ➞ Best Stocks Trends ➞  Best Stocks Today 12Stocks.com Best Nasdaq Stocks ➞ Best S&P 500 Stocks ➞ Best Tech Stocks ➞ Best Biotech Stocks ➞ |
| Detailed Overview of S&P 500 Stocks |
| S&P 500 Technical Overview, Leaders & Laggards, Top S&P 500 ETF Funds & Detailed S&P 500 Stocks List, Charts, Trends & More |
| S&P 500: Technical Analysis, Trends & YTD Performance | |
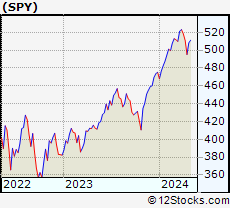
| S&P 500 index as represented by
SPY, an exchange-traded fund [ETF], holds basket of five hundred (mostly largecap) stocks from across all major sectors of the US stock market. The S&P 500 index (contains stocks like Apple and Exxon) is up by 6.15% and is currently outperforming the overall market by 0.81% year-to-date. Below is a quick view of technical charts and trends: | |
 SPY Weekly Chart |
|
| Long Term Trend: Good | |
| Medium Term Trend: Not Good | |
 SPY Daily Chart |
|
| Short Term Trend: Very Good | |
| Overall Trend Score: 58 | |
| YTD Performance: 6.15% | |
| **Trend Scores & Views Are Only For Educational Purposes And Not For Investing | |
| 12Stocks.com: Investing in S&P 500 Index using Exchange Traded Funds | |
|
The following table shows list of key exchange traded funds (ETF) that
help investors track S&P 500 index. The following list also includes leveraged ETF funds that track twice or thrice the daily returns of S&P 500 indices. Short or inverse ETF funds move in the opposite direction to the index they track and are useful during market pullbacks or during bear markets. Quick View: Move mouse or cursor over ETF symbol (ticker) to view short-term technical chart and over ETF name to view long term chart. Click on ticker or stock name for detailed view. Click on to add stock symbol to your watchlist and to view watchlist. |
12Stocks.com List of ETFs that track S&P 500 Index
| Ticker | ETF Name | Watchlist | Recent Price | Smart Investing & Trading Score | Change % | Week % | Year-to-date % |
| SPY | SPDR S&P 500 ETF | | 504.55 | 58 | -0.22 | 1.9 | 6.15% |
| IVV | iShares Core S&P 500 ETF | | 508.76 | 63 | 0.12 | 2.26 | 6.52% |
| VOO | Vanguard 500 ETF | | 465.33 | 63 | 0.11 | 2.25 | 6.53% |
| OEF | iShares S&P 100 | | 239.63 | 58 | -0.13 | 2.11 | 7.27% |
| SSO | ProShares Ultra S&P500 | | 71.69 | 58 | -0.49 | 3.73 | 10.17% |
| UPRO | ProShares UltraPro S&P500 | | 62.49 | 58 | -0.70 | 5.63 | 14.16% |
| SPXL | Direxion Daily S&P500 Bull 3X ETF | | 120.04 | 63 | 0.44 | 6.65 | 15.43% |
| SH | ProShares Short S&P500 | | 12.37 | 42 | 0.20 | -1.79 | -4.81% |
| SDS | ProShares UltraShort S&P500 | | 26.84 | 42 | 0.22 | -3.8 | -10.29% |
| SPXU | ProShares UltraPro Short S&P500 | | 36.25 | 42 | 0.72 | -5.43 | -15.7% |
| SPXS | Direxion Daily S&P 500 Bear 3X ETF | | 9.71 | 32 | -0.41 | -6.27 | -15.93% |
| 12Stocks.com: Charts, Trends, Fundamental Data and Performances of S&P 500 Stocks | |
|
We now take in-depth look at all S&P 500 stocks including charts, multi-period performances and overall trends (as measured by Smart Investing & Trading Score). One can sort S&P 500 stocks (click link to choose) by Daily, Weekly and by Year-to-Date performances. Also, one can sort by size of the company or by market capitalization. |
| Select Your Default Chart Type: | |||||
| |||||
| Click on stock symbol or name for detailed view. Click on to add stock symbol to your watchlist and to view watchlist. Quick View: Move mouse or cursor over "Daily" to quickly view daily technical stock chart and over "Weekly" to view weekly technical stock chart. | |||||

 | RMD ResMed Inc. |
| Sector: Health Care | |
| SubSector: Medical Instruments & Supplies | |
| MarketCap: 18660.2 Millions | |
| Recent Price: 184.45 Smart Investing & Trading Score: 42 | |
| Day Percent Change: 0.12% Day Change: 0.23 | |
| Week Change: 3.13% Year-to-date Change: 7.2% | |
| RMD Links: Profile News Message Board | |
| Charts:- Daily , Weekly | |
| Add RMD to Watchlist: View: Get RMD Trend Analysis ➞ | |
 | IRM Iron Mountain Incorporated |
| Sector: Technology | |
| SubSector: Business Software & Services | |
| MarketCap: 7339.18 Millions | |
| Recent Price: 77.42 Smart Investing & Trading Score: 65 | |
| Day Percent Change: 1.07% Day Change: 0.82 | |
| Week Change: 3.09% Year-to-date Change: 10.6% | |
| IRM Links: Profile News Message Board | |
| Charts:- Daily , Weekly | |
| Add IRM to Watchlist: View: Get IRM Trend Analysis ➞ | |
 | BAX Baxter International Inc. |
| Sector: Health Care | |
| SubSector: Medical Instruments & Supplies | |
| MarketCap: 39955.8 Millions | |
| Recent Price: 40.69 Smart Investing & Trading Score: 75 | |
| Day Percent Change: -0.82% Day Change: -0.34 | |
| Week Change: 3.08% Year-to-date Change: 5.2% | |
| BAX Links: Profile News Message Board | |
| Charts:- Daily , Weekly | |
| Add BAX to Watchlist: View: Get BAX Trend Analysis ➞ | |
 | ZBRA Zebra Technologies Corporation |
| Sector: Technology | |
| SubSector: Communication Equipment | |
| MarketCap: 11474.9 Millions | |
| Recent Price: 276.26 Smart Investing & Trading Score: 68 | |
| Day Percent Change: -0.11% Day Change: -0.31 | |
| Week Change: 3.05% Year-to-date Change: 1.1% | |
| ZBRA Links: Profile News Message Board | |
| Charts:- Daily , Weekly | |
| Add ZBRA to Watchlist: View: Get ZBRA Trend Analysis ➞ | |
 | RJF Raymond James Financial, Inc. |
| Sector: Financials | |
| SubSector: Investment Brokerage - Regional | |
| MarketCap: 9490.65 Millions | |
| Recent Price: 127.36 Smart Investing & Trading Score: 83 | |
| Day Percent Change: 0.17% Day Change: 0.22 | |
| Week Change: 3.04% Year-to-date Change: 14.2% | |
| RJF Links: Profile News Message Board | |
| Charts:- Daily , Weekly | |
| Add RJF to Watchlist: View: Get RJF Trend Analysis ➞ | |
 | POOL Pool Corporation |
| Sector: Consumer Staples | |
| SubSector: Sporting Goods | |
| MarketCap: 7479.64 Millions | |
| Recent Price: 372.11 Smart Investing & Trading Score: 45 | |
| Day Percent Change: -0.77% Day Change: -2.88 | |
| Week Change: 3.04% Year-to-date Change: -6.7% | |
| POOL Links: Profile News Message Board | |
| Charts:- Daily , Weekly | |
| Add POOL to Watchlist: View: Get POOL Trend Analysis ➞ | |
 | MS Morgan Stanley |
| Sector: Financials | |
| SubSector: Investment Brokerage - National | |
| MarketCap: 55876.7 Millions | |
| Recent Price: 93.39 Smart Investing & Trading Score: 100 | |
| Day Percent Change: -0.40% Day Change: -0.38 | |
| Week Change: 3.01% Year-to-date Change: 0.1% | |
| MS Links: Profile News Message Board | |
| Charts:- Daily , Weekly | |
| Add MS to Watchlist: View: Get MS Trend Analysis ➞ | |
 | JPM JPMorgan Chase & Co. |
| Sector: Financials | |
| SubSector: Money Center Banks | |
| MarketCap: 279736 Millions | |
| Recent Price: 191.26 Smart Investing & Trading Score: 63 | |
| Day Percent Change: -0.46% Day Change: -0.88 | |
| Week Change: 2.94% Year-to-date Change: 12.4% | |
| JPM Links: Profile News Message Board | |
| Charts:- Daily , Weekly | |
| Add JPM to Watchlist: View: Get JPM Trend Analysis ➞ | |
 | CAG Conagra Brands, Inc. |
| Sector: Consumer Staples | |
| SubSector: Processed & Packaged Goods | |
| MarketCap: 14084.1 Millions | |
| Recent Price: 31.52 Smart Investing & Trading Score: 93 | |
| Day Percent Change: 0.78% Day Change: 0.25 | |
| Week Change: 2.92% Year-to-date Change: 10.0% | |
| CAG Links: Profile News Message Board | |
| Charts:- Daily , Weekly | |
| Add CAG to Watchlist: View: Get CAG Trend Analysis ➞ | |
 | ISRG Intuitive Surgical, Inc. |
| Sector: Health Care | |
| SubSector: Medical Instruments & Supplies | |
| MarketCap: 50917.5 Millions | |
| Recent Price: 377.00 Smart Investing & Trading Score: 45 | |
| Day Percent Change: -0.02% Day Change: -0.08 | |
| Week Change: 2.91% Year-to-date Change: 11.8% | |
| ISRG Links: Profile News Message Board | |
| Charts:- Daily , Weekly | |
| Add ISRG to Watchlist: View: Get ISRG Trend Analysis ➞ | |
 | SJM The J. M. Smucker Company |
| Sector: Consumer Staples | |
| SubSector: Processed & Packaged Goods | |
| MarketCap: 12635.8 Millions | |
| Recent Price: 118.08 Smart Investing & Trading Score: 74 | |
| Day Percent Change: 0.33% Day Change: 0.38 | |
| Week Change: 2.9% Year-to-date Change: -6.6% | |
| SJM Links: Profile News Message Board | |
| Charts:- Daily , Weekly | |
| Add SJM to Watchlist: View: Get SJM Trend Analysis ➞ | |
 | HBAN Huntington Bancshares Incorporated |
| Sector: Financials | |
| SubSector: Regional - Midwest Banks | |
| MarketCap: 8468.1 Millions | |
| Recent Price: 13.66 Smart Investing & Trading Score: 88 | |
| Day Percent Change: 0.22% Day Change: 0.03 | |
| Week Change: 2.86% Year-to-date Change: 7.4% | |
| HBAN Links: Profile News Message Board | |
| Charts:- Daily , Weekly | |
| Add HBAN to Watchlist: View: Get HBAN Trend Analysis ➞ | |
 | CPRT Copart, Inc. |
| Sector: Services & Goods | |
| SubSector: Auto Dealerships | |
| MarketCap: 15462.1 Millions | |
| Recent Price: 54.38 Smart Investing & Trading Score: 58 | |
| Day Percent Change: 0.13% Day Change: 0.07 | |
| Week Change: 2.84% Year-to-date Change: 11.0% | |
| CPRT Links: Profile News Message Board | |
| Charts:- Daily , Weekly | |
| Add CPRT to Watchlist: View: Get CPRT Trend Analysis ➞ | |
 | OMC Omnicom Group Inc. |
| Sector: Services & Goods | |
| SubSector: Advertising Agencies | |
| MarketCap: 11813.5 Millions | |
| Recent Price: 95.22 Smart Investing & Trading Score: 100 | |
| Day Percent Change: 1.06% Day Change: 1.00 | |
| Week Change: 2.81% Year-to-date Change: 10.1% | |
| OMC Links: Profile News Message Board | |
| Charts:- Daily , Weekly | |
| Add OMC to Watchlist: View: Get OMC Trend Analysis ➞ | |
 | KMX CarMax, Inc. |
| Sector: Services & Goods | |
| SubSector: Auto Dealerships | |
| MarketCap: 8121.71 Millions | |
| Recent Price: 70.25 Smart Investing & Trading Score: 32 | |
| Day Percent Change: 0.80% Day Change: 0.56 | |
| Week Change: 2.79% Year-to-date Change: -8.5% | |
| KMX Links: Profile News Message Board | |
| Charts:- Daily , Weekly | |
| Add KMX to Watchlist: View: Get KMX Trend Analysis ➞ | |
 | AMAT Applied Materials, Inc. |
| Sector: Technology | |
| SubSector: Semiconductor Equipment & Materials | |
| MarketCap: 40593.8 Millions | |
| Recent Price: 195.05 Smart Investing & Trading Score: 63 | |
| Day Percent Change: 0.94% Day Change: 1.81 | |
| Week Change: 2.78% Year-to-date Change: 20.4% | |
| AMAT Links: Profile News Message Board | |
| Charts:- Daily , Weekly | |
| Add AMAT to Watchlist: View: Get AMAT Trend Analysis ➞ | |
 | ENPH Enphase Energy, Inc. |
| Sector: Technology | |
| SubSector: Semiconductor Equipment & Materials | |
| MarketCap: 4047.48 Millions | |
| Recent Price: 109.42 Smart Investing & Trading Score: 83 | |
| Day Percent Change: -3.58% Day Change: -4.06 | |
| Week Change: 2.76% Year-to-date Change: -17.2% | |
| ENPH Links: Profile News Message Board | |
| Charts:- Daily , Weekly | |
| Add ENPH to Watchlist: View: Get ENPH Trend Analysis ➞ | |
 | ROK Rockwell Automation, Inc. |
| Sector: Industrials | |
| SubSector: Diversified Machinery | |
| MarketCap: 15666.1 Millions | |
| Recent Price: 277.34 Smart Investing & Trading Score: 76 | |
| Day Percent Change: 0.37% Day Change: 1.01 | |
| Week Change: 2.73% Year-to-date Change: -10.7% | |
| ROK Links: Profile News Message Board | |
| Charts:- Daily , Weekly | |
| Add ROK to Watchlist: View: Get ROK Trend Analysis ➞ | |
 | CPT Camden Property Trust |
| Sector: Financials | |
| SubSector: REIT - Residential | |
| MarketCap: 7535.21 Millions | |
| Recent Price: 98.87 Smart Investing & Trading Score: 93 | |
| Day Percent Change: 0.27% Day Change: 0.27 | |
| Week Change: 2.68% Year-to-date Change: -0.4% | |
| CPT Links: Profile News Message Board | |
| Charts:- Daily , Weekly | |
| Add CPT to Watchlist: View: Get CPT Trend Analysis ➞ | |
 | DHI D.R. Horton, Inc. |
| Sector: Industrials | |
| SubSector: Residential Construction | |
| MarketCap: 13372.6 Millions | |
| Recent Price: 146.00 Smart Investing & Trading Score: 58 | |
| Day Percent Change: -1.37% Day Change: -2.03 | |
| Week Change: 2.68% Year-to-date Change: -3.9% | |
| DHI Links: Profile News Message Board | |
| Charts:- Daily , Weekly | |
| Add DHI to Watchlist: View: Get DHI Trend Analysis ➞ | |
 | EFX Equifax Inc. |
| Sector: Financials | |
| SubSector: Credit Services | |
| MarketCap: 13754.6 Millions | |
| Recent Price: 221.96 Smart Investing & Trading Score: 32 | |
| Day Percent Change: -1.11% Day Change: -2.50 | |
| Week Change: 2.66% Year-to-date Change: -10.2% | |
| EFX Links: Profile News Message Board | |
| Charts:- Daily , Weekly | |
| Add EFX to Watchlist: View: Get EFX Trend Analysis ➞ | |
 | LDOS Leidos Holdings, Inc. |
| Sector: Technology | |
| SubSector: Information Technology Services | |
| MarketCap: 11707.5 Millions | |
| Recent Price: 128.23 Smart Investing & Trading Score: 78 | |
| Day Percent Change: -0.35% Day Change: -0.45 | |
| Week Change: 2.66% Year-to-date Change: 18.5% | |
| LDOS Links: Profile News Message Board | |
| Charts:- Daily , Weekly | |
| Add LDOS to Watchlist: View: Get LDOS Trend Analysis ➞ | |
 | BWA BorgWarner Inc. |
| Sector: Consumer Staples | |
| SubSector: Auto Parts | |
| MarketCap: 4604.09 Millions | |
| Recent Price: 33.67 Smart Investing & Trading Score: 60 | |
| Day Percent Change: 0.99% Day Change: 0.33 | |
| Week Change: 2.65% Year-to-date Change: -6.1% | |
| BWA Links: Profile News Message Board | |
| Charts:- Daily , Weekly | |
| Add BWA to Watchlist: View: Get BWA Trend Analysis ➞ | |
 | DRI Darden Restaurants, Inc. |
| Sector: Services & Goods | |
| SubSector: Restaurants | |
| MarketCap: 5623.1 Millions | |
| Recent Price: 156.53 Smart Investing & Trading Score: 57 | |
| Day Percent Change: 0.40% Day Change: 0.63 | |
| Week Change: 2.64% Year-to-date Change: -4.7% | |
| DRI Links: Profile News Message Board | |
| Charts:- Daily , Weekly | |
| Add DRI to Watchlist: View: Get DRI Trend Analysis ➞ | |
 | MTB M&T Bank Corporation |
| Sector: Financials | |
| SubSector: Regional - Northeast Banks | |
| MarketCap: 13950.9 Millions | |
| Recent Price: 147.16 Smart Investing & Trading Score: 93 | |
| Day Percent Change: 0.20% Day Change: 0.30 | |
| Week Change: 2.64% Year-to-date Change: 7.4% | |
| MTB Links: Profile News Message Board | |
| Charts:- Daily , Weekly | |
| Add MTB to Watchlist: View: Get MTB Trend Analysis ➞ | |
| For tabular summary view of above stock list: Summary View ➞ 0 - 25 , 25 - 50 , 50 - 75 , 75 - 100 , 100 - 125 , 125 - 150 , 150 - 175 , 175 - 200 , 200 - 225 , 225 - 250 , 250 - 275 , 275 - 300 , 300 - 325 , 325 - 350 , 350 - 375 , 375 - 400 , 400 - 425 , 425 - 450 , 450 - 475 | ||
| Click To Change The Sort Order: By Market Cap or Company Size Performance: Year-to-date, Week and Day | |
| Select Chart Type: | ||
|
Best Stocks Today 12Stocks.com |
© 2024 12Stocks.com Terms & Conditions Privacy Contact Us
All Information Provided Only For Education And Not To Be Used For Investing or Trading. See Terms & Conditions


One More Thing ... Get Best Stocks Delivered Daily!
Never Ever Miss A Move With Our Top Ten Stocks Lists
Find Best Stocks In Any Market - Bull or Bear Market
Take A Peek At Our Top Ten Stocks Lists: Daily, Weekly, Year-to-Date & Top Trends
Find Best Stocks In Any Market - Bull or Bear Market
Take A Peek At Our Top Ten Stocks Lists: Daily, Weekly, Year-to-Date & Top Trends
S&P 500 Stocks With Best Up Trends [0-bearish to 100-bullish]: Hasbro [100], Wabtec [100], Texas Instruments[100], Boston Scientific[100], Analog Devices[100], Microchip [100], EQT [100], Synchrony Financial[100], Equity Residential[100], Essex Property[100], UDR [100]
Best S&P 500 Stocks Year-to-Date:
NVIDIA [65.69%], Constellation [59.4%], NRG [40.19%], Meta Platforms[39.28%], Progressive [33.59%], Targa Resources[33.28%], Marathon [33.13%], Diamondback [32.05%], Eaton [31.49%], Western Digital[30.58%], Micron [29.04%] Best S&P 500 Stocks This Week:
Hasbro [18.51%], Wabtec [12.21%], Tesla [10.36%], Texas Instruments[10.25%], Microchip [10%], NXP Semiconductors[8.95%], Boston Scientific[8.84%], Analog Devices[8.62%], CoStar [8.08%], NVIDIA [7.68%], Kimberly-Clark [7.33%] Best S&P 500 Stocks Daily:
Hasbro [12.66%], Tesla [12.16%], Wabtec [8.95%], CoStar [7.62%], Texas Instruments[6.40%], Boston Scientific[6.22%], ON Semiconductor[5.52%], Hilton Worldwide[5.33%], Analog Devices[4.86%], Biogen [4.77%], Microchip [4.25%]