
 Login Sign Up


| |||||
 |  | ||||

| 12Stocks.com Market Intelligence |
Best S&P 500 Stocks
|
On this page, you will find the most comprehensive analysis of S&P 500 stocks and ETFs - from latest trends to performances to charts ➞. First, here are the year-to-date (YTD) performances of the most requested S&P 500 stocks at 12Stocks.com (click stock for review):
| NVIDIA 66% | ||
| Caterpillar 22% | ||
| Amazon.com 17% | ||
| Merck 16% | ||
| Google 13% | ||
| Walmart 13% | ||
| JPMorgan Chase 12% | ||
| Goldman Sachs 9% | ||
| Chevron 9% | ||
| Microsoft 9% | ||
| Johnson & Johnson -6% | ||
| McDonald s -8% | ||
| Starbucks -8% | ||
| Apple -13% | ||
| Gilead -18% | ||
| Intel -31% | ||
| Boeing -35% | ||
| Quick: S&P 500 Stocks Lists: Performances & Trends, S&P 500 Stock Charts
Sort S&P 500 stocks: Daily, Weekly, Year-to-Date, Market Cap & Trends. Filter S&P 500 stocks list by sector: Show all, Tech, Finance, Energy, Staples, Retail, Industrial, Materials, Utilities and HealthCare |
| 12Stocks.com S&P 500 Stocks Performances & Trends Daily Report | |||||||||
|
| 
The overall Smart Investing & Trading Score is 58 (0-bearish to 100-bullish) which puts S&P 500 index in short term neutral trend. The Smart Investing & Trading Score from previous trading session is 51 and an improvement of trend continues. | ||||||||
Here are the Smart Investing & Trading Scores of the most requested S&P 500 stocks at 12Stocks.com (click stock name for detailed review):
|


| 12Stocks.com: Top Performing S&P 500 Index Stocks | ||||||||||||||||||||||||||||||||||||||||||||||||
 The top performing S&P 500 Index stocks year to date are
Now, more recently, over last week, the top performing S&P 500 Index stocks on the move are


|
||||||||||||||||||||||||||||||||||||||||||||||||
| 12Stocks.com: Investing in S&P 500 Index with Stocks | |
|
The following table helps investors and traders sort through current performance and trends (as measured by Smart Investing & Trading Score) of various
stocks in the S&P 500 Index. Quick View: Move mouse or cursor over stock symbol (ticker) to view short-term technical chart and over stock name to view long term chart. Click on  to add stock symbol to your watchlist and to add stock symbol to your watchlist and  to view watchlist. Click on any ticker or stock name for detailed market intelligence report for that stock. to view watchlist. Click on any ticker or stock name for detailed market intelligence report for that stock. |
12Stocks.com Performance of Stocks in S&P 500 Index
| Ticker | Stock Name | Watchlist | Category | Recent Price | Smart Investing & Trading Score | Change % | Weekly Change% |
| IPG | Interpublic |   | Services & Goods | 31.30 | 25 | 0.98% | 1.87% |
| TECH | Bio-Techne | | Health Care | 63.28 | 42 | -0.64% | 1.87% |
| UAL | United Airlines | | Transports | 52.34 | 95 | -3.13% | 1.87% |
| ABNB | Airbnb | | Technology | 161.98 | 85 | 0.64% | 1.86% |
| JCI | Johnson Controls | | Consumer Staples | 64.84 | 76 | -0.51% | 1.85% |
| CMA | Comerica | | Financials | 52.51 | 73 | -0.25% | 1.84% |
| AAPL | Apple | | Technology | 168.02 | 42 | 0.67% | 1.83% |
| MO | Altria | | Consumer Staples | 42.85 | 93 | -0.05% | 1.81% |
| AMGN | Amgen | | Health Care | 273.79 | 64 | 0.09% | 1.81% |
| D | Dominion | | Utilities | 50.74 | 88 | 0.14% | 1.81% |
| MHK | Mohawk Industries | | Consumer Staples | 110.85 | 63 | -2.29% | 1.80% |
| TROW | T. Rowe | | Financials | 110.68 | 61 | -1.13% | 1.79% |
| FITB | Fifth Third | | Financials | 36.89 | 100 | -0.46% | 1.77% |
| EBAY | eBay | | Services & Goods | 51.27 | 68 | 0.03% | 1.74% |
| CDW | CDW | | Technology | 239.88 | 58 | -0.25% | 1.74% |
| ARE | Alexandria Real | | Financials | 117.69 | 35 | -1.51% | 1.73% |
| NTAP | NetApp | | Technology | 99.64 | 63 | 0.22% | 1.73% |
| PG | Procter & Gamble | | Consumer Staples | 160.86 | 93 | -0.40% | 1.72% |
| MET | MetLife | | Financials | 72.32 | 68 | 0.14% | 1.70% |
| COST | Costco Wholesale | | Services & Goods | 721.42 | 80 | -0.17% | 1.68% |
| SRE | Sempra | | Utilities | 71.25 | 75 | -0.38% | 1.67% |
| MSI | Motorola Solutions | | Technology | 345.28 | 68 | -0.08% | 1.66% |
| VFC | V.F | | Consumer Staples | 13.04 | 54 | 0.69% | 1.64% |
| CL | Colgate-Palmolive | | Consumer Staples | 88.55 | 71 | -0.03% | 1.63% |
| AMT | American Tower | | Financials | 174.09 | 32 | -0.05% | 1.63% |
| For chart view version of above stock list: Chart View ➞ 0 - 25 , 25 - 50 , 50 - 75 , 75 - 100 , 100 - 125 , 125 - 150 , 150 - 175 , 175 - 200 , 200 - 225 , 225 - 250 , 250 - 275 , 275 - 300 , 300 - 325 , 325 - 350 , 350 - 375 , 375 - 400 , 400 - 425 , 425 - 450 , 450 - 475 | ||
 | Click To Change The Sort Order: By Market Cap or Company Size Performance: Year-to-date, Week and Day |  |
|
Get the most comprehensive stock market coverage daily at 12Stocks.com ➞ Best Stocks Today ➞ Best Stocks Weekly ➞ Best Stocks Year-to-Date ➞ Best Stocks Trends ➞  Best Stocks Today 12Stocks.com Best Nasdaq Stocks ➞ Best S&P 500 Stocks ➞ Best Tech Stocks ➞ Best Biotech Stocks ➞ |
| Detailed Overview of S&P 500 Stocks |
| S&P 500 Technical Overview, Leaders & Laggards, Top S&P 500 ETF Funds & Detailed S&P 500 Stocks List, Charts, Trends & More |
| S&P 500: Technical Analysis, Trends & YTD Performance | |
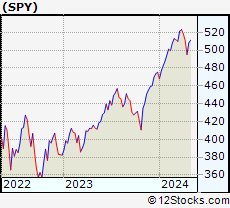
| S&P 500 index as represented by
SPY, an exchange-traded fund [ETF], holds basket of five hundred (mostly largecap) stocks from across all major sectors of the US stock market. The S&P 500 index (contains stocks like Apple and Exxon) is up by 6.15% and is currently outperforming the overall market by 0.81% year-to-date. Below is a quick view of technical charts and trends: | |
 SPY Weekly Chart |
|
| Long Term Trend: Good | |
| Medium Term Trend: Not Good | |
 SPY Daily Chart |
|
| Short Term Trend: Very Good | |
| Overall Trend Score: 58 | |
| YTD Performance: 6.15% | |
| **Trend Scores & Views Are Only For Educational Purposes And Not For Investing | |
| 12Stocks.com: Investing in S&P 500 Index using Exchange Traded Funds | |
|
The following table shows list of key exchange traded funds (ETF) that
help investors track S&P 500 index. The following list also includes leveraged ETF funds that track twice or thrice the daily returns of S&P 500 indices. Short or inverse ETF funds move in the opposite direction to the index they track and are useful during market pullbacks or during bear markets. Quick View: Move mouse or cursor over ETF symbol (ticker) to view short-term technical chart and over ETF name to view long term chart. Click on ticker or stock name for detailed view. Click on to add stock symbol to your watchlist and to view watchlist. |
12Stocks.com List of ETFs that track S&P 500 Index
| Ticker | ETF Name | Watchlist | Recent Price | Smart Investing & Trading Score | Change % | Week % | Year-to-date % |
| SPY | SPDR S&P 500 ETF | | 504.55 | 58 | -0.22 | 1.9 | 6.15% |
| IVV | iShares Core S&P 500 ETF | | 508.76 | 63 | 0.12 | 2.26 | 6.52% |
| VOO | Vanguard 500 ETF | | 465.33 | 63 | 0.11 | 2.25 | 6.53% |
| OEF | iShares S&P 100 | | 239.63 | 58 | -0.13 | 2.11 | 7.27% |
| SSO | ProShares Ultra S&P500 | | 71.69 | 63 | -0.49 | 3.73 | 10.17% |
| UPRO | ProShares UltraPro S&P500 | | 62.49 | 58 | -0.70 | 5.63 | 14.16% |
| SPXL | Direxion Daily S&P500 Bull 3X ETF | | 120.04 | 63 | 0.44 | 6.65 | 15.43% |
| SH | ProShares Short S&P500 | | 12.37 | 42 | 0.20 | -1.79 | -4.81% |
| SDS | ProShares UltraShort S&P500 | | 26.84 | 37 | 0.22 | -3.8 | -10.29% |
| SPXU | ProShares UltraPro Short S&P500 | | 36.25 | 42 | 0.72 | -5.43 | -15.7% |
| SPXS | Direxion Daily S&P 500 Bear 3X ETF | | 9.71 | 32 | -0.41 | -6.27 | -15.93% |
| 12Stocks.com: Charts, Trends, Fundamental Data and Performances of S&P 500 Stocks | |
|
We now take in-depth look at all S&P 500 stocks including charts, multi-period performances and overall trends (as measured by Smart Investing & Trading Score). One can sort S&P 500 stocks (click link to choose) by Daily, Weekly and by Year-to-Date performances. Also, one can sort by size of the company or by market capitalization. |
| Select Your Default Chart Type: | |||||
| |||||
| Click on stock symbol or name for detailed view. Click on to add stock symbol to your watchlist and to view watchlist. Quick View: Move mouse or cursor over "Daily" to quickly view daily technical stock chart and over "Weekly" to view weekly technical stock chart. | |||||

 | IPG The Interpublic Group of Companies, Inc. |
| Sector: Services & Goods | |
| SubSector: Advertising Agencies | |
| MarketCap: 5730.55 Millions | |
| Recent Price: 31.30 Smart Investing & Trading Score: 25 | |
| Day Percent Change: 0.98% Day Change: 0.31 | |
| Week Change: 1.87% Year-to-date Change: -4.1% | |
| IPG Links: Profile News Message Board | |
| Charts:- Daily , Weekly | |
| Add IPG to Watchlist: View: Get IPG Trend Analysis ➞ | |
 | TECH Bio-Techne Corporation |
| Sector: Health Care | |
| SubSector: Biotechnology | |
| MarketCap: 6958.05 Millions | |
| Recent Price: 63.28 Smart Investing & Trading Score: 42 | |
| Day Percent Change: -0.64% Day Change: -0.41 | |
| Week Change: 1.87% Year-to-date Change: -18.0% | |
| TECH Links: Profile News Message Board | |
| Charts:- Daily , Weekly | |
| Add TECH to Watchlist: View: Get TECH Trend Analysis ➞ | |
 | UAL United Airlines Holdings, Inc. |
| Sector: Transports | |
| SubSector: Major Airlines | |
| MarketCap: 8083.25 Millions | |
| Recent Price: 52.34 Smart Investing & Trading Score: 95 | |
| Day Percent Change: -3.13% Day Change: -1.69 | |
| Week Change: 1.87% Year-to-date Change: 26.9% | |
| UAL Links: Profile News Message Board | |
| Charts:- Daily , Weekly | |
| Add UAL to Watchlist: View: Get UAL Trend Analysis ➞ | |
 | ABNB Airbnb, Inc. |
| Sector: Technology | |
| SubSector: Internet Content & Information | |
| MarketCap: 86237 Millions | |
| Recent Price: 161.98 Smart Investing & Trading Score: 85 | |
| Day Percent Change: 0.64% Day Change: 1.03 | |
| Week Change: 1.86% Year-to-date Change: 19.0% | |
| ABNB Links: Profile News Message Board | |
| Charts:- Daily , Weekly | |
| Add ABNB to Watchlist: View: Get ABNB Trend Analysis ➞ | |
 | JCI Johnson Controls International plc |
| Sector: Consumer Staples | |
| SubSector: Auto Parts | |
| MarketCap: 21950.7 Millions | |
| Recent Price: 64.84 Smart Investing & Trading Score: 76 | |
| Day Percent Change: -0.51% Day Change: -0.33 | |
| Week Change: 1.85% Year-to-date Change: 12.5% | |
| JCI Links: Profile News Message Board | |
| Charts:- Daily , Weekly | |
| Add JCI to Watchlist: View: Get JCI Trend Analysis ➞ | |
 | CMA Comerica Incorporated |
| Sector: Financials | |
| SubSector: Money Center Banks | |
| MarketCap: 4449.49 Millions | |
| Recent Price: 52.51 Smart Investing & Trading Score: 73 | |
| Day Percent Change: -0.25% Day Change: -0.13 | |
| Week Change: 1.84% Year-to-date Change: -5.9% | |
| CMA Links: Profile News Message Board | |
| Charts:- Daily , Weekly | |
| Add CMA to Watchlist: View: Get CMA Trend Analysis ➞ | |
 | AAPL Apple Inc. |
| Sector: Technology | |
| SubSector: Electronic Equipment | |
| MarketCap: 1112940 Millions | |
| Recent Price: 168.02 Smart Investing & Trading Score: 42 | |
| Day Percent Change: 0.67% Day Change: 1.12 | |
| Week Change: 1.83% Year-to-date Change: -12.7% | |
| AAPL Links: Profile News Message Board | |
| Charts:- Daily , Weekly | |
| Add AAPL to Watchlist: View: Get AAPL Trend Analysis ➞ | |
 | MO Altria Group, Inc. |
| Sector: Consumer Staples | |
| SubSector: Cigarettes | |
| MarketCap: 70806.3 Millions | |
| Recent Price: 42.85 Smart Investing & Trading Score: 93 | |
| Day Percent Change: -0.05% Day Change: -0.02 | |
| Week Change: 1.81% Year-to-date Change: 6.2% | |
| MO Links: Profile News Message Board | |
| Charts:- Daily , Weekly | |
| Add MO to Watchlist: View: Get MO Trend Analysis ➞ | |
 | AMGN Amgen Inc. |
| Sector: Health Care | |
| SubSector: Biotechnology | |
| MarketCap: 121030 Millions | |
| Recent Price: 273.79 Smart Investing & Trading Score: 64 | |
| Day Percent Change: 0.09% Day Change: 0.25 | |
| Week Change: 1.81% Year-to-date Change: -4.9% | |
| AMGN Links: Profile News Message Board | |
| Charts:- Daily , Weekly | |
| Add AMGN to Watchlist: View: Get AMGN Trend Analysis ➞ | |
 | D Dominion Energy, Inc. |
| Sector: Utilities | |
| SubSector: Electric Utilities | |
| MarketCap: 62365.3 Millions | |
| Recent Price: 50.74 Smart Investing & Trading Score: 88 | |
| Day Percent Change: 0.14% Day Change: 0.07 | |
| Week Change: 1.81% Year-to-date Change: 8.0% | |
| D Links: Profile News Message Board | |
| Charts:- Daily , Weekly | |
| Add D to Watchlist: View: Get D Trend Analysis ➞ | |
 | MHK Mohawk Industries, Inc. |
| Sector: Consumer Staples | |
| SubSector: Home Furnishings & Fixtures | |
| MarketCap: 4682.25 Millions | |
| Recent Price: 110.85 Smart Investing & Trading Score: 63 | |
| Day Percent Change: -2.29% Day Change: -2.59 | |
| Week Change: 1.8% Year-to-date Change: 7.1% | |
| MHK Links: Profile News Message Board | |
| Charts:- Daily , Weekly | |
| Add MHK to Watchlist: View: Get MHK Trend Analysis ➞ | |
 | TROW T. Rowe Price Group, Inc. |
| Sector: Financials | |
| SubSector: Asset Management | |
| MarketCap: 24530 Millions | |
| Recent Price: 110.68 Smart Investing & Trading Score: 61 | |
| Day Percent Change: -1.13% Day Change: -1.27 | |
| Week Change: 1.79% Year-to-date Change: 2.8% | |
| TROW Links: Profile News Message Board | |
| Charts:- Daily , Weekly | |
| Add TROW to Watchlist: View: Get TROW Trend Analysis ➞ | |
 | FITB Fifth Third Bancorp |
| Sector: Financials | |
| SubSector: Regional - Midwest Banks | |
| MarketCap: 10197 Millions | |
| Recent Price: 36.89 Smart Investing & Trading Score: 100 | |
| Day Percent Change: -0.46% Day Change: -0.17 | |
| Week Change: 1.77% Year-to-date Change: 7.0% | |
| FITB Links: Profile News Message Board | |
| Charts:- Daily , Weekly | |
| Add FITB to Watchlist: View: Get FITB Trend Analysis ➞ | |
 | EBAY eBay Inc. |
| Sector: Services & Goods | |
| SubSector: Specialty Retail, Other | |
| MarketCap: 23152.3 Millions | |
| Recent Price: 51.27 Smart Investing & Trading Score: 68 | |
| Day Percent Change: 0.03% Day Change: 0.02 | |
| Week Change: 1.74% Year-to-date Change: 17.5% | |
| EBAY Links: Profile News Message Board | |
| Charts:- Daily , Weekly | |
| Add EBAY to Watchlist: View: Get EBAY Trend Analysis ➞ | |
 | CDW CDW Corporation |
| Sector: Technology | |
| SubSector: Information Technology Services | |
| MarketCap: 12775 Millions | |
| Recent Price: 239.88 Smart Investing & Trading Score: 58 | |
| Day Percent Change: -0.25% Day Change: -0.59 | |
| Week Change: 1.74% Year-to-date Change: 5.5% | |
| CDW Links: Profile News Message Board | |
| Charts:- Daily , Weekly | |
| Add CDW to Watchlist: View: Get CDW Trend Analysis ➞ | |
 | ARE Alexandria Real Estate Equities, Inc. |
| Sector: Financials | |
| SubSector: REIT - Office | |
| MarketCap: 16793.6 Millions | |
| Recent Price: 117.69 Smart Investing & Trading Score: 35 | |
| Day Percent Change: -1.51% Day Change: -1.80 | |
| Week Change: 1.73% Year-to-date Change: -7.2% | |
| ARE Links: Profile News Message Board | |
| Charts:- Daily , Weekly | |
| Add ARE to Watchlist: View: Get ARE Trend Analysis ➞ | |
 | NTAP NetApp, Inc. |
| Sector: Technology | |
| SubSector: Data Storage Devices | |
| MarketCap: 9028.89 Millions | |
| Recent Price: 99.64 Smart Investing & Trading Score: 63 | |
| Day Percent Change: 0.22% Day Change: 0.22 | |
| Week Change: 1.73% Year-to-date Change: 13.0% | |
| NTAP Links: Profile News Message Board | |
| Charts:- Daily , Weekly | |
| Add NTAP to Watchlist: View: Get NTAP Trend Analysis ➞ | |
 | PG The Procter & Gamble Company |
| Sector: Consumer Staples | |
| SubSector: Personal Products | |
| MarketCap: 277162 Millions | |
| Recent Price: 160.86 Smart Investing & Trading Score: 93 | |
| Day Percent Change: -0.40% Day Change: -0.64 | |
| Week Change: 1.72% Year-to-date Change: 9.8% | |
| PG Links: Profile News Message Board | |
| Charts:- Daily , Weekly | |
| Add PG to Watchlist: View: Get PG Trend Analysis ➞ | |
 | MET MetLife, Inc. |
| Sector: Financials | |
| SubSector: Life Insurance | |
| MarketCap: 26272.9 Millions | |
| Recent Price: 72.32 Smart Investing & Trading Score: 68 | |
| Day Percent Change: 0.14% Day Change: 0.10 | |
| Week Change: 1.7% Year-to-date Change: 9.4% | |
| MET Links: Profile News Message Board | |
| Charts:- Daily , Weekly | |
| Add MET to Watchlist: View: Get MET Trend Analysis ➞ | |
 | COST Costco Wholesale Corporation |
| Sector: Services & Goods | |
| SubSector: Discount, Variety Stores | |
| MarketCap: 136355 Millions | |
| Recent Price: 721.42 Smart Investing & Trading Score: 80 | |
| Day Percent Change: -0.17% Day Change: -1.26 | |
| Week Change: 1.68% Year-to-date Change: 9.3% | |
| COST Links: Profile News Message Board | |
| Charts:- Daily , Weekly | |
| Add COST to Watchlist: View: Get COST Trend Analysis ➞ | |
 | SRE Sempra Energy |
| Sector: Utilities | |
| SubSector: Diversified Utilities | |
| MarketCap: 34339.9 Millions | |
| Recent Price: 71.25 Smart Investing & Trading Score: 75 | |
| Day Percent Change: -0.38% Day Change: -0.27 | |
| Week Change: 1.67% Year-to-date Change: -4.7% | |
| SRE Links: Profile News Message Board | |
| Charts:- Daily , Weekly | |
| Add SRE to Watchlist: View: Get SRE Trend Analysis ➞ | |
 | MSI Motorola Solutions, Inc. |
| Sector: Technology | |
| SubSector: Communication Equipment | |
| MarketCap: 26573.3 Millions | |
| Recent Price: 345.28 Smart Investing & Trading Score: 68 | |
| Day Percent Change: -0.08% Day Change: -0.27 | |
| Week Change: 1.66% Year-to-date Change: 10.3% | |
| MSI Links: Profile News Message Board | |
| Charts:- Daily , Weekly | |
| Add MSI to Watchlist: View: Get MSI Trend Analysis ➞ | |
 | VFC V.F. Corporation |
| Sector: Consumer Staples | |
| SubSector: Textile - Apparel Clothing | |
| MarketCap: 23607.5 Millions | |
| Recent Price: 13.04 Smart Investing & Trading Score: 54 | |
| Day Percent Change: 0.69% Day Change: 0.09 | |
| Week Change: 1.64% Year-to-date Change: -30.6% | |
| VFC Links: Profile News Message Board | |
| Charts:- Daily , Weekly | |
| Add VFC to Watchlist: View: Get VFC Trend Analysis ➞ | |
 | CL Colgate-Palmolive Company |
| Sector: Consumer Staples | |
| SubSector: Personal Products | |
| MarketCap: 57242.7 Millions | |
| Recent Price: 88.55 Smart Investing & Trading Score: 71 | |
| Day Percent Change: -0.03% Day Change: -0.03 | |
| Week Change: 1.63% Year-to-date Change: 11.1% | |
| CL Links: Profile News Message Board | |
| Charts:- Daily , Weekly | |
| Add CL to Watchlist: View: Get CL Trend Analysis ➞ | |
 | AMT American Tower Corporation (REIT) |
| Sector: Financials | |
| SubSector: REIT - Diversified | |
| MarketCap: 92527 Millions | |
| Recent Price: 174.09 Smart Investing & Trading Score: 32 | |
| Day Percent Change: -0.05% Day Change: -0.09 | |
| Week Change: 1.63% Year-to-date Change: -19.4% | |
| AMT Links: Profile News Message Board | |
| Charts:- Daily , Weekly | |
| Add AMT to Watchlist: View: Get AMT Trend Analysis ➞ | |
| For tabular summary view of above stock list: Summary View ➞ 0 - 25 , 25 - 50 , 50 - 75 , 75 - 100 , 100 - 125 , 125 - 150 , 150 - 175 , 175 - 200 , 200 - 225 , 225 - 250 , 250 - 275 , 275 - 300 , 300 - 325 , 325 - 350 , 350 - 375 , 375 - 400 , 400 - 425 , 425 - 450 , 450 - 475 | ||
| Click To Change The Sort Order: By Market Cap or Company Size Performance: Year-to-date, Week and Day | |
| Select Chart Type: | ||
|
Best Stocks Today 12Stocks.com |
© 2024 12Stocks.com Terms & Conditions Privacy Contact Us
All Information Provided Only For Education And Not To Be Used For Investing or Trading. See Terms & Conditions


One More Thing ... Get Best Stocks Delivered Daily!
Never Ever Miss A Move With Our Top Ten Stocks Lists
Find Best Stocks In Any Market - Bull or Bear Market
Take A Peek At Our Top Ten Stocks Lists: Daily, Weekly, Year-to-Date & Top Trends
Find Best Stocks In Any Market - Bull or Bear Market
Take A Peek At Our Top Ten Stocks Lists: Daily, Weekly, Year-to-Date & Top Trends
S&P 500 Stocks With Best Up Trends [0-bearish to 100-bullish]: Hasbro [100], Wabtec [100], Texas Instruments[100], Boston Scientific[100], Analog Devices[100], Microchip [100], EQT [100], Synchrony Financial[100], Equity Residential[100], Citizens Financial[100], Generac Holdings[100]
Best S&P 500 Stocks Year-to-Date:
NVIDIA [65.69%], Constellation [59.4%], NRG [40.19%], Meta Platforms[39.28%], Progressive [33.59%], Targa Resources[33.28%], Marathon [33.13%], Diamondback [32.05%], Eaton [31.49%], Western Digital[30.58%], Micron [29.04%] Best S&P 500 Stocks This Week:
Hasbro [18.51%], Wabtec [12.21%], Tesla [10.36%], Texas Instruments[10.25%], Microchip [10%], NXP Semiconductors[8.95%], Boston Scientific[8.84%], Analog Devices[8.62%], CoStar [8.08%], NVIDIA [7.68%], Kimberly-Clark [7.33%] Best S&P 500 Stocks Daily:
Hasbro [12.66%], Tesla [12.16%], Wabtec [8.95%], CoStar [7.62%], Texas Instruments[6.40%], Boston Scientific[6.22%], ON Semiconductor[5.52%], Hilton Worldwide[5.33%], Analog Devices[4.86%], Biogen [4.77%], Microchip [4.25%]