
 Login Sign Up


| |||||
 |  | ||||

| 12Stocks.com Market Intelligence |
Best S&P 500 Stocks
|
On this page, you will find the most comprehensive analysis of S&P 500 stocks and ETFs - from latest trends to performances to charts ➞. First, here are the year-to-date (YTD) performances of the most requested S&P 500 stocks at 12Stocks.com (click stock for review):
| NVIDIA 61% | ||
| Caterpillar 23% | ||
| Merck 17% | ||
| Amazon.com 16% | ||
| Walmart 14% | ||
| Google 13% | ||
| JPMorgan Chase 13% | ||
| Goldman Sachs 10% | ||
| Chevron 9% | ||
| Microsoft 9% | ||
| Johnson & Johnson -5% | ||
| McDonald s -7% | ||
| Starbucks -8% | ||
| Apple -13% | ||
| Gilead -17% | ||
| Intel -31% | ||
| Boeing -37% | ||
| Quick: S&P 500 Stocks Lists: Performances & Trends, S&P 500 Stock Charts
Sort S&P 500 stocks: Daily, Weekly, Year-to-Date, Market Cap & Trends. Filter S&P 500 stocks list by sector: Show all, Tech, Finance, Energy, Staples, Retail, Industrial, Materials, Utilities and HealthCare |
| 12Stocks.com S&P 500 Stocks Performances & Trends Daily Report | |||||||||
|
| 
The overall Smart Investing & Trading Score is 58 (0-bearish to 100-bullish) which puts S&P 500 index in short term neutral trend. The Smart Investing & Trading Score from previous trading session is 51 and an improvement of trend continues. | ||||||||
Here are the Smart Investing & Trading Scores of the most requested S&P 500 stocks at 12Stocks.com (click stock name for detailed review):
|


| 12Stocks.com: Top Performing S&P 500 Index Stocks | ||||||||||||||||||||||||||||||||||||||||||||||||
 The top performing S&P 500 Index stocks year to date are
Now, more recently, over last week, the top performing S&P 500 Index stocks on the move are


|
||||||||||||||||||||||||||||||||||||||||||||||||
| 12Stocks.com: Investing in S&P 500 Index with Stocks | |
|
The following table helps investors and traders sort through current performance and trends (as measured by Smart Investing & Trading Score) of various
stocks in the S&P 500 Index. Quick View: Move mouse or cursor over stock symbol (ticker) to view short-term technical chart and over stock name to view long term chart. Click on  to add stock symbol to your watchlist and to add stock symbol to your watchlist and  to view watchlist. Click on any ticker or stock name for detailed market intelligence report for that stock. to view watchlist. Click on any ticker or stock name for detailed market intelligence report for that stock. |
12Stocks.com Performance of Stocks in S&P 500 Index
| Ticker | Stock Name | Watchlist | Category | Recent Price | Smart Investing & Trading Score | Change % | Weekly Change% |
| META | Meta Platforms |   | Technology | 493.06 | 56 | -0.58% | 2.49% |
| T | AT&T | | Technology | 16.92 | 32 | 2.55% | 2.48% |
| HES | Hess | | Energy | 158.16 | 93 | 0.78% | 2.47% |
| MLM | Martin Marietta | | Industrials | 590.11 | 63 | -0.72% | 2.47% |
| CRM | salesforce.com | | Technology | 277.02 | 32 | 0.12% | 2.46% |
| REG | Regency Centers | | Financials | 59.80 | 64 | -0.47% | 2.45% |
| DRI | Darden Restaurants | | Services & Goods | 156.22 | 57 | 0.21% | 2.44% |
| DLR | Digital Realty | | Financials | 140.17 | 45 | 1.18% | 2.44% |
| WELL | Welltower | | Financials | 93.55 | 73 | 0.67% | 2.44% |
| SO | Southern | | Utilities | 73.89 | 93 | 0.88% | 2.42% |
| UPS | United Parcel | | Transports | 146.21 | 68 | -1.79% | 2.41% |
| BWA | BorgWarner | | Consumer Staples | 33.59 | 60 | 0.75% | 2.41% |
| INVH | Invitation Homes | | Financials | 34.38 | 68 | 0.73% | 2.41% |
| FITB | Fifth Third | | Financials | 37.12 | 100 | 0.16% | 2.40% |
| CMG | Chipotle Mexican | | Services & Goods | 2937.99 | 83 | 0.79% | 2.40% |
| GRMN | Garmin | | Technology | 142.85 | 63 | 0.24% | 2.39% |
| AWK | American Water | | Utilities | 121.35 | 67 | 1.23% | 2.39% |
| NWSA | News | | Services & Goods | 24.59 | 45 | -0.06% | 2.39% |
| MSFT | Microsoft | | Technology | 408.61 | 58 | 0.26% | 2.38% |
| CMA | Comerica | | Financials | 52.77 | 73 | 0.26% | 2.36% |
| ADBE | Adobe | | Technology | 475.98 | 42 | 0.65% | 2.36% |
| AEP | American Electric | | Utilities | 86.18 | 100 | 0.72% | 2.35% |
| APTV | Aptiv | | Consumer Staples | 71.25 | 10 | 1.42% | 2.33% |
| CDW | CDW | | Technology | 241.25 | 58 | 0.32% | 2.32% |
| SCHW | Charles Schwab | | Financials | 75.11 | 100 | -0.15% | 2.31% |
| For chart view version of above stock list: Chart View ➞ 0 - 25 , 25 - 50 , 50 - 75 , 75 - 100 , 100 - 125 , 125 - 150 , 150 - 175 , 175 - 200 , 200 - 225 , 225 - 250 , 250 - 275 , 275 - 300 , 300 - 325 , 325 - 350 , 350 - 375 , 375 - 400 , 400 - 425 , 425 - 450 , 450 - 475 , 475 - 500 | ||
 | Click To Change The Sort Order: By Market Cap or Company Size Performance: Year-to-date, Week and Day |  |
|
Get the most comprehensive stock market coverage daily at 12Stocks.com ➞ Best Stocks Today ➞ Best Stocks Weekly ➞ Best Stocks Year-to-Date ➞ Best Stocks Trends ➞  Best Stocks Today 12Stocks.com Best Nasdaq Stocks ➞ Best S&P 500 Stocks ➞ Best Tech Stocks ➞ Best Biotech Stocks ➞ |
| Detailed Overview of S&P 500 Stocks |
| S&P 500 Technical Overview, Leaders & Laggards, Top S&P 500 ETF Funds & Detailed S&P 500 Stocks List, Charts, Trends & More |
| S&P 500: Technical Analysis, Trends & YTD Performance | |
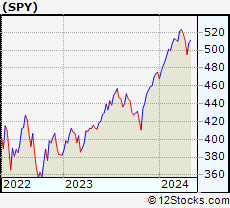
| S&P 500 index as represented by
SPY, an exchange-traded fund [ETF], holds basket of five hundred (mostly largecap) stocks from across all major sectors of the US stock market. The S&P 500 index (contains stocks like Apple and Exxon) is up by 6.24% and is currently outperforming the overall market by 0.75% year-to-date. Below is a quick view of technical charts and trends: | |
 SPY Weekly Chart |
|
| Long Term Trend: Good | |
| Medium Term Trend: Not Good | |
 SPY Daily Chart |
|
| Short Term Trend: Very Good | |
| Overall Trend Score: 58 | |
| YTD Performance: 6.24% | |
| **Trend Scores & Views Are Only For Educational Purposes And Not For Investing | |
| 12Stocks.com: Investing in S&P 500 Index using Exchange Traded Funds | |
|
The following table shows list of key exchange traded funds (ETF) that
help investors track S&P 500 index. The following list also includes leveraged ETF funds that track twice or thrice the daily returns of S&P 500 indices. Short or inverse ETF funds move in the opposite direction to the index they track and are useful during market pullbacks or during bear markets. Quick View: Move mouse or cursor over ETF symbol (ticker) to view short-term technical chart and over ETF name to view long term chart. Click on ticker or stock name for detailed view. Click on to add stock symbol to your watchlist and to view watchlist. |
12Stocks.com List of ETFs that track S&P 500 Index
| Ticker | ETF Name | Watchlist | Recent Price | Smart Investing & Trading Score | Change % | Week % | Year-to-date % |
| SPY | SPDR S&P 500 ETF | | 504.96 | 58 | -0.14 | 1.98 | 6.24% |
| IVV | iShares Core S&P 500 ETF | | 507.44 | 63 | -0.14 | 1.99 | 6.24% |
| VOO | Vanguard 500 ETF | | 464.13 | 63 | -0.15 | 1.99 | 6.26% |
| OEF | iShares S&P 100 | | 239.64 | 58 | -0.13 | 2.11 | 7.27% |
| SSO | ProShares Ultra S&P500 | | 71.84 | 58 | -0.28 | 3.95 | 10.4% |
| UPRO | ProShares UltraPro S&P500 | | 62.70 | 58 | -0.37 | 5.98 | 14.54% |
| SPXL | Direxion Daily S&P500 Bull 3X ETF | | 119.11 | 63 | -0.33 | 5.83 | 14.54% |
| SH | ProShares Short S&P500 | | 12.35 | 42 | 0.08 | -1.91 | -4.93% |
| SDS | ProShares UltraShort S&P500 | | 26.84 | 42 | 0.22 | -3.8 | -10.29% |
| SPXU | ProShares UltraPro Short S&P500 | | 36.17 | 42 | 0.51 | -5.62 | -15.87% |
| SPXS | Direxion Daily S&P 500 Bear 3X ETF | | 9.78 | 32 | 0.31 | -5.6 | -15.32% |
| 12Stocks.com: Charts, Trends, Fundamental Data and Performances of S&P 500 Stocks | |
|
We now take in-depth look at all S&P 500 stocks including charts, multi-period performances and overall trends (as measured by Smart Investing & Trading Score). One can sort S&P 500 stocks (click link to choose) by Daily, Weekly and by Year-to-Date performances. Also, one can sort by size of the company or by market capitalization. |
| Select Your Default Chart Type: | |||||
| |||||
| Click on stock symbol or name for detailed view. Click on to add stock symbol to your watchlist and to view watchlist. Quick View: Move mouse or cursor over "Daily" to quickly view daily technical stock chart and over "Weekly" to view weekly technical stock chart. | |||||

 | META Meta Platforms, Inc. |
| Sector: Technology | |
| SubSector: Internet Content & Information | |
| MarketCap: 732990 Millions | |
| Recent Price: 493.06 Smart Investing & Trading Score: 56 | |
| Day Percent Change: -0.58% Day Change: -2.88 | |
| Week Change: 2.49% Year-to-date Change: 39.3% | |
| META Links: Profile News Message Board | |
| Charts:- Daily , Weekly | |
| Add META to Watchlist: View: Get META Trend Analysis ➞ | |
 | T AT&T Inc. |
| Sector: Technology | |
| SubSector: Telecom Services - Domestic | |
| MarketCap: 224847 Millions | |
| Recent Price: 16.92 Smart Investing & Trading Score: 32 | |
| Day Percent Change: 2.55% Day Change: 0.42 | |
| Week Change: 2.48% Year-to-date Change: 0.8% | |
| T Links: Profile News Message Board | |
| Charts:- Daily , Weekly | |
| Add T to Watchlist: View: Get T Trend Analysis ➞ | |
 | HES Hess Corporation |
| Sector: Energy | |
| SubSector: Independent Oil & Gas | |
| MarketCap: 10465.3 Millions | |
| Recent Price: 158.16 Smart Investing & Trading Score: 93 | |
| Day Percent Change: 0.78% Day Change: 1.22 | |
| Week Change: 2.47% Year-to-date Change: 9.7% | |
| HES Links: Profile News Message Board | |
| Charts:- Daily , Weekly | |
| Add HES to Watchlist: View: Get HES Trend Analysis ➞ | |
 | MLM Martin Marietta Materials, Inc. |
| Sector: Industrials | |
| SubSector: General Building Materials | |
| MarketCap: 10624.3 Millions | |
| Recent Price: 590.11 Smart Investing & Trading Score: 63 | |
| Day Percent Change: -0.72% Day Change: -4.28 | |
| Week Change: 2.47% Year-to-date Change: 18.3% | |
| MLM Links: Profile News Message Board | |
| Charts:- Daily , Weekly | |
| Add MLM to Watchlist: View: Get MLM Trend Analysis ➞ | |
 | CRM salesforce.com, inc. |
| Sector: Technology | |
| SubSector: Application Software | |
| MarketCap: 137120 Millions | |
| Recent Price: 277.02 Smart Investing & Trading Score: 32 | |
| Day Percent Change: 0.12% Day Change: 0.34 | |
| Week Change: 2.46% Year-to-date Change: 5.3% | |
| CRM Links: Profile News Message Board | |
| Charts:- Daily , Weekly | |
| Add CRM to Watchlist: View: Get CRM Trend Analysis ➞ | |
 | REG Regency Centers Corporation |
| Sector: Financials | |
| SubSector: REIT - Retail | |
| MarketCap: 6345.84 Millions | |
| Recent Price: 59.80 Smart Investing & Trading Score: 64 | |
| Day Percent Change: -0.47% Day Change: -0.28 | |
| Week Change: 2.45% Year-to-date Change: -10.8% | |
| REG Links: Profile News Message Board | |
| Charts:- Daily , Weekly | |
| Add REG to Watchlist: View: Get REG Trend Analysis ➞ | |
 | DRI Darden Restaurants, Inc. |
| Sector: Services & Goods | |
| SubSector: Restaurants | |
| MarketCap: 5623.1 Millions | |
| Recent Price: 156.22 Smart Investing & Trading Score: 57 | |
| Day Percent Change: 0.21% Day Change: 0.32 | |
| Week Change: 2.44% Year-to-date Change: -4.9% | |
| DRI Links: Profile News Message Board | |
| Charts:- Daily , Weekly | |
| Add DRI to Watchlist: View: Get DRI Trend Analysis ➞ | |
 | DLR Digital Realty Trust, Inc. |
| Sector: Financials | |
| SubSector: REIT - Office | |
| MarketCap: 27038.6 Millions | |
| Recent Price: 140.17 Smart Investing & Trading Score: 45 | |
| Day Percent Change: 1.18% Day Change: 1.64 | |
| Week Change: 2.44% Year-to-date Change: 4.2% | |
| DLR Links: Profile News Message Board | |
| Charts:- Daily , Weekly | |
| Add DLR to Watchlist: View: Get DLR Trend Analysis ➞ | |
 | WELL Welltower Inc. |
| Sector: Financials | |
| SubSector: REIT - Healthcare Facilities | |
| MarketCap: 21398.8 Millions | |
| Recent Price: 93.55 Smart Investing & Trading Score: 73 | |
| Day Percent Change: 0.67% Day Change: 0.62 | |
| Week Change: 2.44% Year-to-date Change: 3.8% | |
| WELL Links: Profile News Message Board | |
| Charts:- Daily , Weekly | |
| Add WELL to Watchlist: View: Get WELL Trend Analysis ➞ | |
 | SO The Southern Company |
| Sector: Utilities | |
| SubSector: Electric Utilities | |
| MarketCap: 54483.6 Millions | |
| Recent Price: 73.89 Smart Investing & Trading Score: 93 | |
| Day Percent Change: 0.88% Day Change: 0.64 | |
| Week Change: 2.42% Year-to-date Change: 5.4% | |
| SO Links: Profile News Message Board | |
| Charts:- Daily , Weekly | |
| Add SO to Watchlist: View: Get SO Trend Analysis ➞ | |
 | UPS United Parcel Service, Inc. |
| Sector: Transports | |
| SubSector: Air Delivery & Freight Services | |
| MarketCap: 81928.9 Millions | |
| Recent Price: 146.21 Smart Investing & Trading Score: 68 | |
| Day Percent Change: -1.79% Day Change: -2.66 | |
| Week Change: 2.41% Year-to-date Change: -7.0% | |
| UPS Links: Profile News Message Board | |
| Charts:- Daily , Weekly | |
| Add UPS to Watchlist: View: Get UPS Trend Analysis ➞ | |
 | BWA BorgWarner Inc. |
| Sector: Consumer Staples | |
| SubSector: Auto Parts | |
| MarketCap: 4604.09 Millions | |
| Recent Price: 33.59 Smart Investing & Trading Score: 60 | |
| Day Percent Change: 0.75% Day Change: 0.25 | |
| Week Change: 2.41% Year-to-date Change: -6.3% | |
| BWA Links: Profile News Message Board | |
| Charts:- Daily , Weekly | |
| Add BWA to Watchlist: View: Get BWA Trend Analysis ➞ | |
 | INVH Invitation Homes Inc. |
| Sector: Financials | |
| SubSector: Real Estate Development | |
| MarketCap: 9782.89 Millions | |
| Recent Price: 34.38 Smart Investing & Trading Score: 68 | |
| Day Percent Change: 0.73% Day Change: 0.25 | |
| Week Change: 2.41% Year-to-date Change: 0.8% | |
| INVH Links: Profile News Message Board | |
| Charts:- Daily , Weekly | |
| Add INVH to Watchlist: View: Get INVH Trend Analysis ➞ | |
 | FITB Fifth Third Bancorp |
| Sector: Financials | |
| SubSector: Regional - Midwest Banks | |
| MarketCap: 10197 Millions | |
| Recent Price: 37.12 Smart Investing & Trading Score: 100 | |
| Day Percent Change: 0.16% Day Change: 0.06 | |
| Week Change: 2.4% Year-to-date Change: 7.6% | |
| FITB Links: Profile News Message Board | |
| Charts:- Daily , Weekly | |
| Add FITB to Watchlist: View: Get FITB Trend Analysis ➞ | |
 | CMG Chipotle Mexican Grill, Inc. |
| Sector: Services & Goods | |
| SubSector: Restaurants | |
| MarketCap: 16849.9 Millions | |
| Recent Price: 2937.99 Smart Investing & Trading Score: 83 | |
| Day Percent Change: 0.79% Day Change: 22.99 | |
| Week Change: 2.4% Year-to-date Change: 28.5% | |
| CMG Links: Profile News Message Board | |
| Charts:- Daily , Weekly | |
| Add CMG to Watchlist: View: Get CMG Trend Analysis ➞ | |
 | GRMN Garmin Ltd. |
| Sector: Technology | |
| SubSector: Scientific & Technical Instruments | |
| MarketCap: 13909.3 Millions | |
| Recent Price: 142.85 Smart Investing & Trading Score: 63 | |
| Day Percent Change: 0.24% Day Change: 0.34 | |
| Week Change: 2.39% Year-to-date Change: 11.1% | |
| GRMN Links: Profile News Message Board | |
| Charts:- Daily , Weekly | |
| Add GRMN to Watchlist: View: Get GRMN Trend Analysis ➞ | |
 | AWK American Water Works Company, Inc. |
| Sector: Utilities | |
| SubSector: Water Utilities | |
| MarketCap: 20029.2 Millions | |
| Recent Price: 121.35 Smart Investing & Trading Score: 67 | |
| Day Percent Change: 1.23% Day Change: 1.48 | |
| Week Change: 2.39% Year-to-date Change: -8.1% | |
| AWK Links: Profile News Message Board | |
| Charts:- Daily , Weekly | |
| Add AWK to Watchlist: View: Get AWK Trend Analysis ➞ | |
 | NWSA News Corporation |
| Sector: Services & Goods | |
| SubSector: Broadcasting - TV | |
| MarketCap: 5857.53 Millions | |
| Recent Price: 24.59 Smart Investing & Trading Score: 45 | |
| Day Percent Change: -0.06% Day Change: -0.02 | |
| Week Change: 2.39% Year-to-date Change: 0.2% | |
| NWSA Links: Profile News Message Board | |
| Charts:- Daily , Weekly | |
| Add NWSA to Watchlist: View: Get NWSA Trend Analysis ➞ | |
 | MSFT Microsoft Corporation |
| Sector: Technology | |
| SubSector: Business Software & Services | |
| MarketCap: 1154150 Millions | |
| Recent Price: 408.61 Smart Investing & Trading Score: 58 | |
| Day Percent Change: 0.26% Day Change: 1.04 | |
| Week Change: 2.38% Year-to-date Change: 8.7% | |
| MSFT Links: Profile News Message Board | |
| Charts:- Daily , Weekly | |
| Add MSFT to Watchlist: View: Get MSFT Trend Analysis ➞ | |
 | CMA Comerica Incorporated |
| Sector: Financials | |
| SubSector: Money Center Banks | |
| MarketCap: 4449.49 Millions | |
| Recent Price: 52.77 Smart Investing & Trading Score: 73 | |
| Day Percent Change: 0.26% Day Change: 0.13 | |
| Week Change: 2.36% Year-to-date Change: -5.4% | |
| CMA Links: Profile News Message Board | |
| Charts:- Daily , Weekly | |
| Add CMA to Watchlist: View: Get CMA Trend Analysis ➞ | |
 | ADBE Adobe Inc. |
| Sector: Technology | |
| SubSector: Application Software | |
| MarketCap: 157868 Millions | |
| Recent Price: 475.98 Smart Investing & Trading Score: 42 | |
| Day Percent Change: 0.65% Day Change: 3.08 | |
| Week Change: 2.36% Year-to-date Change: -20.2% | |
| ADBE Links: Profile News Message Board | |
| Charts:- Daily , Weekly | |
| Add ADBE to Watchlist: View: Get ADBE Trend Analysis ➞ | |
 | AEP American Electric Power Company, Inc. |
| Sector: Utilities | |
| SubSector: Electric Utilities | |
| MarketCap: 38380 Millions | |
| Recent Price: 86.18 Smart Investing & Trading Score: 100 | |
| Day Percent Change: 0.72% Day Change: 0.62 | |
| Week Change: 2.35% Year-to-date Change: 6.1% | |
| AEP Links: Profile News Message Board | |
| Charts:- Daily , Weekly | |
| Add AEP to Watchlist: View: Get AEP Trend Analysis ➞ | |
 | APTV Aptiv PLC |
| Sector: Consumer Staples | |
| SubSector: Auto Parts | |
| MarketCap: 13047.9 Millions | |
| Recent Price: 71.25 Smart Investing & Trading Score: 10 | |
| Day Percent Change: 1.42% Day Change: 1.00 | |
| Week Change: 2.33% Year-to-date Change: -20.6% | |
| APTV Links: Profile News Message Board | |
| Charts:- Daily , Weekly | |
| Add APTV to Watchlist: View: Get APTV Trend Analysis ➞ | |
 | CDW CDW Corporation |
| Sector: Technology | |
| SubSector: Information Technology Services | |
| MarketCap: 12775 Millions | |
| Recent Price: 241.25 Smart Investing & Trading Score: 58 | |
| Day Percent Change: 0.32% Day Change: 0.78 | |
| Week Change: 2.32% Year-to-date Change: 6.1% | |
| CDW Links: Profile News Message Board | |
| Charts:- Daily , Weekly | |
| Add CDW to Watchlist: View: Get CDW Trend Analysis ➞ | |
 | SCHW The Charles Schwab Corporation |
| Sector: Financials | |
| SubSector: Investment Brokerage - National | |
| MarketCap: 45115.8 Millions | |
| Recent Price: 75.11 Smart Investing & Trading Score: 100 | |
| Day Percent Change: -0.15% Day Change: -0.12 | |
| Week Change: 2.31% Year-to-date Change: 9.2% | |
| SCHW Links: Profile News Message Board | |
| Charts:- Daily , Weekly | |
| Add SCHW to Watchlist: View: Get SCHW Trend Analysis ➞ | |
| For tabular summary view of above stock list: Summary View ➞ 0 - 25 , 25 - 50 , 50 - 75 , 75 - 100 , 100 - 125 , 125 - 150 , 150 - 175 , 175 - 200 , 200 - 225 , 225 - 250 , 250 - 275 , 275 - 300 , 300 - 325 , 325 - 350 , 350 - 375 , 375 - 400 , 400 - 425 , 425 - 450 , 450 - 475 , 475 - 500 | ||
| Click To Change The Sort Order: By Market Cap or Company Size Performance: Year-to-date, Week and Day | |
| Select Chart Type: | ||
|
Best Stocks Today 12Stocks.com |
© 2024 12Stocks.com Terms & Conditions Privacy Contact Us
All Information Provided Only For Education And Not To Be Used For Investing or Trading. See Terms & Conditions


One More Thing ... Get Best Stocks Delivered Daily!
Never Ever Miss A Move With Our Top Ten Stocks Lists
Find Best Stocks In Any Market - Bull or Bear Market
Take A Peek At Our Top Ten Stocks Lists: Daily, Weekly, Year-to-Date & Top Trends
Find Best Stocks In Any Market - Bull or Bear Market
Take A Peek At Our Top Ten Stocks Lists: Daily, Weekly, Year-to-Date & Top Trends
S&P 500 Stocks With Best Up Trends [0-bearish to 100-bullish]: Hasbro [100], Wabtec [100], Boston Scientific[100], Texas Instruments[100], Synchrony Financial[100], EQT [100], Microchip [100], Equity Residential[100], Analog Devices[100], Essex Property[100], UDR [100]
Best S&P 500 Stocks Year-to-Date:
NVIDIA [61.14%], Constellation [59.4%], NRG [40.98%], Meta Platforms[39.28%], Targa Resources[34.05%], Marathon [33.41%], Progressive [33.29%], Western Digital[32.14%], Eaton [32.09%], Diamondback [31.84%], Micron [30.09%] Best S&P 500 Stocks This Week:
Globe Life[23.01%], Hasbro [17.18%], Wabtec [13.26%], Microchip [9.78%], Tesla [9.57%], Texas Instruments[8.95%], CoStar [8.9%], Boston Scientific[8.76%], Kimberly-Clark [8.44%], Synchrony Financial[8.37%], NXP Semiconductors[8.29%] Best S&P 500 Stocks Daily:
Hasbro [11.39%], Tesla [11.36%], Wabtec [9.97%], CoStar [8.44%], Globe Life[8.37%], Boston Scientific[6.15%], ON Semiconductor[5.38%], Texas Instruments[5.14%], Synchrony Financial[5.11%], MSCI [5.03%], Hilton Worldwide[4.23%]