
 Login Sign Up


| |||||
 |  | ||||

| 12Stocks.com Market Intelligence |
Best S&P 500 Stocks
|
On this page, you will find the most comprehensive analysis of S&P 500 stocks and ETFs - from latest trends to performances to charts ➞. First, here are the year-to-date (YTD) performances of the most requested S&P 500 stocks at 12Stocks.com (click stock for review):
| NVIDIA 68% | ||
| Merck 18% | ||
| Amazon.com 18% | ||
| Google 17% | ||
| JPMorgan Chase 13% | ||
| Walmart 12% | ||
| Caterpillar 12% | ||
| Goldman Sachs 11% | ||
| Chevron 7% | ||
| Microsoft 5% | ||
| Johnson & Johnson -4% | ||
| McDonald s -7% | ||
| Apple -12% | ||
| Gilead -19% | ||
| Starbucks -22% | ||
| Boeing -34% | ||
| Intel -40% | ||
| Quick: S&P 500 Stocks Lists: Performances & Trends, S&P 500 Stock Charts
Sort S&P 500 stocks: Daily, Weekly, Year-to-Date, Market Cap & Trends. Filter S&P 500 stocks list by sector: Show all, Tech, Finance, Energy, Staples, Retail, Industrial, Materials, Utilities and HealthCare |
| 12Stocks.com S&P 500 Stocks Performances & Trends Daily Report | |||||||||
|
| 
The overall Smart Investing & Trading Score is 7 (0-bearish to 100-bullish) which puts S&P 500 index in short term bearish trend. The Smart Investing & Trading Score from previous trading session is 41 and hence a deterioration of trend. | ||||||||
Here are the Smart Investing & Trading Scores of the most requested S&P 500 stocks at 12Stocks.com (click stock name for detailed review):
|


| 12Stocks.com: Top Performing S&P 500 Index Stocks | ||||||||||||||||||||||||||||||||||||||||||||||||
 The top performing S&P 500 Index stocks year to date are
Now, more recently, over last week, the top performing S&P 500 Index stocks on the move are


|
||||||||||||||||||||||||||||||||||||||||||||||||
| 12Stocks.com: Investing in S&P 500 Index with Stocks | |
|
The following table helps investors and traders sort through current performance and trends (as measured by Smart Investing & Trading Score) of various
stocks in the S&P 500 Index. Quick View: Move mouse or cursor over stock symbol (ticker) to view short-term technical chart and over stock name to view long term chart. Click on  to add stock symbol to your watchlist and to add stock symbol to your watchlist and  to view watchlist. Click on any ticker or stock name for detailed market intelligence report for that stock. to view watchlist. Click on any ticker or stock name for detailed market intelligence report for that stock. |
12Stocks.com Performance of Stocks in S&P 500 Index
| Ticker | Stock Name | Watchlist | Category | Recent Price | Smart Investing & Trading Score | Change % | Weekly Change% |
| CTSH | Cognizant |   | Technology | 65.37 | 0 | -0.47% | -2.35% |
| CNC | Centene | | Health Care | 72.25 | 15 | -1.11% | -2.36% |
| KMI | Kinder Morgan | | Energy | 18.23 | 44 | -0.27% | -2.41% |
| ITW | Illinois Tool | | Industrials | 242.27 | 0 | -0.75% | -2.42% |
| KEYS | Keysight Technologies | | Technology | 144.95 | 7 | -2.02% | -2.42% |
| EW | Edwards Life | | Health Care | 84.30 | 28 | -0.44% | -2.46% |
| CSGP | CoStar | | Financials | 90.36 | 41 | -1.28% | -2.47% |
| NVR | NVR | | Industrials | 7457.00 | 7 | 0.24% | -2.49% |
| CMI | Cummins | | Industrials | 283.87 | 31 | 0.49% | -2.50% |
| VRSN | VeriSign | | Technology | 171.08 | 0 | 0.94% | -2.51% |
| CF | CF Industries | | Materials | 77.97 | 25 | -1.27% | -2.54% |
| LYB | LyondellBasell Industries | | Materials | 99.52 | 20 | -0.45% | -2.56% |
| TRMB | Trimble | | Technology | 58.59 | 12 | -2.46% | -2.59% |
| DLTR | Dollar Tree | | Services & Goods | 118.56 | 17 | 0.26% | -2.61% |
| V | Visa | | Financials | 267.32 | 0 | -0.48% | -2.62% |
| TJX | TJX | | Services & Goods | 93.82 | 15 | -0.29% | -2.64% |
| WY | Weyerhaeuser | | Industrials | 30.20 | 10 | 0.10% | -2.74% |
| CDNS | Cadence Design | | Technology | 274.55 | 10 | -0.39% | -2.78% |
| MSFT | Microsoft | | Technology | 394.94 | 10 | 1.44% | -2.80% |
| LULU | Lululemon Athletica | | Consumer Staples | 354.40 | 25 | -1.72% | -2.82% |
| ADM | Archer-Daniels-Midland | | Consumer Staples | 58.37 | 36 | -0.49% | -2.88% |
| BKR | Baker Hughes | | Services & Goods | 31.89 | 26 | -2.24% | -2.89% |
| MAR | Marriott | | Services & Goods | 233.86 | 0 | -0.96% | -2.90% |
| GM | General Motors | | Consumer Staples | 44.47 | 58 | -0.13% | -2.99% |
| BKNG | Booking Holdings | | Services & Goods | 3415.64 | 0 | -1.05% | -2.99% |
| For chart view version of above stock list: Chart View ➞ 0 - 25 , 25 - 50 , 50 - 75 , 75 - 100 , 100 - 125 , 125 - 150 , 150 - 175 , 175 - 200 , 200 - 225 , 225 - 250 , 250 - 275 , 275 - 300 , 300 - 325 , 325 - 350 , 350 - 375 , 375 - 400 , 400 - 425 , 425 - 450 , 450 - 475 , 475 - 500 | ||
 | Click To Change The Sort Order: By Market Cap or Company Size Performance: Year-to-date, Week and Day |  |
|
Get the most comprehensive stock market coverage daily at 12Stocks.com ➞ Best Stocks Today ➞ Best Stocks Weekly ➞ Best Stocks Year-to-Date ➞ Best Stocks Trends ➞  Best Stocks Today 12Stocks.com Best Nasdaq Stocks ➞ Best S&P 500 Stocks ➞ Best Tech Stocks ➞ Best Biotech Stocks ➞ |
| Detailed Overview of S&P 500 Stocks |
| S&P 500 Technical Overview, Leaders & Laggards, Top S&P 500 ETF Funds & Detailed S&P 500 Stocks List, Charts, Trends & More |
| S&P 500: Technical Analysis, Trends & YTD Performance | |
| S&P 500 index as represented by
SPY, an exchange-traded fund [ETF], holds basket of five hundred (mostly largecap) stocks from across all major sectors of the US stock market. The S&P 500 index (contains stocks like Apple and Exxon) is up by 5.27% and is currently outperforming the overall market by 0.73% year-to-date. Below is a quick view of technical charts and trends: | |
 SPY Weekly Chart |
|
| Long Term Trend: Not Good | |
| Medium Term Trend: Not Good | |
 SPY Daily Chart |
|
| Short Term Trend: Not Good | |
| Overall Trend Score: 7 | |
| YTD Performance: 5.27% | |
| **Trend Scores & Views Are Only For Educational Purposes And Not For Investing | |
| 12Stocks.com: Investing in S&P 500 Index using Exchange Traded Funds | |
|
The following table shows list of key exchange traded funds (ETF) that
help investors track S&P 500 index. The following list also includes leveraged ETF funds that track twice or thrice the daily returns of S&P 500 indices. Short or inverse ETF funds move in the opposite direction to the index they track and are useful during market pullbacks or during bear markets. Quick View: Move mouse or cursor over ETF symbol (ticker) to view short-term technical chart and over ETF name to view long term chart. Click on ticker or stock name for detailed view. Click on to add stock symbol to your watchlist and to view watchlist. |
12Stocks.com List of ETFs that track S&P 500 Index
| Ticker | ETF Name | Watchlist | Recent Price | Smart Investing & Trading Score | Change % | Week % | Year-to-date % |
| SPY | SPDR S&P 500 ETF | | 500.35 | 7 | -0.32 | -1.56 | 5.27% |
| IVV | iShares Core S&P 500 ETF | | 502.86 | 7 | -0.31 | -1.55 | 5.28% |
| VOO | Vanguard 500 ETF | | 459.93 | 7 | -0.33 | -1.56 | 5.3% |
| OEF | iShares S&P 100 | | 237.48 | 7 | -0.40 | -1.69 | 6.31% |
| SSO | ProShares Ultra S&P500 | | 70.39 | 7 | -0.68 | -3.19 | 8.18% |
| UPRO | ProShares UltraPro S&P500 | | 60.70 | 7 | -1.14 | -4.89 | 10.89% |
| SPXL | Direxion Daily S&P500 Bull 3X ETF | | 115.35 | 7 | -1.09 | -4.78 | 10.92% |
| SH | ProShares Short S&P500 | | 12.49 | 93 | 0.48 | 1.71 | -3.85% |
| SDS | ProShares UltraShort S&P500 | | 27.40 | 93 | 0.74 | 3.28 | -8.42% |
| SPXU | ProShares UltraPro Short S&P500 | | 37.21 | 88 | 0.98 | 4.82 | -13.47% |
| SPXS | Direxion Daily S&P 500 Bear 3X ETF | | 10.07 | 88 | 1.10 | 4.79 | -12.81% |
| 12Stocks.com: Charts, Trends, Fundamental Data and Performances of S&P 500 Stocks | |
|
We now take in-depth look at all S&P 500 stocks including charts, multi-period performances and overall trends (as measured by Smart Investing & Trading Score). One can sort S&P 500 stocks (click link to choose) by Daily, Weekly and by Year-to-Date performances. Also, one can sort by size of the company or by market capitalization. |
| Select Your Default Chart Type: | |||||
| |||||
| Click on stock symbol or name for detailed view. Click on to add stock symbol to your watchlist and to view watchlist. Quick View: Move mouse or cursor over "Daily" to quickly view daily technical stock chart and over "Weekly" to view weekly technical stock chart. | |||||

 | CTSH Cognizant Technology Solutions Corporation |
| Sector: Technology | |
| SubSector: Information Technology Services | |
| MarketCap: 26249.7 Millions | |
| Recent Price: 65.37 Smart Investing & Trading Score: 0 | |
| Day Percent Change: -0.47% Day Change: -0.31 | |
| Week Change: -2.35% Year-to-date Change: -13.5% | |
| CTSH Links: Profile News Message Board | |
| Charts:- Daily , Weekly | |
| Add CTSH to Watchlist: View: Get CTSH Trend Analysis ➞ | |
 | CNC Centene Corporation |
| Sector: Health Care | |
| SubSector: Health Care Plans | |
| MarketCap: 29075 Millions | |
| Recent Price: 72.25 Smart Investing & Trading Score: 15 | |
| Day Percent Change: -1.11% Day Change: -0.81 | |
| Week Change: -2.36% Year-to-date Change: -2.6% | |
| CNC Links: Profile News Message Board | |
| Charts:- Daily , Weekly | |
| Add CNC to Watchlist: View: Get CNC Trend Analysis ➞ | |
 | KMI Kinder Morgan, Inc. |
| Sector: Energy | |
| SubSector: Oil & Gas Pipelines | |
| MarketCap: 31283.5 Millions | |
| Recent Price: 18.23 Smart Investing & Trading Score: 44 | |
| Day Percent Change: -0.27% Day Change: -0.05 | |
| Week Change: -2.41% Year-to-date Change: 3.3% | |
| KMI Links: Profile News Message Board | |
| Charts:- Daily , Weekly | |
| Add KMI to Watchlist: View: Get KMI Trend Analysis ➞ | |
 | ITW Illinois Tool Works Inc. |
| Sector: Industrials | |
| SubSector: Diversified Machinery | |
| MarketCap: 45324.8 Millions | |
| Recent Price: 242.27 Smart Investing & Trading Score: 0 | |
| Day Percent Change: -0.75% Day Change: -1.84 | |
| Week Change: -2.42% Year-to-date Change: -7.5% | |
| ITW Links: Profile News Message Board | |
| Charts:- Daily , Weekly | |
| Add ITW to Watchlist: View: Get ITW Trend Analysis ➞ | |
 | KEYS Keysight Technologies, Inc. |
| Sector: Technology | |
| SubSector: Scientific & Technical Instruments | |
| MarketCap: 17355.1 Millions | |
| Recent Price: 144.95 Smart Investing & Trading Score: 7 | |
| Day Percent Change: -2.02% Day Change: -2.99 | |
| Week Change: -2.42% Year-to-date Change: -8.9% | |
| KEYS Links: Profile News Message Board | |
| Charts:- Daily , Weekly | |
| Add KEYS to Watchlist: View: Get KEYS Trend Analysis ➞ | |
 | EW Edwards Lifesciences Corporation |
| Sector: Health Care | |
| SubSector: Medical Appliances & Equipment | |
| MarketCap: 36735.5 Millions | |
| Recent Price: 84.30 Smart Investing & Trading Score: 28 | |
| Day Percent Change: -0.44% Day Change: -0.37 | |
| Week Change: -2.46% Year-to-date Change: 10.6% | |
| EW Links: Profile News Message Board | |
| Charts:- Daily , Weekly | |
| Add EW to Watchlist: View: Get EW Trend Analysis ➞ | |
 | CSGP CoStar Group, Inc. |
| Sector: Financials | |
| SubSector: Property Management | |
| MarketCap: 21454.4 Millions | |
| Recent Price: 90.36 Smart Investing & Trading Score: 41 | |
| Day Percent Change: -1.28% Day Change: -1.17 | |
| Week Change: -2.47% Year-to-date Change: 3.4% | |
| CSGP Links: Profile News Message Board | |
| Charts:- Daily , Weekly | |
| Add CSGP to Watchlist: View: Get CSGP Trend Analysis ➞ | |
 | NVR NVR, Inc. |
| Sector: Industrials | |
| SubSector: Residential Construction | |
| MarketCap: 9912.56 Millions | |
| Recent Price: 7457.00 Smart Investing & Trading Score: 7 | |
| Day Percent Change: 0.24% Day Change: 18.15 | |
| Week Change: -2.49% Year-to-date Change: 6.5% | |
| NVR Links: Profile News Message Board | |
| Charts:- Daily , Weekly | |
| Add NVR to Watchlist: View: Get NVR Trend Analysis ➞ | |
 | CMI Cummins Inc. |
| Sector: Industrials | |
| SubSector: Diversified Machinery | |
| MarketCap: 19127.1 Millions | |
| Recent Price: 283.87 Smart Investing & Trading Score: 31 | |
| Day Percent Change: 0.49% Day Change: 1.38 | |
| Week Change: -2.5% Year-to-date Change: 18.5% | |
| CMI Links: Profile News Message Board | |
| Charts:- Daily , Weekly | |
| Add CMI to Watchlist: View: Get CMI Trend Analysis ➞ | |
 | VRSN VeriSign, Inc. |
| Sector: Technology | |
| SubSector: Internet Information Providers | |
| MarketCap: 19657 Millions | |
| Recent Price: 171.08 Smart Investing & Trading Score: 0 | |
| Day Percent Change: 0.94% Day Change: 1.60 | |
| Week Change: -2.51% Year-to-date Change: -16.9% | |
| VRSN Links: Profile News Message Board | |
| Charts:- Daily , Weekly | |
| Add VRSN to Watchlist: View: Get VRSN Trend Analysis ➞ | |
 | CF CF Industries Holdings, Inc. |
| Sector: Materials | |
| SubSector: Agricultural Chemicals | |
| MarketCap: 5581.89 Millions | |
| Recent Price: 77.97 Smart Investing & Trading Score: 25 | |
| Day Percent Change: -1.27% Day Change: -1.00 | |
| Week Change: -2.54% Year-to-date Change: -1.9% | |
| CF Links: Profile News Message Board | |
| Charts:- Daily , Weekly | |
| Add CF to Watchlist: View: Get CF Trend Analysis ➞ | |
 | LYB LyondellBasell Industries N.V. |
| Sector: Materials | |
| SubSector: Specialty Chemicals | |
| MarketCap: 16420.7 Millions | |
| Recent Price: 99.52 Smart Investing & Trading Score: 20 | |
| Day Percent Change: -0.45% Day Change: -0.45 | |
| Week Change: -2.56% Year-to-date Change: 4.7% | |
| LYB Links: Profile News Message Board | |
| Charts:- Daily , Weekly | |
| Add LYB to Watchlist: View: Get LYB Trend Analysis ➞ | |
 | TRMB Trimble Inc. |
| Sector: Technology | |
| SubSector: Scientific & Technical Instruments | |
| MarketCap: 7990.33 Millions | |
| Recent Price: 58.59 Smart Investing & Trading Score: 12 | |
| Day Percent Change: -2.46% Day Change: -1.48 | |
| Week Change: -2.59% Year-to-date Change: 10.1% | |
| TRMB Links: Profile News Message Board | |
| Charts:- Daily , Weekly | |
| Add TRMB to Watchlist: View: Get TRMB Trend Analysis ➞ | |
 | DLTR Dollar Tree, Inc. |
| Sector: Services & Goods | |
| SubSector: Discount, Variety Stores | |
| MarketCap: 21383.2 Millions | |
| Recent Price: 118.56 Smart Investing & Trading Score: 17 | |
| Day Percent Change: 0.26% Day Change: 0.31 | |
| Week Change: -2.61% Year-to-date Change: -16.5% | |
| DLTR Links: Profile News Message Board | |
| Charts:- Daily , Weekly | |
| Add DLTR to Watchlist: View: Get DLTR Trend Analysis ➞ | |
 | V Visa Inc. |
| Sector: Financials | |
| SubSector: Credit Services | |
| MarketCap: 340798 Millions | |
| Recent Price: 267.32 Smart Investing & Trading Score: 0 | |
| Day Percent Change: -0.48% Day Change: -1.29 | |
| Week Change: -2.62% Year-to-date Change: 2.7% | |
| V Links: Profile News Message Board | |
| Charts:- Daily , Weekly | |
| Add V to Watchlist: View: Get V Trend Analysis ➞ | |
 | TJX The TJX Companies, Inc. |
| Sector: Services & Goods | |
| SubSector: Department Stores | |
| MarketCap: 50656.2 Millions | |
| Recent Price: 93.82 Smart Investing & Trading Score: 15 | |
| Day Percent Change: -0.29% Day Change: -0.27 | |
| Week Change: -2.64% Year-to-date Change: 0.0% | |
| TJX Links: Profile News Message Board | |
| Charts:- Daily , Weekly | |
| Add TJX to Watchlist: View: Get TJX Trend Analysis ➞ | |
 | WY Weyerhaeuser Company |
| Sector: Industrials | |
| SubSector: Lumber, Wood Production | |
| MarketCap: 13244.8 Millions | |
| Recent Price: 30.20 Smart Investing & Trading Score: 10 | |
| Day Percent Change: 0.10% Day Change: 0.03 | |
| Week Change: -2.74% Year-to-date Change: -13.1% | |
| WY Links: Profile News Message Board | |
| Charts:- Daily , Weekly | |
| Add WY to Watchlist: View: Get WY Trend Analysis ➞ | |
 | CDNS Cadence Design Systems, Inc. |
| Sector: Technology | |
| SubSector: Application Software | |
| MarketCap: 16865.8 Millions | |
| Recent Price: 274.55 Smart Investing & Trading Score: 10 | |
| Day Percent Change: -0.39% Day Change: -1.08 | |
| Week Change: -2.78% Year-to-date Change: 0.8% | |
| CDNS Links: Profile News Message Board | |
| Charts:- Daily , Weekly | |
| Add CDNS to Watchlist: View: Get CDNS Trend Analysis ➞ | |
 | MSFT Microsoft Corporation |
| Sector: Technology | |
| SubSector: Business Software & Services | |
| MarketCap: 1154150 Millions | |
| Recent Price: 394.94 Smart Investing & Trading Score: 10 | |
| Day Percent Change: 1.44% Day Change: 5.61 | |
| Week Change: -2.8% Year-to-date Change: 5.0% | |
| MSFT Links: Profile News Message Board | |
| Charts:- Daily , Weekly | |
| Add MSFT to Watchlist: View: Get MSFT Trend Analysis ➞ | |
 | LULU Lululemon Athletica Inc. |
| Sector: Consumer Staples | |
| SubSector: Textile - Apparel Clothing | |
| MarketCap: 24627.8 Millions | |
| Recent Price: 354.40 Smart Investing & Trading Score: 25 | |
| Day Percent Change: -1.72% Day Change: -6.20 | |
| Week Change: -2.82% Year-to-date Change: -30.7% | |
| LULU Links: Profile News Message Board | |
| Charts:- Daily , Weekly | |
| Add LULU to Watchlist: View: Get LULU Trend Analysis ➞ | |
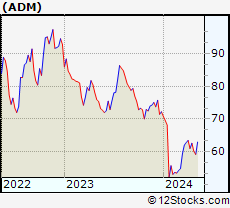 | ADM Archer-Daniels-Midland Company |
| Sector: Consumer Staples | |
| SubSector: Farm Products | |
| MarketCap: 18988.7 Millions | |
| Recent Price: 58.37 Smart Investing & Trading Score: 36 | |
| Day Percent Change: -0.49% Day Change: -0.29 | |
| Week Change: -2.88% Year-to-date Change: -19.2% | |
| ADM Links: Profile News Message Board | |
| Charts:- Daily , Weekly | |
| Add ADM to Watchlist: View: Get ADM Trend Analysis ➞ | |
 | BKR Baker Hughes Company |
| Sector: Services & Goods | |
| SubSector: Technical Services | |
| MarketCap: 1330 Millions | |
| Recent Price: 31.89 Smart Investing & Trading Score: 26 | |
| Day Percent Change: -2.24% Day Change: -0.73 | |
| Week Change: -2.89% Year-to-date Change: -6.7% | |
| BKR Links: Profile News Message Board | |
| Charts:- Daily , Weekly | |
| Add BKR to Watchlist: View: Get BKR Trend Analysis ➞ | |
 | MAR Marriott International, Inc. |
| Sector: Services & Goods | |
| SubSector: Lodging | |
| MarketCap: 25831.6 Millions | |
| Recent Price: 233.86 Smart Investing & Trading Score: 0 | |
| Day Percent Change: -0.96% Day Change: -2.27 | |
| Week Change: -2.9% Year-to-date Change: 3.7% | |
| MAR Links: Profile News Message Board | |
| Charts:- Daily , Weekly | |
| Add MAR to Watchlist: View: Get MAR Trend Analysis ➞ | |
 | GM General Motors Company |
| Sector: Consumer Staples | |
| SubSector: Auto Manufacturers - Major | |
| MarketCap: 29252.4 Millions | |
| Recent Price: 44.47 Smart Investing & Trading Score: 58 | |
| Day Percent Change: -0.13% Day Change: -0.06 | |
| Week Change: -2.99% Year-to-date Change: 23.8% | |
| GM Links: Profile News Message Board | |
| Charts:- Daily , Weekly | |
| Add GM to Watchlist: View: Get GM Trend Analysis ➞ | |
 | BKNG Booking Holdings Inc. |
| Sector: Services & Goods | |
| SubSector: Business Services | |
| MarketCap: 54467.9 Millions | |
| Recent Price: 3415.64 Smart Investing & Trading Score: 0 | |
| Day Percent Change: -1.05% Day Change: -36.39 | |
| Week Change: -2.99% Year-to-date Change: -3.7% | |
| BKNG Links: Profile News Message Board | |
| Charts:- Daily , Weekly | |
| Add BKNG to Watchlist: View: Get BKNG Trend Analysis ➞ | |
| For tabular summary view of above stock list: Summary View ➞ 0 - 25 , 25 - 50 , 50 - 75 , 75 - 100 , 100 - 125 , 125 - 150 , 150 - 175 , 175 - 200 , 200 - 225 , 225 - 250 , 250 - 275 , 275 - 300 , 300 - 325 , 325 - 350 , 350 - 375 , 375 - 400 , 400 - 425 , 425 - 450 , 450 - 475 , 475 - 500 | ||
| Click To Change The Sort Order: By Market Cap or Company Size Performance: Year-to-date, Week and Day | |
| Select Chart Type: | ||
|
Best Stocks Today 12Stocks.com |
© 2024 12Stocks.com Terms & Conditions Privacy Contact Us
All Information Provided Only For Education And Not To Be Used For Investing or Trading. See Terms & Conditions


One More Thing ... Get Best Stocks Delivered Daily!
Never Ever Miss A Move With Our Top Ten Stocks Lists
Find Best Stocks In Any Market - Bull or Bear Market
Take A Peek At Our Top Ten Stocks Lists: Daily, Weekly, Year-to-Date & Top Trends
Find Best Stocks In Any Market - Bull or Bear Market
Take A Peek At Our Top Ten Stocks Lists: Daily, Weekly, Year-to-Date & Top Trends
S&P 500 Stocks With Best Up Trends [0-bearish to 100-bullish]: Garmin [100], Amcor [100], DuPont de[100], Pfizer [100], American Electric[100], NextEra [100], Arch Capital[100], American Water[100], 3M [100], PPL [100], Pinnacle West[100]
Best S&P 500 Stocks Year-to-Date:
NVIDIA [67.69%], Constellation [57.66%], NRG [42.48%], Chipotle Mexican[37.24%], Western Digital[34.64%], DaVita [33.4%], Eli Lilly[33.25%], Progressive [32.97%], Leidos Holdings[31.37%], Eaton [29.57%], Targa Resources[29.4%] Best S&P 500 Stocks This Week:
Bio-Techne [14.67%], Garmin [13.92%], Amcor [9.25%], Leidos Holdings[9.07%], 3M [7.2%], Pfizer [7.01%], Tesla [6.95%], Corning [6.86%], DuPont de[6.24%], Eli Lilly[5.89%], Cincinnati Financial[5.79%] Best S&P 500 Stocks Daily:
Bio-Techne [16.22%], Garmin [13.12%], Amcor [9.62%], DuPont de[8.01%], Verisk Analytics[6.81%], Pfizer [6.09%], Johnson & Johnson[4.56%], Globe Life[4.35%], Humana [4.01%], Extra Space[3.29%], American Tower[3.08%]