
 Login Sign Up


| |||||
 |  | ||||

| 12Stocks.com Market Intelligence |
Best S&P 500 Stocks
|
On this page, you will find the most comprehensive analysis of S&P 500 stocks and ETFs - from latest trends to performances to charts ➞. First, here are the year-to-date (YTD) performances of the most requested S&P 500 stocks at 12Stocks.com (click stock for review):
| NVIDIA 67% | ||
| Caterpillar 21% | ||
| Amazon.com 16% | ||
| Merck 15% | ||
| Walmart 13% | ||
| Google 11% | ||
| JPMorgan Chase 8% | ||
| Chevron 8% | ||
| Microsoft 7% | ||
| Goldman Sachs 5% | ||
| Johnson & Johnson -7% | ||
| Starbucks -8% | ||
| McDonald s -8% | ||
| Apple -14% | ||
| Gilead -18% | ||
| Intel -31% | ||
| Boeing -34% | ||
| Quick: S&P 500 Stocks Lists: Performances & Trends, S&P 500 Stock Charts
Sort S&P 500 stocks: Daily, Weekly, Year-to-Date, Market Cap & Trends. Filter S&P 500 stocks list by sector: Show all, Tech, Finance, Energy, Staples, Retail, Industrial, Materials, Utilities and HealthCare |
| 12Stocks.com S&P 500 Stocks Performances & Trends Daily Report | |||||||||
|
| 
The overall Smart Investing & Trading Score is 36 (0-bearish to 100-bullish) which puts S&P 500 index in short term bearish to neutral trend. The Smart Investing & Trading Score from previous trading session is 26 and an improvement of trend continues. | ||||||||
Here are the Smart Investing & Trading Scores of the most requested S&P 500 stocks at 12Stocks.com (click stock name for detailed review):
|


| 12Stocks.com: Top Performing S&P 500 Index Stocks | ||||||||||||||||||||||||||||||||||||||||||||||||
 The top performing S&P 500 Index stocks year to date are
Now, more recently, over last week, the top performing S&P 500 Index stocks on the move are


|
||||||||||||||||||||||||||||||||||||||||||||||||
| 12Stocks.com: Investing in S&P 500 Index with Stocks | |
|
The following table helps investors and traders sort through current performance and trends (as measured by Smart Investing & Trading Score) of various
stocks in the S&P 500 Index. Quick View: Move mouse or cursor over stock symbol (ticker) to view short-term technical chart and over stock name to view long term chart. Click on  to add stock symbol to your watchlist and to add stock symbol to your watchlist and  to view watchlist. Click on any ticker or stock name for detailed market intelligence report for that stock. to view watchlist. Click on any ticker or stock name for detailed market intelligence report for that stock. |
12Stocks.com Performance of Stocks in S&P 500 Index
| Ticker | Stock Name | Watchlist | Category | Recent Price | Smart Investing & Trading Score | Change % | Weekly Change% |
| LYB | LyondellBasell Industries |   | Materials | 100.67 | 63 | 1.27% | -0.85% |
| ZTS | Zoetis | | Health Care | 148.71 | 0 | -2.87% | -0.85% |
| ADBE | Adobe | | Technology | 470.01 | 20 | -0.67% | -0.86% |
| TXT | Textron | | Industrials | 93.13 | 51 | 0.59% | -0.89% |
| LKQ | LKQ | | Consumer Staples | 48.81 | 54 | 0.47% | -0.89% |
| EOG | EOG Resources | | Energy | 134.02 | 88 | 1.72% | -0.94% |
| AMGN | Amgen | | Health Care | 264.75 | 28 | 0.76% | -0.95% |
| ETSY | Etsy | | Services & Goods | 67.76 | 73 | 0.62% | -0.95% |
| GM | General Motors | | Consumer Staples | 42.66 | 53 | 0.52% | -0.97% |
| MTCH | Match | | Technology | 32.36 | 37 | 0.43% | -0.98% |
| AIZ | Assurant | | Financials | 172.44 | 58 | 0.91% | -1.00% |
| BSX | Boston Scientific | | Health Care | 67.39 | 31 | -0.04% | -1.00% |
| DG | Dollar General | | Services & Goods | 146.24 | 68 | 0.38% | -1.04% |
| CCL | Carnival | | Services & Goods | 14.21 | 25 | 0.21% | -1.04% |
| REGN | Regeneron | | Health Care | 895.18 | 25 | 0.13% | -1.05% |
| ESS | Essex Property | | Financials | 236.64 | 68 | 1.14% | -1.11% |
| IRM | Iron Mountain | | Technology | 75.16 | 51 | 0.99% | -1.13% |
| DOV | Dover | | Industrials | 170.06 | 61 | 0.86% | -1.16% |
| CPT | Camden Property | | Financials | 96.79 | 68 | 1.57% | -1.17% |
| HON | Honeywell | | Industrials | 193.87 | 32 | 1.46% | -1.17% |
| AME | AMETEK | | Industrials | 177.56 | 36 | 0.16% | -1.20% |
| JNPR | Juniper Networks | | Technology | 36.18 | 13 | 0.06% | -1.28% |
| MSI | Motorola Solutions | | Technology | 339.39 | 51 | -0.02% | -1.28% |
| BAX | Baxter | | Health Care | 39.81 | 61 | 0.40% | -1.29% |
| MCO | Moody s | | Services & Goods | 372.22 | 18 | -0.64% | -1.31% |
| For chart view version of above stock list: Chart View ➞ 0 - 25 , 25 - 50 , 50 - 75 , 75 - 100 , 100 - 125 , 125 - 150 , 150 - 175 , 175 - 200 , 200 - 225 , 225 - 250 , 250 - 275 , 275 - 300 , 300 - 325 , 325 - 350 , 350 - 375 , 375 - 400 , 400 - 425 , 425 - 450 , 450 - 475 , 475 - 500 | ||
 | Click To Change The Sort Order: By Market Cap or Company Size Performance: Year-to-date, Week and Day |  |
|
Get the most comprehensive stock market coverage daily at 12Stocks.com ➞ Best Stocks Today ➞ Best Stocks Weekly ➞ Best Stocks Year-to-Date ➞ Best Stocks Trends ➞  Best Stocks Today 12Stocks.com Best Nasdaq Stocks ➞ Best S&P 500 Stocks ➞ Best Tech Stocks ➞ Best Biotech Stocks ➞ |
| Detailed Overview of S&P 500 Stocks |
| S&P 500 Technical Overview, Leaders & Laggards, Top S&P 500 ETF Funds & Detailed S&P 500 Stocks List, Charts, Trends & More |
| S&P 500: Technical Analysis, Trends & YTD Performance | |
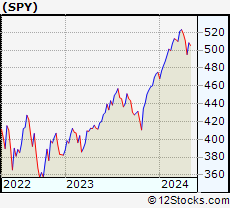
| S&P 500 index as represented by
SPY, an exchange-traded fund [ETF], holds basket of five hundred (mostly largecap) stocks from across all major sectors of the US stock market. The S&P 500 index (contains stocks like Apple and Exxon) is up by 4.95% and is currently outperforming the overall market by 0.87% year-to-date. Below is a quick view of technical charts and trends: | |
 SPY Weekly Chart |
|
| Long Term Trend: Good | |
| Medium Term Trend: Not Good | |
 SPY Daily Chart |
|
| Short Term Trend: Deteriorating | |
| Overall Trend Score: 36 | |
| YTD Performance: 4.95% | |
| **Trend Scores & Views Are Only For Educational Purposes And Not For Investing | |
| 12Stocks.com: Investing in S&P 500 Index using Exchange Traded Funds | |
|
The following table shows list of key exchange traded funds (ETF) that
help investors track S&P 500 index. The following list also includes leveraged ETF funds that track twice or thrice the daily returns of S&P 500 indices. Short or inverse ETF funds move in the opposite direction to the index they track and are useful during market pullbacks or during bear markets. Quick View: Move mouse or cursor over ETF symbol (ticker) to view short-term technical chart and over ETF name to view long term chart. Click on ticker or stock name for detailed view. Click on to add stock symbol to your watchlist and to view watchlist. |
12Stocks.com List of ETFs that track S&P 500 Index
| Ticker | ETF Name | Watchlist | Recent Price | Smart Investing & Trading Score | Change % | Week % | Year-to-date % |
| SPY | SPDR S&P 500 ETF | | 498.82 | 36 | -0.14 | -2.35 | 4.95% |
| OEF | iShares S&P 100 | | 236.60 | 36 | -0.43 | -2.69 | 5.91% |
| SSO | ProShares Ultra S&P500 | | 70.13 | 36 | -0.28 | -4.79 | 7.78% |
| UPRO | ProShares UltraPro S&P500 | | 60.52 | 36 | -0.43 | -7.18 | 10.56% |
| SH | ProShares Short S&P500 | | 12.50 | 69 | 0.24 | 2.54 | -3.77% |
| SDS | ProShares UltraShort S&P500 | | 27.50 | 69 | 0.33 | 5.08 | -8.09% |
| SPXU | ProShares UltraPro Short S&P500 | | 37.53 | 64 | 0.54 | 7.66 | -12.72% |
| 12Stocks.com: Charts, Trends, Fundamental Data and Performances of S&P 500 Stocks | |
|
We now take in-depth look at all S&P 500 stocks including charts, multi-period performances and overall trends (as measured by Smart Investing & Trading Score). One can sort S&P 500 stocks (click link to choose) by Daily, Weekly and by Year-to-Date performances. Also, one can sort by size of the company or by market capitalization. |
| Select Your Default Chart Type: | |||||
| |||||
| Click on stock symbol or name for detailed view. Click on to add stock symbol to your watchlist and to view watchlist. Quick View: Move mouse or cursor over "Daily" to quickly view daily technical stock chart and over "Weekly" to view weekly technical stock chart. | |||||

 | LYB LyondellBasell Industries N.V. |
| Sector: Materials | |
| SubSector: Specialty Chemicals | |
| MarketCap: 16420.7 Millions | |
| Recent Price: 100.67 Smart Investing & Trading Score: 63 | |
| Day Percent Change: 1.27% Day Change: 1.27 | |
| Week Change: -0.85% Year-to-date Change: 5.9% | |
| LYB Links: Profile News Message Board | |
| Charts:- Daily , Weekly | |
| Add LYB to Watchlist: View: Get LYB Trend Analysis ➞ | |
 | ZTS Zoetis Inc. |
| Sector: Health Care | |
| SubSector: Drugs - Generic | |
| MarketCap: 51921.5 Millions | |
| Recent Price: 148.71 Smart Investing & Trading Score: 0 | |
| Day Percent Change: -2.87% Day Change: -4.40 | |
| Week Change: -0.85% Year-to-date Change: -24.7% | |
| ZTS Links: Profile News Message Board | |
| Charts:- Daily , Weekly | |
| Add ZTS to Watchlist: View: Get ZTS Trend Analysis ➞ | |
 | ADBE Adobe Inc. |
| Sector: Technology | |
| SubSector: Application Software | |
| MarketCap: 157868 Millions | |
| Recent Price: 470.01 Smart Investing & Trading Score: 20 | |
| Day Percent Change: -0.67% Day Change: -3.17 | |
| Week Change: -0.86% Year-to-date Change: -21.2% | |
| ADBE Links: Profile News Message Board | |
| Charts:- Daily , Weekly | |
| Add ADBE to Watchlist: View: Get ADBE Trend Analysis ➞ | |
 | TXT Textron Inc. |
| Sector: Industrials | |
| SubSector: Aerospace/Defense - Major Diversified | |
| MarketCap: 6123.09 Millions | |
| Recent Price: 93.13 Smart Investing & Trading Score: 51 | |
| Day Percent Change: 0.59% Day Change: 0.55 | |
| Week Change: -0.89% Year-to-date Change: 15.8% | |
| TXT Links: Profile News Message Board | |
| Charts:- Daily , Weekly | |
| Add TXT to Watchlist: View: Get TXT Trend Analysis ➞ | |
 | LKQ LKQ Corporation |
| Sector: Consumer Staples | |
| SubSector: Auto Parts | |
| MarketCap: 5633.79 Millions | |
| Recent Price: 48.81 Smart Investing & Trading Score: 54 | |
| Day Percent Change: 0.47% Day Change: 0.23 | |
| Week Change: -0.89% Year-to-date Change: 2.1% | |
| LKQ Links: Profile News Message Board | |
| Charts:- Daily , Weekly | |
| Add LKQ to Watchlist: View: Get LKQ Trend Analysis ➞ | |
 | EOG EOG Resources, Inc. |
| Sector: Energy | |
| SubSector: Independent Oil & Gas | |
| MarketCap: 24282.1 Millions | |
| Recent Price: 134.02 Smart Investing & Trading Score: 88 | |
| Day Percent Change: 1.72% Day Change: 2.26 | |
| Week Change: -0.94% Year-to-date Change: 10.8% | |
| EOG Links: Profile News Message Board | |
| Charts:- Daily , Weekly | |
| Add EOG to Watchlist: View: Get EOG Trend Analysis ➞ | |
 | AMGN Amgen Inc. |
| Sector: Health Care | |
| SubSector: Biotechnology | |
| MarketCap: 121030 Millions | |
| Recent Price: 264.75 Smart Investing & Trading Score: 28 | |
| Day Percent Change: 0.76% Day Change: 2.00 | |
| Week Change: -0.95% Year-to-date Change: -8.1% | |
| AMGN Links: Profile News Message Board | |
| Charts:- Daily , Weekly | |
| Add AMGN to Watchlist: View: Get AMGN Trend Analysis ➞ | |
 | ETSY Etsy, Inc. |
| Sector: Services & Goods | |
| SubSector: Specialty Retail, Other | |
| MarketCap: 4263.24 Millions | |
| Recent Price: 67.76 Smart Investing & Trading Score: 73 | |
| Day Percent Change: 0.62% Day Change: 0.42 | |
| Week Change: -0.95% Year-to-date Change: -16.4% | |
| ETSY Links: Profile News Message Board | |
| Charts:- Daily , Weekly | |
| Add ETSY to Watchlist: View: Get ETSY Trend Analysis ➞ | |
 | GM General Motors Company |
| Sector: Consumer Staples | |
| SubSector: Auto Manufacturers - Major | |
| MarketCap: 29252.4 Millions | |
| Recent Price: 42.66 Smart Investing & Trading Score: 53 | |
| Day Percent Change: 0.52% Day Change: 0.22 | |
| Week Change: -0.97% Year-to-date Change: 18.8% | |
| GM Links: Profile News Message Board | |
| Charts:- Daily , Weekly | |
| Add GM to Watchlist: View: Get GM Trend Analysis ➞ | |
 | MTCH Match Group, Inc. |
| Sector: Technology | |
| SubSector: Internet Information Providers | |
| MarketCap: 14655.8 Millions | |
| Recent Price: 32.36 Smart Investing & Trading Score: 37 | |
| Day Percent Change: 0.43% Day Change: 0.14 | |
| Week Change: -0.98% Year-to-date Change: -11.3% | |
| MTCH Links: Profile News Message Board | |
| Charts:- Daily , Weekly | |
| Add MTCH to Watchlist: View: Get MTCH Trend Analysis ➞ | |
 | AIZ Assurant, Inc. |
| Sector: Financials | |
| SubSector: Accident & Health Insurance | |
| MarketCap: 6110.3 Millions | |
| Recent Price: 172.44 Smart Investing & Trading Score: 58 | |
| Day Percent Change: 0.91% Day Change: 1.55 | |
| Week Change: -1% Year-to-date Change: 2.3% | |
| AIZ Links: Profile News Message Board | |
| Charts:- Daily , Weekly | |
| Add AIZ to Watchlist: View: Get AIZ Trend Analysis ➞ | |
 | BSX Boston Scientific Corporation |
| Sector: Health Care | |
| SubSector: Medical Appliances & Equipment | |
| MarketCap: 41541.2 Millions | |
| Recent Price: 67.39 Smart Investing & Trading Score: 31 | |
| Day Percent Change: -0.04% Day Change: -0.03 | |
| Week Change: -1% Year-to-date Change: 16.6% | |
| BSX Links: Profile News Message Board | |
| Charts:- Daily , Weekly | |
| Add BSX to Watchlist: View: Get BSX Trend Analysis ➞ | |
 | DG Dollar General Corporation |
| Sector: Services & Goods | |
| SubSector: Discount, Variety Stores | |
| MarketCap: 39611.9 Millions | |
| Recent Price: 146.24 Smart Investing & Trading Score: 68 | |
| Day Percent Change: 0.38% Day Change: 0.56 | |
| Week Change: -1.04% Year-to-date Change: 7.6% | |
| DG Links: Profile News Message Board | |
| Charts:- Daily , Weekly | |
| Add DG to Watchlist: View: Get DG Trend Analysis ➞ | |
 | CCL Carnival Corporation & Plc |
| Sector: Services & Goods | |
| SubSector: Resorts & Casinos | |
| MarketCap: 11725.4 Millions | |
| Recent Price: 14.21 Smart Investing & Trading Score: 25 | |
| Day Percent Change: 0.21% Day Change: 0.03 | |
| Week Change: -1.04% Year-to-date Change: -23.4% | |
| CCL Links: Profile News Message Board | |
| Charts:- Daily , Weekly | |
| Add CCL to Watchlist: View: Get CCL Trend Analysis ➞ | |
 | REGN Regeneron Pharmaceuticals, Inc. |
| Sector: Health Care | |
| SubSector: Biotechnology | |
| MarketCap: 51903.7 Millions | |
| Recent Price: 895.18 Smart Investing & Trading Score: 25 | |
| Day Percent Change: 0.13% Day Change: 1.19 | |
| Week Change: -1.05% Year-to-date Change: 1.9% | |
| REGN Links: Profile News Message Board | |
| Charts:- Daily , Weekly | |
| Add REGN to Watchlist: View: Get REGN Trend Analysis ➞ | |
 | ESS Essex Property Trust, Inc. |
| Sector: Financials | |
| SubSector: REIT - Residential | |
| MarketCap: 13725.5 Millions | |
| Recent Price: 236.64 Smart Investing & Trading Score: 68 | |
| Day Percent Change: 1.14% Day Change: 2.67 | |
| Week Change: -1.11% Year-to-date Change: -4.6% | |
| ESS Links: Profile News Message Board | |
| Charts:- Daily , Weekly | |
| Add ESS to Watchlist: View: Get ESS Trend Analysis ➞ | |
 | IRM Iron Mountain Incorporated |
| Sector: Technology | |
| SubSector: Business Software & Services | |
| MarketCap: 7339.18 Millions | |
| Recent Price: 75.16 Smart Investing & Trading Score: 51 | |
| Day Percent Change: 0.99% Day Change: 0.74 | |
| Week Change: -1.13% Year-to-date Change: 7.4% | |
| IRM Links: Profile News Message Board | |
| Charts:- Daily , Weekly | |
| Add IRM to Watchlist: View: Get IRM Trend Analysis ➞ | |
 | DOV Dover Corporation |
| Sector: Industrials | |
| SubSector: Diversified Machinery | |
| MarketCap: 10725.6 Millions | |
| Recent Price: 170.06 Smart Investing & Trading Score: 61 | |
| Day Percent Change: 0.86% Day Change: 1.45 | |
| Week Change: -1.16% Year-to-date Change: 10.6% | |
| DOV Links: Profile News Message Board | |
| Charts:- Daily , Weekly | |
| Add DOV to Watchlist: View: Get DOV Trend Analysis ➞ | |
 | CPT Camden Property Trust |
| Sector: Financials | |
| SubSector: REIT - Residential | |
| MarketCap: 7535.21 Millions | |
| Recent Price: 96.79 Smart Investing & Trading Score: 68 | |
| Day Percent Change: 1.57% Day Change: 1.50 | |
| Week Change: -1.17% Year-to-date Change: -2.5% | |
| CPT Links: Profile News Message Board | |
| Charts:- Daily , Weekly | |
| Add CPT to Watchlist: View: Get CPT Trend Analysis ➞ | |
 | HON Honeywell International Inc. |
| Sector: Industrials | |
| SubSector: Diversified Machinery | |
| MarketCap: 91189.1 Millions | |
| Recent Price: 193.87 Smart Investing & Trading Score: 32 | |
| Day Percent Change: 1.46% Day Change: 2.79 | |
| Week Change: -1.17% Year-to-date Change: -7.6% | |
| HON Links: Profile News Message Board | |
| Charts:- Daily , Weekly | |
| Add HON to Watchlist: View: Get HON Trend Analysis ➞ | |
 | AME AMETEK, Inc. |
| Sector: Industrials | |
| SubSector: Diversified Machinery | |
| MarketCap: 16611.8 Millions | |
| Recent Price: 177.56 Smart Investing & Trading Score: 36 | |
| Day Percent Change: 0.16% Day Change: 0.29 | |
| Week Change: -1.2% Year-to-date Change: 7.7% | |
| AME Links: Profile News Message Board | |
| Charts:- Daily , Weekly | |
| Add AME to Watchlist: View: Get AME Trend Analysis ➞ | |
 | JNPR Juniper Networks, Inc. |
| Sector: Technology | |
| SubSector: Communication Equipment | |
| MarketCap: 6161.49 Millions | |
| Recent Price: 36.18 Smart Investing & Trading Score: 13 | |
| Day Percent Change: 0.06% Day Change: 0.02 | |
| Week Change: -1.28% Year-to-date Change: 22.7% | |
| JNPR Links: Profile News Message Board | |
| Charts:- Daily , Weekly | |
| Add JNPR to Watchlist: View: Get JNPR Trend Analysis ➞ | |
 | MSI Motorola Solutions, Inc. |
| Sector: Technology | |
| SubSector: Communication Equipment | |
| MarketCap: 26573.3 Millions | |
| Recent Price: 339.39 Smart Investing & Trading Score: 51 | |
| Day Percent Change: -0.02% Day Change: -0.06 | |
| Week Change: -1.28% Year-to-date Change: 8.4% | |
| MSI Links: Profile News Message Board | |
| Charts:- Daily , Weekly | |
| Add MSI to Watchlist: View: Get MSI Trend Analysis ➞ | |
 | BAX Baxter International Inc. |
| Sector: Health Care | |
| SubSector: Medical Instruments & Supplies | |
| MarketCap: 39955.8 Millions | |
| Recent Price: 39.81 Smart Investing & Trading Score: 61 | |
| Day Percent Change: 0.40% Day Change: 0.16 | |
| Week Change: -1.29% Year-to-date Change: 3.0% | |
| BAX Links: Profile News Message Board | |
| Charts:- Daily , Weekly | |
| Add BAX to Watchlist: View: Get BAX Trend Analysis ➞ | |
 | MCO Moody s Corporation |
| Sector: Services & Goods | |
| SubSector: Business Services | |
| MarketCap: 35998.5 Millions | |
| Recent Price: 372.22 Smart Investing & Trading Score: 18 | |
| Day Percent Change: -0.64% Day Change: -2.38 | |
| Week Change: -1.31% Year-to-date Change: -4.7% | |
| MCO Links: Profile News Message Board | |
| Charts:- Daily , Weekly | |
| Add MCO to Watchlist: View: Get MCO Trend Analysis ➞ | |
| For tabular summary view of above stock list: Summary View ➞ 0 - 25 , 25 - 50 , 50 - 75 , 75 - 100 , 100 - 125 , 125 - 150 , 150 - 175 , 175 - 200 , 200 - 225 , 225 - 250 , 250 - 275 , 275 - 300 , 300 - 325 , 325 - 350 , 350 - 375 , 375 - 400 , 400 - 425 , 425 - 450 , 450 - 475 , 475 - 500 | ||
| Click To Change The Sort Order: By Market Cap or Company Size Performance: Year-to-date, Week and Day | |
| Select Chart Type: | ||
|
Best Stocks Today 12Stocks.com |
© 2024 12Stocks.com Terms & Conditions Privacy Contact Us
All Information Provided Only For Education And Not To Be Used For Investing or Trading. See Terms & Conditions


One More Thing ... Get Best Stocks Delivered Daily!
Never Ever Miss A Move With Our Top Ten Stocks Lists
Find Best Stocks In Any Market - Bull or Bear Market
Take A Peek At Our Top Ten Stocks Lists: Daily, Weekly, Year-to-Date & Top Trends
Find Best Stocks In Any Market - Bull or Bear Market
Take A Peek At Our Top Ten Stocks Lists: Daily, Weekly, Year-to-Date & Top Trends
S&P 500 Stocks With Best Up Trends [0-bearish to 100-bullish]: Kinder Morgan[100], Wells Fargo[100], Bunge [100], Consolidated Edison[100], Lockheed Martin[100], Charles Schwab[100], Conagra Brands[100], Genuine Parts[100], United Airlines[100], Dominion [95], Progressive [95]
Best S&P 500 Stocks Year-to-Date:
NVIDIA [66.66%], Constellation [57.45%], Meta Platforms[38.28%], NRG [36.11%], Progressive [34.35%], Marathon [33.2%], Targa Resources[31.03%], Diamondback [30.74%], Western Digital[29.2%], Eaton [28.4%], Micron [27.36%] Best S&P 500 Stocks This Week:
United Airlines[23.18%], UnitedHealth [14.33%], Genuine Parts[10.93%], Globe Life[10.86%], American Airlines[8.4%], ProShares UltraPro[7.66%], Southwest Airlines[7.43%], Wells Fargo[7.31%], V.F [6.11%], Morgan Stanley[5.88%], Centene [5.68%] Best S&P 500 Stocks Daily:
Fifth Third[5.13%], American Express[4.47%], Kinder Morgan[3.51%], Bank of America[3.40%], Wells Fargo[3.17%], Bunge [2.96%], PNC Financial[2.77%], Generac Holdings[2.63%], Synchrony Financial[2.48%], Citizens Financial[2.46%], Truist Financial[2.42%]