
 Login Sign Up


| |||||
 |  | ||||

| 12Stocks.com Market Intelligence |
Best S&P 500 Stocks
|
On this page, you will find the most comprehensive analysis of S&P 500 stocks and ETFs - from latest trends to performances to charts ➞. First, here are the year-to-date (YTD) performances of the most requested S&P 500 stocks at 12Stocks.com (click stock for review):
| NVIDIA 66% | ||
| Caterpillar 23% | ||
| Amazon.com 18% | ||
| Merck 16% | ||
| Google 13% | ||
| JPMorgan Chase 13% | ||
| Walmart 12% | ||
| Goldman Sachs 10% | ||
| Chevron 9% | ||
| Microsoft 8% | ||
| Johnson & Johnson -5% | ||
| McDonald s -7% | ||
| Starbucks -8% | ||
| Apple -13% | ||
| Gilead -17% | ||
| Intel -32% | ||
| Boeing -35% | ||
| Quick: S&P 500 Stocks Lists: Performances & Trends, S&P 500 Stock Charts
Sort S&P 500 stocks: Daily, Weekly, Year-to-Date, Market Cap & Trends. Filter S&P 500 stocks list by sector: Show all, Tech, Finance, Energy, Staples, Retail, Industrial, Materials, Utilities and HealthCare |
| 12Stocks.com S&P 500 Stocks Performances & Trends Daily Report | |||||||||
|
| 
The overall Smart Investing & Trading Score is 58 (0-bearish to 100-bullish) which puts S&P 500 index in short term neutral trend. The Smart Investing & Trading Score from previous trading session is 51 and hence an improvement of trend. | ||||||||
Here are the Smart Investing & Trading Scores of the most requested S&P 500 stocks at 12Stocks.com (click stock name for detailed review):
|


| 12Stocks.com: Top Performing S&P 500 Index Stocks | ||||||||||||||||||||||||||||||||||||||||||||||||
 The top performing S&P 500 Index stocks year to date are
Now, more recently, over last week, the top performing S&P 500 Index stocks on the move are


|
||||||||||||||||||||||||||||||||||||||||||||||||
| 12Stocks.com: Investing in S&P 500 Index with Stocks | |
|
The following table helps investors and traders sort through current performance and trends (as measured by Smart Investing & Trading Score) of various
stocks in the S&P 500 Index. Quick View: Move mouse or cursor over stock symbol (ticker) to view short-term technical chart and over stock name to view long term chart. Click on  to add stock symbol to your watchlist and to add stock symbol to your watchlist and  to view watchlist. Click on any ticker or stock name for detailed market intelligence report for that stock. to view watchlist. Click on any ticker or stock name for detailed market intelligence report for that stock. |
12Stocks.com Performance of Stocks in S&P 500 Index
| Ticker | Stock Name | Watchlist | Category | Recent Price | Smart Investing & Trading Score | Change % | Weekly Change% |
| SPGI | S&P Global |   | Services & Goods | 413.26 | 35 | -0.88% | 0.17% |
| JBHT | J.B. Hunt | | Transports | 167.55 | 25 | 0.10% | 0.15% |
| DOW | Dow | | Materials | 56.74 | 61 | -0.44% | 0.14% |
| LYV | Live Nation | | Services & Goods | 90.09 | 58 | 1.85% | 0.14% |
| PNW | Pinnacle West | | Utilities | 74.50 | 100 | -0.27% | 0.13% |
| ORLY | O Reilly | | Services & Goods | 1092.35 | 36 | 0.08% | 0.13% |
| BMY | Bristol-Myers | | Health Care | 48.99 | 75 | -0.31% | 0.12% |
| TRV | Travelers | | Financials | 214.32 | 58 | 0.02% | 0.12% |
| AMCR | Amcor | | Consumer Staples | 8.98 | 45 | -0.55% | 0.11% |
| BDX | Becton Dickinson | | Health Care | 234.36 | 25 | 0.21% | 0.10% |
| BG | Bunge | | Consumer Staples | 109.62 | 93 | -0.12% | 0.09% |
| CI | Cigna | | Health Care | 352.65 | 75 | -0.15% | 0.07% |
| ITW | Illinois Tool | | Industrials | 250.64 | 32 | 0.27% | 0.07% |
| EXC | Exelon | | Utilities | 37.56 | 88 | -0.29% | 0.03% |
| CSCO | Cisco Systems | | Technology | 48.32 | 42 | 0.37% | 0.00% |
| ACN | Accenture | | Technology | 316.83 | 35 | -0.19% | -0.02% |
| DUK | Duke | | Utilities | 98.20 | 100 | 0.08% | -0.04% |
| T | AT&T | | Technology | 16.50 | 32 | 1.16% | -0.06% |
| PNR | Pentair | | Industrials | 78.47 | 44 | -0.92% | -0.08% |
| TAP | Molson Coors | | Consumer Staples | 64.18 | 44 | -0.53% | -0.08% |
| FAST | Fastenal | | Services & Goods | 67.51 | 25 | 0.09% | -0.09% |
| EA | Electronic Arts | | Technology | 127.14 | 42 | 0.02% | -0.10% |
| AVY | Avery Dennison | | Consumer Staples | 211.33 | 51 | -0.21% | -0.11% |
| HUM | Humana | | Health Care | 327.98 | 57 | 0.82% | -0.11% |
| DD | DuPont de | | Materials | 73.80 | 54 | -0.15% | -0.12% |
| For chart view version of above stock list: Chart View ➞ 0 - 25 , 25 - 50 , 50 - 75 , 75 - 100 , 100 - 125 , 125 - 150 , 150 - 175 , 175 - 200 , 200 - 225 , 225 - 250 , 250 - 275 , 275 - 300 , 300 - 325 , 325 - 350 , 350 - 375 , 375 - 400 , 400 - 425 , 425 - 450 , 450 - 475 , 475 - 500 | ||
 | Click To Change The Sort Order: By Market Cap or Company Size Performance: Year-to-date, Week and Day |  |
|
Get the most comprehensive stock market coverage daily at 12Stocks.com ➞ Best Stocks Today ➞ Best Stocks Weekly ➞ Best Stocks Year-to-Date ➞ Best Stocks Trends ➞  Best Stocks Today 12Stocks.com Best Nasdaq Stocks ➞ Best S&P 500 Stocks ➞ Best Tech Stocks ➞ Best Biotech Stocks ➞ |
| Detailed Overview of S&P 500 Stocks |
| S&P 500 Technical Overview, Leaders & Laggards, Top S&P 500 ETF Funds & Detailed S&P 500 Stocks List, Charts, Trends & More |
| S&P 500: Technical Analysis, Trends & YTD Performance | |
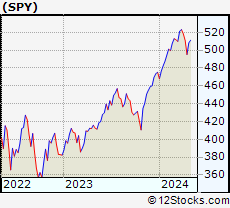
| S&P 500 index as represented by
SPY, an exchange-traded fund [ETF], holds basket of five hundred (mostly largecap) stocks from across all major sectors of the US stock market. The S&P 500 index (contains stocks like Apple and Exxon) is up by 6.38% and is currently outperforming the overall market by 0.74% year-to-date. Below is a quick view of technical charts and trends: | |
 SPY Weekly Chart |
|
| Long Term Trend: Good | |
| Medium Term Trend: Not Good | |
 SPY Daily Chart |
|
| Short Term Trend: Very Good | |
| Overall Trend Score: 58 | |
| YTD Performance: 6.38% | |
| **Trend Scores & Views Are Only For Educational Purposes And Not For Investing | |
| 12Stocks.com: Investing in S&P 500 Index using Exchange Traded Funds | |
|
The following table shows list of key exchange traded funds (ETF) that
help investors track S&P 500 index. The following list also includes leveraged ETF funds that track twice or thrice the daily returns of S&P 500 indices. Short or inverse ETF funds move in the opposite direction to the index they track and are useful during market pullbacks or during bear markets. Quick View: Move mouse or cursor over ETF symbol (ticker) to view short-term technical chart and over ETF name to view long term chart. Click on ticker or stock name for detailed view. Click on to add stock symbol to your watchlist and to view watchlist. |
12Stocks.com List of ETFs that track S&P 500 Index
| Ticker | ETF Name | Watchlist | Recent Price | Smart Investing & Trading Score | Change % | Week % | Year-to-date % |
| SPY | SPDR S&P 500 ETF | | 505.65 | 58 | 1.19 | 2.12 | 6.38% |
| IVV | iShares Core S&P 500 ETF | | 508.17 | 58 | 2.00 | 2.14 | 6.39% |
| VOO | Vanguard 500 ETF | | 464.84 | 58 | 2.03 | 2.14 | 6.42% |
| OEF | iShares S&P 100 | | 239.95 | 58 | 1.33 | 2.25 | 7.41% |
| SSO | ProShares Ultra S&P500 | | 72.04 | 63 | 2.43 | 4.24 | 10.71% |
| UPRO | ProShares UltraPro S&P500 | | 62.93 | 58 | 3.59 | 6.37 | 14.96% |
| SPXL | Direxion Daily S&P500 Bull 3X ETF | | 119.51 | 58 | 3.52 | 6.18 | 14.92% |
| SH | ProShares Short S&P500 | | 12.34 | 42 | -1.20 | -1.99 | -5% |
| SDS | ProShares UltraShort S&P500 | | 26.78 | 37 | -2.30 | -4.01 | -10.49% |
| SPXU | ProShares UltraPro Short S&P500 | | 35.99 | 42 | -3.62 | -6.1 | -16.3% |
| SPXS | Direxion Daily S&P 500 Bear 3X ETF | | 9.75 | 32 | -5.43 | -5.89 | -15.58% |
| 12Stocks.com: Charts, Trends, Fundamental Data and Performances of S&P 500 Stocks | |
|
We now take in-depth look at all S&P 500 stocks including charts, multi-period performances and overall trends (as measured by Smart Investing & Trading Score). One can sort S&P 500 stocks (click link to choose) by Daily, Weekly and by Year-to-Date performances. Also, one can sort by size of the company or by market capitalization. |
| Select Your Default Chart Type: | |||||
| |||||
| Click on stock symbol or name for detailed view. Click on to add stock symbol to your watchlist and to view watchlist. Quick View: Move mouse or cursor over "Daily" to quickly view daily technical stock chart and over "Weekly" to view weekly technical stock chart. | |||||

 | SPGI S&P Global Inc. |
| Sector: Services & Goods | |
| SubSector: Business Services | |
| MarketCap: 55247.9 Millions | |
| Recent Price: 413.26 Smart Investing & Trading Score: 35 | |
| Day Percent Change: -0.88% Day Change: -3.67 | |
| Week Change: 0.17% Year-to-date Change: -6.2% | |
| SPGI Links: Profile News Message Board | |
| Charts:- Daily , Weekly | |
| Add SPGI to Watchlist: View: Get SPGI Trend Analysis ➞ | |
 | JBHT J.B. Hunt Transport Services, Inc. |
| Sector: Transports | |
| SubSector: Trucking | |
| MarketCap: 9074 Millions | |
| Recent Price: 167.55 Smart Investing & Trading Score: 25 | |
| Day Percent Change: 0.10% Day Change: 0.17 | |
| Week Change: 0.15% Year-to-date Change: -16.1% | |
| JBHT Links: Profile News Message Board | |
| Charts:- Daily , Weekly | |
| Add JBHT to Watchlist: View: Get JBHT Trend Analysis ➞ | |
 | DOW Dow Inc. |
| Sector: Materials | |
| SubSector: Chemicals - Major Diversified | |
| MarketCap: 24098.6 Millions | |
| Recent Price: 56.74 Smart Investing & Trading Score: 61 | |
| Day Percent Change: -0.44% Day Change: -0.25 | |
| Week Change: 0.14% Year-to-date Change: 3.5% | |
| DOW Links: Profile News Message Board | |
| Charts:- Daily , Weekly | |
| Add DOW to Watchlist: View: Get DOW Trend Analysis ➞ | |
 | LYV Live Nation Entertainment, Inc. |
| Sector: Services & Goods | |
| SubSector: Entertainment - Diversified | |
| MarketCap: 8457.17 Millions | |
| Recent Price: 90.09 Smart Investing & Trading Score: 58 | |
| Day Percent Change: 1.85% Day Change: 1.64 | |
| Week Change: 0.14% Year-to-date Change: -3.8% | |
| LYV Links: Profile News Message Board | |
| Charts:- Daily , Weekly | |
| Add LYV to Watchlist: View: Get LYV Trend Analysis ➞ | |
 | PNW Pinnacle West Capital Corporation |
| Sector: Utilities | |
| SubSector: Electric Utilities | |
| MarketCap: 8240.24 Millions | |
| Recent Price: 74.50 Smart Investing & Trading Score: 100 | |
| Day Percent Change: -0.27% Day Change: -0.20 | |
| Week Change: 0.13% Year-to-date Change: 3.7% | |
| PNW Links: Profile News Message Board | |
| Charts:- Daily , Weekly | |
| Add PNW to Watchlist: View: Get PNW Trend Analysis ➞ | |
 | ORLY O Reilly Automotive, Inc. |
| Sector: Services & Goods | |
| SubSector: Auto Parts Stores | |
| MarketCap: 22391.5 Millions | |
| Recent Price: 1092.35 Smart Investing & Trading Score: 36 | |
| Day Percent Change: 0.08% Day Change: 0.89 | |
| Week Change: 0.13% Year-to-date Change: 15.0% | |
| ORLY Links: Profile News Message Board | |
| Charts:- Daily , Weekly | |
| Add ORLY to Watchlist: View: Get ORLY Trend Analysis ➞ | |
 | BMY Bristol-Myers Squibb Company |
| Sector: Health Care | |
| SubSector: Drug Manufacturers - Major | |
| MarketCap: 117052 Millions | |
| Recent Price: 48.99 Smart Investing & Trading Score: 75 | |
| Day Percent Change: -0.31% Day Change: -0.15 | |
| Week Change: 0.12% Year-to-date Change: -4.5% | |
| BMY Links: Profile News Message Board | |
| Charts:- Daily , Weekly | |
| Add BMY to Watchlist: View: Get BMY Trend Analysis ➞ | |
 | TRV The Travelers Companies, Inc. |
| Sector: Financials | |
| SubSector: Property & Casualty Insurance | |
| MarketCap: 25155.9 Millions | |
| Recent Price: 214.32 Smart Investing & Trading Score: 58 | |
| Day Percent Change: 0.02% Day Change: 0.05 | |
| Week Change: 0.12% Year-to-date Change: 12.5% | |
| TRV Links: Profile News Message Board | |
| Charts:- Daily , Weekly | |
| Add TRV to Watchlist: View: Get TRV Trend Analysis ➞ | |
 | AMCR Amcor plc |
| Sector: Consumer Staples | |
| SubSector: Packaging & Containers | |
| MarketCap: 13964 Millions | |
| Recent Price: 8.98 Smart Investing & Trading Score: 45 | |
| Day Percent Change: -0.55% Day Change: -0.05 | |
| Week Change: 0.11% Year-to-date Change: -6.9% | |
| AMCR Links: Profile News Message Board | |
| Charts:- Daily , Weekly | |
| Add AMCR to Watchlist: View: Get AMCR Trend Analysis ➞ | |
 | BDX Becton, Dickinson and Company |
| Sector: Health Care | |
| SubSector: Medical Instruments & Supplies | |
| MarketCap: 62758.4 Millions | |
| Recent Price: 234.36 Smart Investing & Trading Score: 25 | |
| Day Percent Change: 0.21% Day Change: 0.48 | |
| Week Change: 0.1% Year-to-date Change: -3.9% | |
| BDX Links: Profile News Message Board | |
| Charts:- Daily , Weekly | |
| Add BDX to Watchlist: View: Get BDX Trend Analysis ➞ | |
 | BG Bunge Limited |
| Sector: Consumer Staples | |
| SubSector: Farm Products | |
| MarketCap: 4975.77 Millions | |
| Recent Price: 109.62 Smart Investing & Trading Score: 93 | |
| Day Percent Change: -0.12% Day Change: -0.13 | |
| Week Change: 0.09% Year-to-date Change: 8.6% | |
| BG Links: Profile News Message Board | |
| Charts:- Daily , Weekly | |
| Add BG to Watchlist: View: Get BG Trend Analysis ➞ | |
 | CI Cigna Corporation |
| Sector: Health Care | |
| SubSector: Health Care Plans | |
| MarketCap: 60251.8 Millions | |
| Recent Price: 352.65 Smart Investing & Trading Score: 75 | |
| Day Percent Change: -0.15% Day Change: -0.53 | |
| Week Change: 0.07% Year-to-date Change: 17.8% | |
| CI Links: Profile News Message Board | |
| Charts:- Daily , Weekly | |
| Add CI to Watchlist: View: Get CI Trend Analysis ➞ | |
 | ITW Illinois Tool Works Inc. |
| Sector: Industrials | |
| SubSector: Diversified Machinery | |
| MarketCap: 45324.8 Millions | |
| Recent Price: 250.64 Smart Investing & Trading Score: 32 | |
| Day Percent Change: 0.27% Day Change: 0.68 | |
| Week Change: 0.07% Year-to-date Change: -4.3% | |
| ITW Links: Profile News Message Board | |
| Charts:- Daily , Weekly | |
| Add ITW to Watchlist: View: Get ITW Trend Analysis ➞ | |
 | EXC Exelon Corporation |
| Sector: Utilities | |
| SubSector: Diversified Utilities | |
| MarketCap: 34091.9 Millions | |
| Recent Price: 37.56 Smart Investing & Trading Score: 88 | |
| Day Percent Change: -0.29% Day Change: -0.11 | |
| Week Change: 0.03% Year-to-date Change: 4.6% | |
| EXC Links: Profile News Message Board | |
| Charts:- Daily , Weekly | |
| Add EXC to Watchlist: View: Get EXC Trend Analysis ➞ | |
 | CSCO Cisco Systems, Inc. |
| Sector: Technology | |
| SubSector: Communication Equipment | |
| MarketCap: 168483 Millions | |
| Recent Price: 48.32 Smart Investing & Trading Score: 42 | |
| Day Percent Change: 0.37% Day Change: 0.18 | |
| Week Change: 0% Year-to-date Change: -4.4% | |
| CSCO Links: Profile News Message Board | |
| Charts:- Daily , Weekly | |
| Add CSCO to Watchlist: View: Get CSCO Trend Analysis ➞ | |
 | ACN Accenture plc |
| Sector: Technology | |
| SubSector: Information Technology Services | |
| MarketCap: 106627 Millions | |
| Recent Price: 316.83 Smart Investing & Trading Score: 35 | |
| Day Percent Change: -0.19% Day Change: -0.59 | |
| Week Change: -0.02% Year-to-date Change: -9.7% | |
| ACN Links: Profile News Message Board | |
| Charts:- Daily , Weekly | |
| Add ACN to Watchlist: View: Get ACN Trend Analysis ➞ | |
 | DUK Duke Energy Corporation |
| Sector: Utilities | |
| SubSector: Electric Utilities | |
| MarketCap: 56678.2 Millions | |
| Recent Price: 98.20 Smart Investing & Trading Score: 100 | |
| Day Percent Change: 0.08% Day Change: 0.08 | |
| Week Change: -0.04% Year-to-date Change: 1.2% | |
| DUK Links: Profile News Message Board | |
| Charts:- Daily , Weekly | |
| Add DUK to Watchlist: View: Get DUK Trend Analysis ➞ | |
 | T AT&T Inc. |
| Sector: Technology | |
| SubSector: Telecom Services - Domestic | |
| MarketCap: 224847 Millions | |
| Recent Price: 16.50 Smart Investing & Trading Score: 32 | |
| Day Percent Change: 1.16% Day Change: 0.19 | |
| Week Change: -0.06% Year-to-date Change: -1.7% | |
| T Links: Profile News Message Board | |
| Charts:- Daily , Weekly | |
| Add T to Watchlist: View: Get T Trend Analysis ➞ | |
 | PNR Pentair plc |
| Sector: Industrials | |
| SubSector: Industrial Equipment & Components | |
| MarketCap: 4326.59 Millions | |
| Recent Price: 78.47 Smart Investing & Trading Score: 44 | |
| Day Percent Change: -0.92% Day Change: -0.73 | |
| Week Change: -0.08% Year-to-date Change: 7.9% | |
| PNR Links: Profile News Message Board | |
| Charts:- Daily , Weekly | |
| Add PNR to Watchlist: View: Get PNR Trend Analysis ➞ | |
 | TAP Molson Coors Beverage Company |
| Sector: Consumer Staples | |
| SubSector: Beverages - Brewers | |
| MarketCap: 8619.97 Millions | |
| Recent Price: 64.18 Smart Investing & Trading Score: 44 | |
| Day Percent Change: -0.53% Day Change: -0.34 | |
| Week Change: -0.08% Year-to-date Change: 4.9% | |
| TAP Links: Profile News Message Board | |
| Charts:- Daily , Weekly | |
| Add TAP to Watchlist: View: Get TAP Trend Analysis ➞ | |
 | FAST Fastenal Company |
| Sector: Services & Goods | |
| SubSector: Industrial Equipment Wholesale | |
| MarketCap: 17609.9 Millions | |
| Recent Price: 67.51 Smart Investing & Trading Score: 25 | |
| Day Percent Change: 0.09% Day Change: 0.06 | |
| Week Change: -0.09% Year-to-date Change: 4.2% | |
| FAST Links: Profile News Message Board | |
| Charts:- Daily , Weekly | |
| Add FAST to Watchlist: View: Get FAST Trend Analysis ➞ | |
 | EA Electronic Arts Inc. |
| Sector: Technology | |
| SubSector: Multimedia & Graphics Software | |
| MarketCap: 27296.5 Millions | |
| Recent Price: 127.14 Smart Investing & Trading Score: 42 | |
| Day Percent Change: 0.02% Day Change: 0.02 | |
| Week Change: -0.1% Year-to-date Change: -7.1% | |
| EA Links: Profile News Message Board | |
| Charts:- Daily , Weekly | |
| Add EA to Watchlist: View: Get EA Trend Analysis ➞ | |
 | AVY Avery Dennison Corporation |
| Sector: Consumer Staples | |
| SubSector: Business Equipment | |
| MarketCap: 8051.27 Millions | |
| Recent Price: 211.33 Smart Investing & Trading Score: 51 | |
| Day Percent Change: -0.21% Day Change: -0.44 | |
| Week Change: -0.11% Year-to-date Change: 4.5% | |
| AVY Links: Profile News Message Board | |
| Charts:- Daily , Weekly | |
| Add AVY to Watchlist: View: Get AVY Trend Analysis ➞ | |
 | HUM Humana Inc. |
| Sector: Health Care | |
| SubSector: Health Care Plans | |
| MarketCap: 34125.6 Millions | |
| Recent Price: 327.98 Smart Investing & Trading Score: 57 | |
| Day Percent Change: 0.82% Day Change: 2.68 | |
| Week Change: -0.11% Year-to-date Change: -28.4% | |
| HUM Links: Profile News Message Board | |
| Charts:- Daily , Weekly | |
| Add HUM to Watchlist: View: Get HUM Trend Analysis ➞ | |
 | DD DuPont de Nemours, Inc. |
| Sector: Materials | |
| SubSector: Agricultural Chemicals | |
| MarketCap: 25631.6 Millions | |
| Recent Price: 73.80 Smart Investing & Trading Score: 54 | |
| Day Percent Change: -0.15% Day Change: -0.11 | |
| Week Change: -0.12% Year-to-date Change: -4.1% | |
| DD Links: Profile News Message Board | |
| Charts:- Daily , Weekly | |
| Add DD to Watchlist: View: Get DD Trend Analysis ➞ | |
| For tabular summary view of above stock list: Summary View ➞ 0 - 25 , 25 - 50 , 50 - 75 , 75 - 100 , 100 - 125 , 125 - 150 , 150 - 175 , 175 - 200 , 200 - 225 , 225 - 250 , 250 - 275 , 275 - 300 , 300 - 325 , 325 - 350 , 350 - 375 , 375 - 400 , 400 - 425 , 425 - 450 , 450 - 475 , 475 - 500 | ||
| Click To Change The Sort Order: By Market Cap or Company Size Performance: Year-to-date, Week and Day | |
| Select Chart Type: | ||
|
Best Stocks Today 12Stocks.com |
© 2024 12Stocks.com Terms & Conditions Privacy Contact Us
All Information Provided Only For Education And Not To Be Used For Investing or Trading. See Terms & Conditions


One More Thing ... Get Best Stocks Delivered Daily!
Never Ever Miss A Move With Our Top Ten Stocks Lists
Find Best Stocks In Any Market - Bull or Bear Market
Take A Peek At Our Top Ten Stocks Lists: Daily, Weekly, Year-to-Date & Top Trends
Find Best Stocks In Any Market - Bull or Bear Market
Take A Peek At Our Top Ten Stocks Lists: Daily, Weekly, Year-to-Date & Top Trends
S&P 500 Stocks With Best Up Trends [0-bearish to 100-bullish]: Danaher [100], Kimberly-Clark [100], Quest Diagnostics[100], Hasbro [100], Philip Morris[100], American Express[100], Morgan Stanley[100], Federal Realty[100], Bank of America[100], Goldman Sachs[100], Generac Holdings[100]
Best S&P 500 Stocks Year-to-Date:
NVIDIA [66.44%], Constellation [60.75%], Meta Platforms[40.09%], NRG [38.28%], Marathon [34.57%], Progressive [34.37%], Targa Resources[33.54%], Western Digital[33.51%], Micron [31.78%], Diamondback [31.78%], United Airlines[30.95%] Best S&P 500 Stocks This Week:
Globe Life[13.52%], General Electric[9.83%], NVIDIA [8.17%], Danaher [7.47%], Enphase [7.28%], Kimberly-Clark [7.26%], Pulte [6.95%], Norwegian Cruise[6.83%], Ford Motor[6.59%], General Motors[6.44%], Quest Diagnostics[6.43%] Best S&P 500 Stocks Daily:
Globe Life[14.11%], General Electric[8.28%], Danaher [7.21%], Kimberly-Clark [5.51%], Norwegian Cruise[5.39%], United Rentals[5.09%], Quest Diagnostics[5.08%], Builders FirstSource[5.07%], Thermo Fisher[4.78%], Waters [4.70%], Pulte [4.57%]