
 Login Sign Up


| |||||
 |  | ||||

| 12Stocks.com Market Intelligence |
Best S&P 500 Stocks
|
On this page, you will find the most comprehensive analysis of S&P 500 stocks and ETFs - from latest trends to performances to charts ➞. First, here are the year-to-date (YTD) performances of the most requested S&P 500 stocks at 12Stocks.com (click stock for review):
| NVIDIA 45% | ||
| Boeing 33% | ||
| Intel 25% | ||
| Microsoft 23% | ||
| Johnson & Johnson 18% | ||
| Gilead 18% | ||
| Goldman Sachs 18% | ||
| JPMorgan Chase 14% | ||
| Caterpillar 14% | ||
| Chevron 10% | ||
| McDonald s 10% | ||
| Google 5% | ||
| Walmart -1% | ||
| Apple -1% | ||
| Amazon.com -4% | ||
| Merck -13% | ||
| Starbucks -17% | ||
| Quick: S&P 500 Stocks Lists: Performances & Trends, S&P 500 Stock Charts
Sort S&P 500 stocks: Daily, Weekly, Year-to-Date, Market Cap & Trends. Filter S&P 500 stocks list by sector: Show all, Tech, Finance, Energy, Staples, Retail, Industrial, Materials, Utilities and HealthCare |
| 12Stocks.com S&P 500 Stocks Performances & Trends Daily Report | |||||||||
|
| 
The overall Smart Investing & Trading Score is 60 (0-bearish to 100-bullish) which puts S&P 500 index in short term neutral to bullish trend. The Smart Investing & Trading Score from previous trading session is 100 and a deterioration of trend continues. | ||||||||
Here are the Smart Investing & Trading Scores of the most requested S&P 500 stocks at 12Stocks.com (click stock name for detailed review):
|


| 12Stocks.com: Top Performing S&P 500 Index Stocks | ||||||||||||||||||||||||||||||||||||||||||||||||
 The top performing S&P 500 Index stocks year to date are
Now, more recently, over last week, the top performing S&P 500 Index stocks on the move are


|
||||||||||||||||||||||||||||||||||||||||||||||||
| 12Stocks.com: Investing in S&P 500 Index with Stocks | |
|
The following table helps investors and traders sort through current performance and trends (as measured by Smart Investing & Trading Score) of various
stocks in the S&P 500 Index. Quick View: Move mouse or cursor over stock symbol (ticker) to view short-term technical chart and over stock name to view long term chart. Click on  to add stock symbol to your watchlist and to add stock symbol to your watchlist and  to view watchlist. Click on any ticker or stock name for detailed market intelligence report for that stock. to view watchlist. Click on any ticker or stock name for detailed market intelligence report for that stock. |
12Stocks.com Performance of Stocks in S&P 500 Index
| Ticker | Stock Name | Watchlist | Category | Recent Price | Smart Investing & Trading Score | Change % | YTD Change% |
| ADSK | Autodesk |   | Technology | 314.7 | 90 | 9.09 | 1.08% |
| EIX | Edison | | Utilities | 56.44 | 80 | 3.14 | 7.82% |
| EMN | Eastman Chemical | | Materials | 70.23 | 70 | 3.01 | -28.12% |
| SJM | J. M. | | Consumer Staples | 109.9 | 60 | 2.98 | 4.89% |
| MOH | Molina Healthcare | | Health Care | 179.37 | 70 | 2.66 | -42.22% |
| ELV | streetTRACKS Large | | ETF | 318.56 | 30 | 2.63 | -19.16% |
| UNH | UnitedHealth | | Health Care | 309.87 | 70 | 2.51 | -42.23% |
| PCG | PG&E | | Utilities | 15.34 | 70 | 2.33 | -1.66% |
| LW | Lamb Weston | | Consumer Staples | 57.56 | 90 | 2.33 | -2.65% |
| COO | Cooper | | Health Care | 65.98 | 20 | 2.17 | -31.66% |
| NEM | Newmont | | Materials | 74.4 | 100 | 1.96 | 76.03% |
| SRE | Sempra | | Utilities | 83.01 | 100 | 1.93 | 1.89% |
| CNC | Centene | | Health Care | 28.92 | 60 | 1.90 | -54.83% |
| SPXU | ProShares UltraPro | | Utilities | 15.05 | 60 | 1.90 | -26.52% |
| DPZ | Domino s | | Services & Goods | 457.08 | 60 | 1.81 | 2.58% |
| HSY | Hershey | | Consumer Staples | 183.09 | 70 | 1.72 | 24.77% |
| DGX | Quest Diagnostics | | Health Care | 182.14 | 90 | 1.64 | 12.73% |
| GIS | General Mills | | Consumer Staples | 49.17 | 50 | 1.51 | -16.39% |
| ACN | Accenture | | Technology | 259.97 | 70 | 1.48 | -31.79% |
| RHI | Robert Half | | Services & Goods | 37.06 | 70 | 1.45 | -41.49% |
| CAG | Conagra Brands | | Consumer Staples | 19.06 | 50 | 1.44 | -23.94% |
| HRL | Hormel Foods | | Consumer Staples | 25.58 | 0 | 1.43 | -13.03% |
| BIO | Bio-Rad | | Health Care | 297.83 | 90 | 1.42 | -17.47% |
| IQV | IQVIA Holdings | | Health Care | 191.4 | 70 | 1.41 | -4.95% |
| CVS | CVS Health | | Health Care | 73.15 | 100 | 1.40 | 32.28% |
| For chart view version of above stock list: Chart View ➞ 0 - 25 , 25 - 50 , 50 - 75 , 75 - 100 , 100 - 125 , 125 - 150 , 150 - 175 , 175 - 200 , 200 - 225 , 225 - 250 , 250 - 275 , 275 - 300 , 300 - 325 , 325 - 350 , 350 - 375 , 375 - 400 , 400 - 425 , 425 - 450 , 450 - 475 , 475 - 500 | ||
 | Click To Change The Sort Order: By Market Cap or Company Size Performance: Year-to-date, Week and Day |  |
|
Get the most comprehensive stock market coverage daily at 12Stocks.com ➞ Best Stocks Today ➞ Best Stocks Weekly ➞ Best Stocks Year-to-Date ➞ Best Stocks Trends ➞  Best Stocks Today 12Stocks.com Best Nasdaq Stocks ➞ Best S&P 500 Stocks ➞ Best Tech Stocks ➞ Best Biotech Stocks ➞ |
| Detailed Overview of S&P 500 Stocks |
| S&P 500 Technical Overview, Leaders & Laggards, Top S&P 500 ETF Funds & Detailed S&P 500 Stocks List, Charts, Trends & More |
| S&P 500: Technical Analysis, Trends & YTD Performance | |
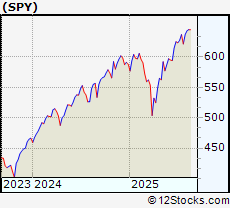
| S&P 500 index as represented by
SPY, an exchange-traded fund [ETF], holds basket of five hundred (mostly largecap) stocks from across all major sectors of the US stock market. The S&P 500 index (contains stocks like Apple and Exxon) is up by 7.83% and is currently outperforming the overall market by 0.57% year-to-date. Below is a quick view of technical charts and trends: | |
 SPY Weekly Chart |
|
| Long Term Trend: Very Good | |
| Medium Term Trend: Very Good | |
 SPY Daily Chart |
|
| Short Term Trend: Not Good | |
| Overall Trend Score: 60 | |
| YTD Performance: 7.83% | |
| **Trend Scores & Views Are Only For Educational Purposes And Not For Investing | |
| 12Stocks.com: Investing in S&P 500 Index using Exchange Traded Funds | |
|
The following table shows list of key exchange traded funds (ETF) that
help investors track S&P 500 index. The following list also includes leveraged ETF funds that track twice or thrice the daily returns of S&P 500 indices. Short or inverse ETF funds move in the opposite direction to the index they track and are useful during market pullbacks or during bear markets. Quick View: Move mouse or cursor over ETF symbol (ticker) to view short-term technical chart and over ETF name to view long term chart. Click on ticker or stock name for detailed view. Click on to add stock symbol to your watchlist and to view watchlist. |
12Stocks.com List of ETFs that track S&P 500 Index
| Ticker | ETF Name | Watchlist | Recent Price | Smart Investing & Trading Score | Change % | Week % | Year-to-date % |
| SPY | SPDR S&P 500 ETF | | 645.05 | 60 | -0.6 | -0.04 | 7.83% |
| IVV | iShares Core S&P 500 ETF | | 649.80 | 70 | -0.39 | -1.45 | 9.17% |
| VOO | Vanguard 500 ETF | | 594.40 | 70 | -0.39 | -1.45 | 9.15% |
| OEF | iShares S&P 100 | | 321.26 | 60 | 1.47 | -0.41 | 8.89% |
| SSO | ProShares Ultra S&P500 | | 105.28 | 60 | -1.22 | -0.18 | 9.1% |
| UPRO | ProShares UltraPro S&P500 | | 101.63 | 60 | -1.9 | -0.34 | 8% |
| SPXL | Direxion Daily S&P500 Bull 3X ETF | | 194.66 | 60 | -1.22 | -4.54 | 10.56% |
| SH | ProShares Short S&P500 | | 38.48 | 40 | 0.71 | 0.21 | -5.62% |
| SDS | ProShares UltraShort S&P500 | | 15.55 | 50 | 1.37 | 0.32 | -15.37% |
| SPXU | ProShares UltraPro Short S&P500 | | 15.05 | 60 | 1.9 | 0.33 | -26.52% |
| SPXS | Direxion Daily S&P 500 Bear 3X ETF | | 4.17 | 60 | 1.38 | 5.01 | -28.57% |
| 12Stocks.com: Charts, Trends, Fundamental Data and Performances of S&P 500 Stocks | |
|
We now take in-depth look at all S&P 500 stocks including charts, multi-period performances and overall trends (as measured by Smart Investing & Trading Score). One can sort S&P 500 stocks (click link to choose) by Daily, Weekly and by Year-to-Date performances. Also, one can sort by size of the company or by market capitalization. |
| Select Your Default Chart Type: | |||||
| |||||
| Click on stock symbol or name for detailed view. Click on to add stock symbol to your watchlist and to view watchlist. Quick View: Move mouse or cursor over "Daily" to quickly view daily technical stock chart and over "Weekly" to view weekly technical stock chart. | |||||

 | ADSK Autodesk, Inc. |
| Sector: Technology | |
| SubSector: Technical & System Software | |
| MarketCap: 36975.8 Millions | |
| Recent Price: 314.7 Smart Investing & Trading Score: 90 | |
| Day Percent Change: 9.09% Day Change: 26.21 | |
| Week Change: 8.43% Year-to-date Change: 1.1% | |
| ADSK Links: Profile News Message Board | |
| Charts:- Daily , Weekly | |
| Add ADSK to Watchlist: View: Get ADSK Trend Analysis ➞ | |
 | EIX Edison International |
| Sector: Utilities | |
| SubSector: Electric Utilities | |
| MarketCap: 19358.1 Millions | |
| Recent Price: 56.44 Smart Investing & Trading Score: 80 | |
| Day Percent Change: 3.14% Day Change: 1.72 | |
| Week Change: 1.51% Year-to-date Change: 7.8% | |
| EIX Links: Profile News Message Board | |
| Charts:- Daily , Weekly | |
| Add EIX to Watchlist: View: Get EIX Trend Analysis ➞ | |
 | EMN Eastman Chemical Company |
| Sector: Materials | |
| SubSector: Chemicals - Major Diversified | |
| MarketCap: 6217.06 Millions | |
| Recent Price: 70.23 Smart Investing & Trading Score: 70 | |
| Day Percent Change: 3.01% Day Change: 2.05 | |
| Week Change: 1.14% Year-to-date Change: -28.1% | |
| EMN Links: Profile News Message Board | |
| Charts:- Daily , Weekly | |
| Add EMN to Watchlist: View: Get EMN Trend Analysis ➞ | |
 | SJM The J. M. Smucker Company |
| Sector: Consumer Staples | |
| SubSector: Processed & Packaged Goods | |
| MarketCap: 12635.8 Millions | |
| Recent Price: 109.9 Smart Investing & Trading Score: 60 | |
| Day Percent Change: 2.98% Day Change: 3.18 | |
| Week Change: -2.92% Year-to-date Change: 4.9% | |
| SJM Links: Profile News Message Board | |
| Charts:- Daily , Weekly | |
| Add SJM to Watchlist: View: Get SJM Trend Analysis ➞ | |
 | MOH Molina Healthcare, Inc. |
| Sector: Health Care | |
| SubSector: Health Care Plans | |
| MarketCap: 7235.6 Millions | |
| Recent Price: 179.37 Smart Investing & Trading Score: 70 | |
| Day Percent Change: 2.66% Day Change: 4.65 | |
| Week Change: 2.83% Year-to-date Change: -42.2% | |
| MOH Links: Profile News Message Board | |
| Charts:- Daily , Weekly | |
| Add MOH to Watchlist: View: Get MOH Trend Analysis ➞ | |
 | ELV streetTRACKS Large Cap Value |
| Sector: ETF | |
| SubSector: Exchange Traded Fund | |
| MarketCap: 0 Millions | |
| Recent Price: 318.56 Smart Investing & Trading Score: 30 | |
| Day Percent Change: 2.63% Day Change: 8.15 | |
| Week Change: 0.63% Year-to-date Change: -19.2% | |
| ELV Links: Profile News Message Board | |
| Charts:- Daily , Weekly | |
| Add ELV to Watchlist: View: Get ELV Trend Analysis ➞ | |
 | UNH UnitedHealth Group Incorporated |
| Sector: Health Care | |
| SubSector: Health Care Plans | |
| MarketCap: 217384 Millions | |
| Recent Price: 309.87 Smart Investing & Trading Score: 70 | |
| Day Percent Change: 2.51% Day Change: 7.58 | |
| Week Change: 0.8% Year-to-date Change: -42.2% | |
| UNH Links: Profile News Message Board | |
| Charts:- Daily , Weekly | |
| Add UNH to Watchlist: View: Get UNH Trend Analysis ➞ | |
 | PCG PG&E Corporation |
| Sector: Utilities | |
| SubSector: Electric Utilities | |
| MarketCap: 5078.04 Millions | |
| Recent Price: 15.34 Smart Investing & Trading Score: 70 | |
| Day Percent Change: 2.33% Day Change: 0.35 | |
| Week Change: 0.99% Year-to-date Change: -1.7% | |
| PCG Links: Profile News Message Board | |
| Charts:- Daily , Weekly | |
| Add PCG to Watchlist: View: Get PCG Trend Analysis ➞ | |
 | LW Lamb Weston Holdings, Inc. |
| Sector: Consumer Staples | |
| SubSector: Food - Major Diversified | |
| MarketCap: 7844.63 Millions | |
| Recent Price: 57.56 Smart Investing & Trading Score: 90 | |
| Day Percent Change: 2.33% Day Change: 1.31 | |
| Week Change: 1% Year-to-date Change: -2.7% | |
| LW Links: Profile News Message Board | |
| Charts:- Daily , Weekly | |
| Add LW to Watchlist: View: Get LW Trend Analysis ➞ | |
 | COO The Cooper Companies, Inc. |
| Sector: Health Care | |
| SubSector: Medical Instruments & Supplies | |
| MarketCap: 15460 Millions | |
| Recent Price: 65.98 Smart Investing & Trading Score: 20 | |
| Day Percent Change: 2.17% Day Change: 1.4 | |
| Week Change: -12.28% Year-to-date Change: -31.7% | |
| COO Links: Profile News Message Board | |
| Charts:- Daily , Weekly | |
| Add COO to Watchlist: View: Get COO Trend Analysis ➞ | |
 | NEM Newmont Corporation |
| Sector: Materials | |
| SubSector: Gold | |
| MarketCap: 33928.8 Millions | |
| Recent Price: 74.4 Smart Investing & Trading Score: 100 | |
| Day Percent Change: 1.96% Day Change: 1.43 | |
| Week Change: 5.13% Year-to-date Change: 76.0% | |
| NEM Links: Profile News Message Board | |
| Charts:- Daily , Weekly | |
| Add NEM to Watchlist: View: Get NEM Trend Analysis ➞ | |
 | SRE Sempra Energy |
| Sector: Utilities | |
| SubSector: Diversified Utilities | |
| MarketCap: 34339.9 Millions | |
| Recent Price: 83.01 Smart Investing & Trading Score: 100 | |
| Day Percent Change: 1.93% Day Change: 1.57 | |
| Week Change: 0.13% Year-to-date Change: 1.9% | |
| SRE Links: Profile News Message Board | |
| Charts:- Daily , Weekly | |
| Add SRE to Watchlist: View: Get SRE Trend Analysis ➞ | |
 | CNC Centene Corporation |
| Sector: Health Care | |
| SubSector: Health Care Plans | |
| MarketCap: 29075 Millions | |
| Recent Price: 28.92 Smart Investing & Trading Score: 60 | |
| Day Percent Change: 1.9% Day Change: 0.54 | |
| Week Change: -1.67% Year-to-date Change: -54.8% | |
| CNC Links: Profile News Message Board | |
| Charts:- Daily , Weekly | |
| Add CNC to Watchlist: View: Get CNC Trend Analysis ➞ | |
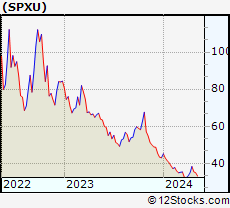 | SPXU ProShares UltraPro Short S&P500 |
| Sector: Utilities | |
| SubSector: Exchange Traded Fund | |
| MarketCap: 0 Millions | |
| Recent Price: 15.05 Smart Investing & Trading Score: 60 | |
| Day Percent Change: 1.9% Day Change: 0.28 | |
| Week Change: 0.33% Year-to-date Change: -26.5% | |
| SPXU Links: Profile News Message Board | |
| Charts:- Daily , Weekly | |
| Add SPXU to Watchlist: View: Get SPXU Trend Analysis ➞ | |
 | DPZ Domino s Pizza, Inc. |
| Sector: Services & Goods | |
| SubSector: Restaurants | |
| MarketCap: 12166 Millions | |
| Recent Price: 457.08 Smart Investing & Trading Score: 60 | |
| Day Percent Change: 1.81% Day Change: 8.12 | |
| Week Change: 1.35% Year-to-date Change: 2.6% | |
| DPZ Links: Profile News Message Board | |
| Charts:- Daily , Weekly | |
| Add DPZ to Watchlist: View: Get DPZ Trend Analysis ➞ | |
 | HSY The Hershey Company |
| Sector: Consumer Staples | |
| SubSector: Confectioners | |
| MarketCap: 27648.8 Millions | |
| Recent Price: 183.09 Smart Investing & Trading Score: 70 | |
| Day Percent Change: 1.72% Day Change: 3.1 | |
| Week Change: 0.91% Year-to-date Change: 24.8% | |
| HSY Links: Profile News Message Board | |
| Charts:- Daily , Weekly | |
| Add HSY to Watchlist: View: Get HSY Trend Analysis ➞ | |
 | DGX Quest Diagnostics Incorporated |
| Sector: Health Care | |
| SubSector: Medical Laboratories & Research | |
| MarketCap: 11076.1 Millions | |
| Recent Price: 182.14 Smart Investing & Trading Score: 90 | |
| Day Percent Change: 1.64% Day Change: 2.94 | |
| Week Change: 1.06% Year-to-date Change: 12.7% | |
| DGX Links: Profile News Message Board | |
| Charts:- Daily , Weekly | |
| Add DGX to Watchlist: View: Get DGX Trend Analysis ➞ | |
 | GIS General Mills, Inc. |
| Sector: Consumer Staples | |
| SubSector: Processed & Packaged Goods | |
| MarketCap: 34131.7 Millions | |
| Recent Price: 49.17 Smart Investing & Trading Score: 50 | |
| Day Percent Change: 1.51% Day Change: 0.73 | |
| Week Change: -2.01% Year-to-date Change: -16.4% | |
| GIS Links: Profile News Message Board | |
| Charts:- Daily , Weekly | |
| Add GIS to Watchlist: View: Get GIS Trend Analysis ➞ | |
 | ACN Accenture plc |
| Sector: Technology | |
| SubSector: Information Technology Services | |
| MarketCap: 106627 Millions | |
| Recent Price: 259.97 Smart Investing & Trading Score: 70 | |
| Day Percent Change: 1.48% Day Change: 3.8 | |
| Week Change: 0.29% Year-to-date Change: -31.8% | |
| ACN Links: Profile News Message Board | |
| Charts:- Daily , Weekly | |
| Add ACN to Watchlist: View: Get ACN Trend Analysis ➞ | |
 | RHI Robert Half International Inc. |
| Sector: Services & Goods | |
| SubSector: Staffing & Outsourcing Services | |
| MarketCap: 4302 Millions | |
| Recent Price: 37.06 Smart Investing & Trading Score: 70 | |
| Day Percent Change: 1.45% Day Change: 0.53 | |
| Week Change: -2.32% Year-to-date Change: -41.5% | |
| RHI Links: Profile News Message Board | |
| Charts:- Daily , Weekly | |
| Add RHI to Watchlist: View: Get RHI Trend Analysis ➞ | |
 | CAG Conagra Brands, Inc. |
| Sector: Consumer Staples | |
| SubSector: Processed & Packaged Goods | |
| MarketCap: 14084.1 Millions | |
| Recent Price: 19.06 Smart Investing & Trading Score: 50 | |
| Day Percent Change: 1.44% Day Change: 0.27 | |
| Week Change: -3.05% Year-to-date Change: -23.9% | |
| CAG Links: Profile News Message Board | |
| Charts:- Daily , Weekly | |
| Add CAG to Watchlist: View: Get CAG Trend Analysis ➞ | |
 | HRL Hormel Foods Corporation |
| Sector: Consumer Staples | |
| SubSector: Meat Products | |
| MarketCap: 25590.2 Millions | |
| Recent Price: 25.58 Smart Investing & Trading Score: 0 | |
| Day Percent Change: 1.43% Day Change: 0.36 | |
| Week Change: -12.55% Year-to-date Change: -13.0% | |
| HRL Links: Profile News Message Board | |
| Charts:- Daily , Weekly | |
| Add HRL to Watchlist: View: Get HRL Trend Analysis ➞ | |
 | BIO Bio-Rad Laboratories, Inc. |
| Sector: Health Care | |
| SubSector: Medical Laboratories & Research | |
| MarketCap: 10660 Millions | |
| Recent Price: 297.83 Smart Investing & Trading Score: 90 | |
| Day Percent Change: 1.42% Day Change: 4.16 | |
| Week Change: -1.97% Year-to-date Change: -17.5% | |
| BIO Links: Profile News Message Board | |
| Charts:- Daily , Weekly | |
| Add BIO to Watchlist: View: Get BIO Trend Analysis ➞ | |
 | IQV IQVIA Holdings Inc. |
| Sector: Health Care | |
| SubSector: Medical Laboratories & Research | |
| MarketCap: 19616.5 Millions | |
| Recent Price: 191.4 Smart Investing & Trading Score: 70 | |
| Day Percent Change: 1.41% Day Change: 2.67 | |
| Week Change: 0.13% Year-to-date Change: -5.0% | |
| IQV Links: Profile News Message Board | |
| Charts:- Daily , Weekly | |
| Add IQV to Watchlist: View: Get IQV Trend Analysis ➞ | |
 | CVS CVS Health Corporation |
| Sector: Health Care | |
| SubSector: Health Care Plans | |
| MarketCap: 80104.3 Millions | |
| Recent Price: 73.15 Smart Investing & Trading Score: 100 | |
| Day Percent Change: 1.4% Day Change: 1.01 | |
| Week Change: 2.59% Year-to-date Change: 32.3% | |
| CVS Links: Profile News Message Board | |
| Charts:- Daily , Weekly | |
| Add CVS to Watchlist: View: Get CVS Trend Analysis ➞ | |
| For tabular summary view of above stock list: Summary View ➞ 0 - 25 , 25 - 50 , 50 - 75 , 75 - 100 , 100 - 125 , 125 - 150 , 150 - 175 , 175 - 200 , 200 - 225 , 225 - 250 , 250 - 275 , 275 - 300 , 300 - 325 , 325 - 350 , 350 - 375 , 375 - 400 , 400 - 425 , 425 - 450 , 450 - 475 , 475 - 500 | ||
| Click To Change The Sort Order: By Market Cap or Company Size Performance: Year-to-date, Week and Day | |
| Select Chart Type: | ||
|
Best Stocks Today 12Stocks.com |
© 2025 12Stocks.com Terms & Conditions Privacy Contact Us
All Information Provided Only For Education And Not To Be Used For Investing or Trading. See Terms & Conditions


One More Thing ... Get Best Stocks Delivered Daily!
Never Ever Miss A Move With Our Top Ten Stocks Lists
Find Best Stocks In Any Market - Bull or Bear Market
Take A Peek At Our Top Ten Stocks Lists: Daily, Weekly, Year-to-Date & Top Trends
Find Best Stocks In Any Market - Bull or Bear Market
Take A Peek At Our Top Ten Stocks Lists: Daily, Weekly, Year-to-Date & Top Trends
S&P 500 Stocks With Best Up Trends [0-bearish to 100-bullish]: Newmont [100], Sempra [100], CVS Health[100], Apache [100], American Express[100], Humana [100], PNC Financial[100], Boston Properties[100], American Airlines[100], HP [100], Mastercard [100]
Best S&P 500 Stocks Year-to-Date:
Newmont [76.03%], Seagate [75.98%], Western Digital[63.34%], Amphenol [54.43%], IDEXX [53.12%], Dollar General[52.95%], Dollar Tree[48.93%], Wynn Resorts[46.72%], NVIDIA [45.09%], NRG [43.45%], Hasbro [42.34%] Best S&P 500 Stocks This Week:
Wynn Resorts[10.88%], V.F [9.71%], Autodesk [8.43%], Apache [7.58%], Fair Isaac[6.78%], Newmont [5.13%], Seagate [5.09%], Royal Caribbean[5.04%], Marathon [5.03%], Synchrony Financial[4.69%], Valero [4.5%] Best S&P 500 Stocks Daily:
Autodesk [9.09%], Edison [3.14%], Eastman Chemical[3.01%], J. M.[2.98%], Molina Healthcare[2.66%], streetTRACKS Large[2.63%], UnitedHealth [2.51%], PG&E [2.33%], Lamb Weston[2.33%], Cooper [2.17%], Newmont [1.96%]