
 Login Sign Up


| |||||
 |  | ||||

| 12Stocks.com Market Intelligence |
Best S&P 500 Stocks
|
On this page, you will find the most comprehensive analysis of S&P 500 stocks and ETFs - from latest trends to performances to charts ➞. First, here are the year-to-date (YTD) performances of the most requested S&P 500 stocks at 12Stocks.com (click stock for review):
| NVIDIA 61% | ||
| Caterpillar 23% | ||
| Merck 16% | ||
| Amazon.com 16% | ||
| Walmart 14% | ||
| Google 14% | ||
| JPMorgan Chase 14% | ||
| Chevron 10% | ||
| Goldman Sachs 10% | ||
| Microsoft 9% | ||
| Johnson & Johnson -5% | ||
| McDonald s -7% | ||
| Starbucks -8% | ||
| Apple -12% | ||
| Gilead -17% | ||
| Intel -31% | ||
| Boeing -37% | ||
| Quick: S&P 500 Stocks Lists: Performances & Trends, S&P 500 Stock Charts
Sort S&P 500 stocks: Daily, Weekly, Year-to-Date, Market Cap & Trends. Filter S&P 500 stocks list by sector: Show all, Tech, Finance, Energy, Staples, Retail, Industrial, Materials, Utilities and HealthCare |
| 12Stocks.com S&P 500 Stocks Performances & Trends Daily Report | |||||||||
|
| 
The overall Smart Investing & Trading Score is 58 (0-bearish to 100-bullish) which puts S&P 500 index in short term neutral trend. The Smart Investing & Trading Score from previous trading session is 51 and an improvement of trend continues. | ||||||||
Here are the Smart Investing & Trading Scores of the most requested S&P 500 stocks at 12Stocks.com (click stock name for detailed review):
|


| 12Stocks.com: Top Performing S&P 500 Index Stocks | ||||||||||||||||||||||||||||||||||||||||||||||||
 The top performing S&P 500 Index stocks year to date are
Now, more recently, over last week, the top performing S&P 500 Index stocks on the move are


|
||||||||||||||||||||||||||||||||||||||||||||||||
| 12Stocks.com: Investing in S&P 500 Index with Stocks | |
|
The following table helps investors and traders sort through current performance and trends (as measured by Smart Investing & Trading Score) of various
stocks in the S&P 500 Index. Quick View: Move mouse or cursor over stock symbol (ticker) to view short-term technical chart and over stock name to view long term chart. Click on  to add stock symbol to your watchlist and to add stock symbol to your watchlist and  to view watchlist. Click on any ticker or stock name for detailed market intelligence report for that stock. to view watchlist. Click on any ticker or stock name for detailed market intelligence report for that stock. |
12Stocks.com Performance of Stocks in S&P 500 Index
| Ticker | Stock Name | Watchlist | Category | Recent Price | Smart Investing & Trading Score | Change % | YTD Change% |
| MNST | Monster Beverage |   | Consumer Staples | 54.33 | 32 | 1.12 | -5.69% |
| MKC | McCormick & | | Consumer Staples | 75.85 | 88 | 1.11 | 10.86% |
| PEG | Public Service | | Utilities | 67.23 | 95 | 1.11 | 9.94% |
| D | Dominion | | Utilities | 51.23 | 100 | 1.11 | 9.00% |
| K | Kellogg | | Consumer Staples | 58.75 | 100 | 1.05 | 5.08% |
| IBM | Business | | Technology | 184.10 | 45 | 1.05 | 12.56% |
| EXR | Extra Space | | Financials | 134.64 | 35 | 1.02 | -16.02% |
| ZION | Zions Ban | | Financials | 42.17 | 80 | 1.01 | -3.88% |
| SBUX | Starbucks | | Services & Goods | 88.75 | 64 | 1.00 | -7.56% |
| FTNT | Fortinet | | Technology | 65.45 | 68 | 1.00 | 11.82% |
| EW | Edwards Life | | Health Care | 88.61 | 68 | 0.98 | 16.21% |
| CAG | Conagra Brands | | Consumer Staples | 31.57 | 100 | 0.96 | 10.15% |
| LW | Lamb Weston | | Consumer Staples | 84.52 | 64 | 0.96 | -21.81% |
| HBAN | Huntington Bancshares | | Financials | 13.76 | 100 | 0.95 | 8.18% |
| AEP | American Electric | | Utilities | 86.37 | 100 | 0.95 | 6.34% |
| AZO | AutoZone | | Services & Goods | 2988.51 | 51 | 0.93 | 15.58% |
| KR | Kroger Co | | Services & Goods | 56.15 | 61 | 0.93 | 22.84% |
| BWA | BorgWarner | | Consumer Staples | 33.65 | 47 | 0.93 | -6.14% |
| ALB | Albemarle | | Materials | 115.27 | 55 | 0.93 | -20.22% |
| AEE | Ameren | | Utilities | 74.71 | 93 | 0.93 | 3.28% |
| IQV | IQVIA Holdings | | Health Care | 240.84 | 60 | 0.93 | 4.09% |
| NI | NiSource | | Utilities | 28.18 | 100 | 0.90 | 6.14% |
| SO | Southern | | Utilities | 73.91 | 100 | 0.90 | 5.41% |
| CF | CF Industries | | Materials | 79.25 | 54 | 0.90 | -0.31% |
| BK | Bank of New York | | Financials | 57.95 | 100 | 0.89 | 11.34% |
| For chart view version of above stock list: Chart View ➞ 0 - 25 , 25 - 50 , 50 - 75 , 75 - 100 , 100 - 125 , 125 - 150 , 150 - 175 , 175 - 200 , 200 - 225 , 225 - 250 , 250 - 275 , 275 - 300 , 300 - 325 , 325 - 350 , 350 - 375 , 375 - 400 , 400 - 425 , 425 - 450 , 450 - 475 , 475 - 500 | ||
 | Click To Change The Sort Order: By Market Cap or Company Size Performance: Year-to-date, Week and Day |  |
|
Get the most comprehensive stock market coverage daily at 12Stocks.com ➞ Best Stocks Today ➞ Best Stocks Weekly ➞ Best Stocks Year-to-Date ➞ Best Stocks Trends ➞  Best Stocks Today 12Stocks.com Best Nasdaq Stocks ➞ Best S&P 500 Stocks ➞ Best Tech Stocks ➞ Best Biotech Stocks ➞ |
| Detailed Overview of S&P 500 Stocks |
| S&P 500 Technical Overview, Leaders & Laggards, Top S&P 500 ETF Funds & Detailed S&P 500 Stocks List, Charts, Trends & More |
| S&P 500: Technical Analysis, Trends & YTD Performance | |
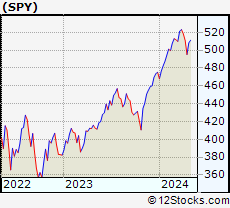
| S&P 500 index as represented by
SPY, an exchange-traded fund [ETF], holds basket of five hundred (mostly largecap) stocks from across all major sectors of the US stock market. The S&P 500 index (contains stocks like Apple and Exxon) is up by 6.33% and is currently outperforming the overall market by 0.67% year-to-date. Below is a quick view of technical charts and trends: | |
 SPY Weekly Chart |
|
| Long Term Trend: Good | |
| Medium Term Trend: Not Good | |
 SPY Daily Chart |
|
| Short Term Trend: Very Good | |
| Overall Trend Score: 58 | |
| YTD Performance: 6.33% | |
| **Trend Scores & Views Are Only For Educational Purposes And Not For Investing | |
| 12Stocks.com: Investing in S&P 500 Index using Exchange Traded Funds | |
|
The following table shows list of key exchange traded funds (ETF) that
help investors track S&P 500 index. The following list also includes leveraged ETF funds that track twice or thrice the daily returns of S&P 500 indices. Short or inverse ETF funds move in the opposite direction to the index they track and are useful during market pullbacks or during bear markets. Quick View: Move mouse or cursor over ETF symbol (ticker) to view short-term technical chart and over ETF name to view long term chart. Click on ticker or stock name for detailed view. Click on to add stock symbol to your watchlist and to view watchlist. |
12Stocks.com List of ETFs that track S&P 500 Index
| Ticker | ETF Name | Watchlist | Recent Price | Smart Investing & Trading Score | Change % | Week % | Year-to-date % |
| SPY | SPDR S&P 500 ETF | | 505.41 | 58 | -0.05 | 2.07 | 6.33% |
| IVV | iShares Core S&P 500 ETF | | 507.97 | 63 | -0.04 | 2.1 | 6.35% |
| VOO | Vanguard 500 ETF | | 464.50 | 63 | -0.07 | 2.07 | 6.34% |
| OEF | iShares S&P 100 | | 239.79 | 58 | -0.07 | 2.18 | 7.34% |
| SSO | ProShares Ultra S&P500 | | 71.95 | 58 | -0.12 | 4.11 | 10.57% |
| UPRO | ProShares UltraPro S&P500 | | 62.88 | 58 | -0.08 | 6.29 | 14.87% |
| SPXL | Direxion Daily S&P500 Bull 3X ETF | | 119.35 | 63 | -0.13 | 6.04 | 14.77% |
| SH | ProShares Short S&P500 | | 12.33 | 42 | -0.08 | -2.07 | -5.08% |
| SDS | ProShares UltraShort S&P500 | | 26.80 | 37 | 0.07 | -3.94 | -10.43% |
| SPXU | ProShares UltraPro Short S&P500 | | 36.04 | 42 | 0.14 | -5.97 | -16.19% |
| SPXS | Direxion Daily S&P 500 Bear 3X ETF | | 9.75 | 32 | 0.00 | -5.89 | -15.58% |
| 12Stocks.com: Charts, Trends, Fundamental Data and Performances of S&P 500 Stocks | |
|
We now take in-depth look at all S&P 500 stocks including charts, multi-period performances and overall trends (as measured by Smart Investing & Trading Score). One can sort S&P 500 stocks (click link to choose) by Daily, Weekly and by Year-to-Date performances. Also, one can sort by size of the company or by market capitalization. |
| Select Your Default Chart Type: | |||||
| |||||
| Click on stock symbol or name for detailed view. Click on to add stock symbol to your watchlist and to view watchlist. Quick View: Move mouse or cursor over "Daily" to quickly view daily technical stock chart and over "Weekly" to view weekly technical stock chart. | |||||

 | MNST Monster Beverage Corporation |
| Sector: Consumer Staples | |
| SubSector: Beverages - Soft Drinks | |
| MarketCap: 30126.8 Millions | |
| Recent Price: 54.33 Smart Investing & Trading Score: 32 | |
| Day Percent Change: 1.12% Day Change: 0.60 | |
| Week Change: 2.24% Year-to-date Change: -5.7% | |
| MNST Links: Profile News Message Board | |
| Charts:- Daily , Weekly | |
| Add MNST to Watchlist: View: Get MNST Trend Analysis ➞ | |
 | MKC McCormick & Company, Incorporated |
| Sector: Consumer Staples | |
| SubSector: Processed & Packaged Goods | |
| MarketCap: 18522.8 Millions | |
| Recent Price: 75.85 Smart Investing & Trading Score: 88 | |
| Day Percent Change: 1.11% Day Change: 0.83 | |
| Week Change: 2.61% Year-to-date Change: 10.9% | |
| MKC Links: Profile News Message Board | |
| Charts:- Daily , Weekly | |
| Add MKC to Watchlist: View: Get MKC Trend Analysis ➞ | |
 | PEG Public Service Enterprise Group Incorporated |
| Sector: Utilities | |
| SubSector: Diversified Utilities | |
| MarketCap: 20886 Millions | |
| Recent Price: 67.23 Smart Investing & Trading Score: 95 | |
| Day Percent Change: 1.11% Day Change: 0.74 | |
| Week Change: 2.27% Year-to-date Change: 9.9% | |
| PEG Links: Profile News Message Board | |
| Charts:- Daily , Weekly | |
| Add PEG to Watchlist: View: Get PEG Trend Analysis ➞ | |
 | D Dominion Energy, Inc. |
| Sector: Utilities | |
| SubSector: Electric Utilities | |
| MarketCap: 62365.3 Millions | |
| Recent Price: 51.23 Smart Investing & Trading Score: 100 | |
| Day Percent Change: 1.11% Day Change: 0.56 | |
| Week Change: 2.79% Year-to-date Change: 9.0% | |
| D Links: Profile News Message Board | |
| Charts:- Daily , Weekly | |
| Add D to Watchlist: View: Get D Trend Analysis ➞ | |
 | K Kellogg Company |
| Sector: Consumer Staples | |
| SubSector: Processed & Packaged Goods | |
| MarketCap: 20264.6 Millions | |
| Recent Price: 58.75 Smart Investing & Trading Score: 100 | |
| Day Percent Change: 1.05% Day Change: 0.61 | |
| Week Change: 2.39% Year-to-date Change: 5.1% | |
| K Links: Profile News Message Board | |
| Charts:- Daily , Weekly | |
| Add K to Watchlist: View: Get K Trend Analysis ➞ | |
 | IBM International Business Machines Corporation |
| Sector: Technology | |
| SubSector: Information Technology Services | |
| MarketCap: 97241.6 Millions | |
| Recent Price: 184.10 Smart Investing & Trading Score: 45 | |
| Day Percent Change: 1.05% Day Change: 1.91 | |
| Week Change: 1.39% Year-to-date Change: 12.6% | |
| IBM Links: Profile News Message Board | |
| Charts:- Daily , Weekly | |
| Add IBM to Watchlist: View: Get IBM Trend Analysis ➞ | |
 | EXR Extra Space Storage Inc. |
| Sector: Financials | |
| SubSector: REIT - Industrial | |
| MarketCap: 11203.9 Millions | |
| Recent Price: 134.64 Smart Investing & Trading Score: 35 | |
| Day Percent Change: 1.02% Day Change: 1.36 | |
| Week Change: 1.65% Year-to-date Change: -16.0% | |
| EXR Links: Profile News Message Board | |
| Charts:- Daily , Weekly | |
| Add EXR to Watchlist: View: Get EXR Trend Analysis ➞ | |
 | ZION Zions Bancorporation, National Association |
| Sector: Financials | |
| SubSector: Regional - Pacific Banks | |
| MarketCap: 4577.89 Millions | |
| Recent Price: 42.17 Smart Investing & Trading Score: 80 | |
| Day Percent Change: 1.01% Day Change: 0.42 | |
| Week Change: 5.64% Year-to-date Change: -3.9% | |
| ZION Links: Profile News Message Board | |
| Charts:- Daily , Weekly | |
| Add ZION to Watchlist: View: Get ZION Trend Analysis ➞ | |
 | SBUX Starbucks Corporation |
| Sector: Services & Goods | |
| SubSector: Specialty Eateries | |
| MarketCap: 74909.7 Millions | |
| Recent Price: 88.75 Smart Investing & Trading Score: 64 | |
| Day Percent Change: 1.00% Day Change: 0.88 | |
| Week Change: 1.3% Year-to-date Change: -7.6% | |
| SBUX Links: Profile News Message Board | |
| Charts:- Daily , Weekly | |
| Add SBUX to Watchlist: View: Get SBUX Trend Analysis ➞ | |
 | FTNT Fortinet, Inc. |
| Sector: Technology | |
| SubSector: Application Software | |
| MarketCap: 16993.8 Millions | |
| Recent Price: 65.45 Smart Investing & Trading Score: 68 | |
| Day Percent Change: 1.00% Day Change: 0.65 | |
| Week Change: 3.23% Year-to-date Change: 11.8% | |
| FTNT Links: Profile News Message Board | |
| Charts:- Daily , Weekly | |
| Add FTNT to Watchlist: View: Get FTNT Trend Analysis ➞ | |
 | EW Edwards Lifesciences Corporation |
| Sector: Health Care | |
| SubSector: Medical Appliances & Equipment | |
| MarketCap: 36735.5 Millions | |
| Recent Price: 88.61 Smart Investing & Trading Score: 68 | |
| Day Percent Change: 0.98% Day Change: 0.86 | |
| Week Change: 3.11% Year-to-date Change: 16.2% | |
| EW Links: Profile News Message Board | |
| Charts:- Daily , Weekly | |
| Add EW to Watchlist: View: Get EW Trend Analysis ➞ | |
 | CAG Conagra Brands, Inc. |
| Sector: Consumer Staples | |
| SubSector: Processed & Packaged Goods | |
| MarketCap: 14084.1 Millions | |
| Recent Price: 31.57 Smart Investing & Trading Score: 100 | |
| Day Percent Change: 0.96% Day Change: 0.30 | |
| Week Change: 3.1% Year-to-date Change: 10.2% | |
| CAG Links: Profile News Message Board | |
| Charts:- Daily , Weekly | |
| Add CAG to Watchlist: View: Get CAG Trend Analysis ➞ | |
 | LW Lamb Weston Holdings, Inc. |
| Sector: Consumer Staples | |
| SubSector: Food - Major Diversified | |
| MarketCap: 7844.63 Millions | |
| Recent Price: 84.52 Smart Investing & Trading Score: 64 | |
| Day Percent Change: 0.96% Day Change: 0.80 | |
| Week Change: 4.35% Year-to-date Change: -21.8% | |
| LW Links: Profile News Message Board | |
| Charts:- Daily , Weekly | |
| Add LW to Watchlist: View: Get LW Trend Analysis ➞ | |
 | HBAN Huntington Bancshares Incorporated |
| Sector: Financials | |
| SubSector: Regional - Midwest Banks | |
| MarketCap: 8468.1 Millions | |
| Recent Price: 13.76 Smart Investing & Trading Score: 100 | |
| Day Percent Change: 0.95% Day Change: 0.13 | |
| Week Change: 3.61% Year-to-date Change: 8.2% | |
| HBAN Links: Profile News Message Board | |
| Charts:- Daily , Weekly | |
| Add HBAN to Watchlist: View: Get HBAN Trend Analysis ➞ | |
 | AEP American Electric Power Company, Inc. |
| Sector: Utilities | |
| SubSector: Electric Utilities | |
| MarketCap: 38380 Millions | |
| Recent Price: 86.37 Smart Investing & Trading Score: 100 | |
| Day Percent Change: 0.95% Day Change: 0.81 | |
| Week Change: 2.58% Year-to-date Change: 6.3% | |
| AEP Links: Profile News Message Board | |
| Charts:- Daily , Weekly | |
| Add AEP to Watchlist: View: Get AEP Trend Analysis ➞ | |
 | AZO AutoZone, Inc. |
| Sector: Services & Goods | |
| SubSector: Auto Parts Stores | |
| MarketCap: 19128 Millions | |
| Recent Price: 2988.51 Smart Investing & Trading Score: 51 | |
| Day Percent Change: 0.93% Day Change: 27.47 | |
| Week Change: 0.1% Year-to-date Change: 15.6% | |
| AZO Links: Profile News Message Board | |
| Charts:- Daily , Weekly | |
| Add AZO to Watchlist: View: Get AZO Trend Analysis ➞ | |
 | KR The Kroger Co. |
| Sector: Services & Goods | |
| SubSector: Grocery Stores | |
| MarketCap: 26718.5 Millions | |
| Recent Price: 56.15 Smart Investing & Trading Score: 61 | |
| Day Percent Change: 0.93% Day Change: 0.52 | |
| Week Change: -0.74% Year-to-date Change: 22.8% | |
| KR Links: Profile News Message Board | |
| Charts:- Daily , Weekly | |
| Add KR to Watchlist: View: Get KR Trend Analysis ➞ | |
 | BWA BorgWarner Inc. |
| Sector: Consumer Staples | |
| SubSector: Auto Parts | |
| MarketCap: 4604.09 Millions | |
| Recent Price: 33.65 Smart Investing & Trading Score: 47 | |
| Day Percent Change: 0.93% Day Change: 0.31 | |
| Week Change: 2.59% Year-to-date Change: -6.1% | |
| BWA Links: Profile News Message Board | |
| Charts:- Daily , Weekly | |
| Add BWA to Watchlist: View: Get BWA Trend Analysis ➞ | |
 | ALB Albemarle Corporation |
| Sector: Materials | |
| SubSector: Specialty Chemicals | |
| MarketCap: 6139.27 Millions | |
| Recent Price: 115.27 Smart Investing & Trading Score: 55 | |
| Day Percent Change: 0.93% Day Change: 1.06 | |
| Week Change: 2.78% Year-to-date Change: -20.2% | |
| ALB Links: Profile News Message Board | |
| Charts:- Daily , Weekly | |
| Add ALB to Watchlist: View: Get ALB Trend Analysis ➞ | |
 | AEE Ameren Corporation |
| Sector: Utilities | |
| SubSector: Electric Utilities | |
| MarketCap: 17308.2 Millions | |
| Recent Price: 74.71 Smart Investing & Trading Score: 93 | |
| Day Percent Change: 0.93% Day Change: 0.69 | |
| Week Change: 1.12% Year-to-date Change: 3.3% | |
| AEE Links: Profile News Message Board | |
| Charts:- Daily , Weekly | |
| Add AEE to Watchlist: View: Get AEE Trend Analysis ➞ | |
 | IQV IQVIA Holdings Inc. |
| Sector: Health Care | |
| SubSector: Medical Laboratories & Research | |
| MarketCap: 19616.5 Millions | |
| Recent Price: 240.84 Smart Investing & Trading Score: 60 | |
| Day Percent Change: 0.93% Day Change: 2.22 | |
| Week Change: 5.59% Year-to-date Change: 4.1% | |
| IQV Links: Profile News Message Board | |
| Charts:- Daily , Weekly | |
| Add IQV to Watchlist: View: Get IQV Trend Analysis ➞ | |
 | NI NiSource Inc. |
| Sector: Utilities | |
| SubSector: Diversified Utilities | |
| MarketCap: 9056.8 Millions | |
| Recent Price: 28.18 Smart Investing & Trading Score: 100 | |
| Day Percent Change: 0.90% Day Change: 0.25 | |
| Week Change: 2.18% Year-to-date Change: 6.1% | |
| NI Links: Profile News Message Board | |
| Charts:- Daily , Weekly | |
| Add NI to Watchlist: View: Get NI Trend Analysis ➞ | |
 | SO The Southern Company |
| Sector: Utilities | |
| SubSector: Electric Utilities | |
| MarketCap: 54483.6 Millions | |
| Recent Price: 73.91 Smart Investing & Trading Score: 100 | |
| Day Percent Change: 0.90% Day Change: 0.66 | |
| Week Change: 2.44% Year-to-date Change: 5.4% | |
| SO Links: Profile News Message Board | |
| Charts:- Daily , Weekly | |
| Add SO to Watchlist: View: Get SO Trend Analysis ➞ | |
 | CF CF Industries Holdings, Inc. |
| Sector: Materials | |
| SubSector: Agricultural Chemicals | |
| MarketCap: 5581.89 Millions | |
| Recent Price: 79.25 Smart Investing & Trading Score: 54 | |
| Day Percent Change: 0.90% Day Change: 0.71 | |
| Week Change: -0.28% Year-to-date Change: -0.3% | |
| CF Links: Profile News Message Board | |
| Charts:- Daily , Weekly | |
| Add CF to Watchlist: View: Get CF Trend Analysis ➞ | |
 | BK The Bank of New York Mellon Corporation |
| Sector: Financials | |
| SubSector: Asset Management | |
| MarketCap: 29807.5 Millions | |
| Recent Price: 57.95 Smart Investing & Trading Score: 100 | |
| Day Percent Change: 0.89% Day Change: 0.51 | |
| Week Change: 2.95% Year-to-date Change: 11.3% | |
| BK Links: Profile News Message Board | |
| Charts:- Daily , Weekly | |
| Add BK to Watchlist: View: Get BK Trend Analysis ➞ | |
| For tabular summary view of above stock list: Summary View ➞ 0 - 25 , 25 - 50 , 50 - 75 , 75 - 100 , 100 - 125 , 125 - 150 , 150 - 175 , 175 - 200 , 200 - 225 , 225 - 250 , 250 - 275 , 275 - 300 , 300 - 325 , 325 - 350 , 350 - 375 , 375 - 400 , 400 - 425 , 425 - 450 , 450 - 475 , 475 - 500 | ||
| Click To Change The Sort Order: By Market Cap or Company Size Performance: Year-to-date, Week and Day | |
| Select Chart Type: | ||
|
Best Stocks Today 12Stocks.com |
© 2024 12Stocks.com Terms & Conditions Privacy Contact Us
All Information Provided Only For Education And Not To Be Used For Investing or Trading. See Terms & Conditions


One More Thing ... Get Best Stocks Delivered Daily!
Never Ever Miss A Move With Our Top Ten Stocks Lists
Find Best Stocks In Any Market - Bull or Bear Market
Take A Peek At Our Top Ten Stocks Lists: Daily, Weekly, Year-to-Date & Top Trends
Find Best Stocks In Any Market - Bull or Bear Market
Take A Peek At Our Top Ten Stocks Lists: Daily, Weekly, Year-to-Date & Top Trends
S&P 500 Stocks With Best Up Trends [0-bearish to 100-bullish]: Hasbro [100], Wabtec [100], Boston Scientific[100], Texas Instruments[100], Microchip [100], Synchrony Financial[100], EQT [100], PepsiCo [100], Analog Devices[100], Equity Residential[100], Essex Property[100]
Best S&P 500 Stocks Year-to-Date:
NVIDIA [60.89%], Constellation [59.4%], NRG [40.44%], Meta Platforms[39.4%], Targa Resources[34.57%], Marathon [34.23%], Progressive [33.22%], Western Digital[32.81%], Eaton [32.38%], Diamondback [32.34%], Micron [30.98%] Best S&P 500 Stocks This Week:
Globe Life[17.77%], Hasbro [17.66%], Wabtec [13.32%], Microchip [11.02%], Tesla [10.26%], Texas Instruments[9.48%], NXP Semiconductors[9.26%], CoStar [9.13%], Kimberly-Clark [8.63%], Monolithic Power[8.57%], Synchrony Financial[8.3%] Best S&P 500 Stocks Daily:
Tesla [12.06%], Hasbro [11.85%], Wabtec [10.04%], CoStar [8.66%], ON Semiconductor[6.24%], Boston Scientific[5.68%], Texas Instruments[5.64%], Microchip [5.21%], Monolithic Power[5.04%], Synchrony Financial[5.04%], Biogen [4.56%]