
 Login Sign Up


| |||||
 |  | ||||

| 12Stocks.com Market Intelligence |
Best S&P 500 Stocks
|
On this page, you will find the most comprehensive analysis of S&P 500 stocks and ETFs - from latest trends to performances to charts ➞. First, here are the year-to-date (YTD) performances of the most requested S&P 500 stocks at 12Stocks.com (click stock for review):
| NVIDIA 57% | ||
| Caterpillar 19% | ||
| Merck 15% | ||
| Amazon.com 14% | ||
| Walmart 13% | ||
| Google 10% | ||
| JPMorgan Chase 9% | ||
| Chevron 7% | ||
| Microsoft 6% | ||
| Goldman Sachs 5% | ||
| Johnson & Johnson -6% | ||
| McDonald s -8% | ||
| Starbucks -9% | ||
| Apple -14% | ||
| Gilead -18% | ||
| Intel -32% | ||
| Boeing -35% | ||
| Quick: S&P 500 Stocks Lists: Performances & Trends, S&P 500 Stock Charts
Sort S&P 500 stocks: Daily, Weekly, Year-to-Date, Market Cap & Trends. Filter S&P 500 stocks list by sector: Show all, Tech, Finance, Energy, Staples, Retail, Industrial, Materials, Utilities and HealthCare |
| 12Stocks.com S&P 500 Stocks Performances & Trends Daily Report | |||||||||
|
| 
The overall Smart Investing & Trading Score is 36 (0-bearish to 100-bullish) which puts S&P 500 index in short term bearish to neutral trend. The Smart Investing & Trading Score from previous trading session is 26 and an improvement of trend continues. | ||||||||
Here are the Smart Investing & Trading Scores of the most requested S&P 500 stocks at 12Stocks.com (click stock name for detailed review):
|


| 12Stocks.com: Top Performing S&P 500 Index Stocks | ||||||||||||||||||||||||||||||||||||||||||||||||
 The top performing S&P 500 Index stocks year to date are
Now, more recently, over last week, the top performing S&P 500 Index stocks on the move are


|
||||||||||||||||||||||||||||||||||||||||||||||||
| 12Stocks.com: Investing in S&P 500 Index with Stocks | |
|
The following table helps investors and traders sort through current performance and trends (as measured by Smart Investing & Trading Score) of various
stocks in the S&P 500 Index. Quick View: Move mouse or cursor over stock symbol (ticker) to view short-term technical chart and over stock name to view long term chart. Click on  to add stock symbol to your watchlist and to add stock symbol to your watchlist and  to view watchlist. Click on any ticker or stock name for detailed market intelligence report for that stock. to view watchlist. Click on any ticker or stock name for detailed market intelligence report for that stock. |
12Stocks.com Performance of Stocks in S&P 500 Index
| Ticker | Stock Name | Watchlist | Category | Recent Price | Smart Investing & Trading Score | Change % | YTD Change% |
| EFX | Equifax |   | Financials | 214.94 | 0 | -1.18 | -13.08% |
| FFIV | F5 Networks | | Technology | 177.47 | 0 | -1.18 | -0.84% |
| SHW | Sherwin-Williams | | Materials | 305.61 | 51 | -1.22 | -2.02% |
| PHM | Pulte | | Industrials | 104.65 | 44 | -1.24 | 1.39% |
| MSFT | Microsoft | | Technology | 399.24 | 26 | -1.24 | 6.17% |
| KEYS | Keysight Technologies | | Technology | 145.00 | 10 | -1.29 | -8.86% |
| URI | United Rentals | | Transports | 624.68 | 23 | -1.30 | 8.94% |
| AAPL | Apple | | Technology | 164.87 | 0 | -1.30 | -14.37% |
| GEHC | GE HealthCare | | Health Care | 84.38 | 41 | -1.30 | 9.10% |
| VMC | Vulcan Materials | | Industrials | 251.69 | 36 | -1.33 | 10.87% |
| EXR | Extra Space | | Financials | 132.42 | 20 | -1.33 | -17.41% |
| FTNT | Fortinet | | Technology | 63.15 | 41 | -1.37 | 7.89% |
| CPRT | Copart | | Services & Goods | 52.47 | 36 | -1.38 | 7.07% |
| HUBB | Hubbell | | Technology | 386.86 | 41 | -1.38 | 17.61% |
| INCY | Incyte | | Health Care | 52.06 | 10 | -1.44 | -17.09% |
| PANW | Palo Alto | | Technology | 277.03 | 50 | -1.46 | -6.05% |
| CAT | Caterpillar | | Industrials | 352.68 | 54 | -1.47 | 19.28% |
| ETN | Eaton | | Industrials | 304.35 | 46 | -1.49 | 26.38% |
| IR | Ingersoll Rand | | Industrials | 87.63 | 36 | -1.51 | 13.30% |
| GOOG | | Technology | 155.09 | 83 | -1.51 | 10.04% | |
| ALGN | Align | | Health Care | 296.77 | 53 | -1.51 | 8.31% |
| ORLY | O Reilly | | Services & Goods | 1084.17 | 44 | -1.53 | 14.11% |
| HPE | Hewlett Packard | | Technology | 16.78 | 61 | -1.53 | -1.18% |
| AXON | Axovant | | Health Care | 293.01 | 26 | -1.54 | 13.42% |
| NRG | NRG | | Utilities | 69.42 | 51 | -1.57 | 34.26% |
| For chart view version of above stock list: Chart View ➞ 0 - 25 , 25 - 50 , 50 - 75 , 75 - 100 , 100 - 125 , 125 - 150 , 150 - 175 , 175 - 200 , 200 - 225 , 225 - 250 , 250 - 275 , 275 - 300 , 300 - 325 , 325 - 350 , 350 - 375 , 375 - 400 , 400 - 425 , 425 - 450 , 450 - 475 , 475 - 500 | ||
 | Click To Change The Sort Order: By Market Cap or Company Size Performance: Year-to-date, Week and Day |  |
|
Get the most comprehensive stock market coverage daily at 12Stocks.com ➞ Best Stocks Today ➞ Best Stocks Weekly ➞ Best Stocks Year-to-Date ➞ Best Stocks Trends ➞  Best Stocks Today 12Stocks.com Best Nasdaq Stocks ➞ Best S&P 500 Stocks ➞ Best Tech Stocks ➞ Best Biotech Stocks ➞ |
| Detailed Overview of S&P 500 Stocks |
| S&P 500 Technical Overview, Leaders & Laggards, Top S&P 500 ETF Funds & Detailed S&P 500 Stocks List, Charts, Trends & More |
| S&P 500: Technical Analysis, Trends & YTD Performance | |
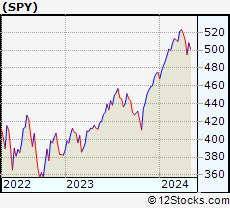
| S&P 500 index as represented by
SPY, an exchange-traded fund [ETF], holds basket of five hundred (mostly largecap) stocks from across all major sectors of the US stock market. The S&P 500 index (contains stocks like Apple and Exxon) is up by 4.06% and is currently outperforming the overall market by 0.91% year-to-date. Below is a quick view of technical charts and trends: | |
 SPY Weekly Chart |
|
| Long Term Trend: Good | |
| Medium Term Trend: Not Good | |
 SPY Daily Chart |
|
| Short Term Trend: Deteriorating | |
| Overall Trend Score: 36 | |
| YTD Performance: 4.06% | |
| **Trend Scores & Views Are Only For Educational Purposes And Not For Investing | |
| 12Stocks.com: Investing in S&P 500 Index using Exchange Traded Funds | |
|
The following table shows list of key exchange traded funds (ETF) that
help investors track S&P 500 index. The following list also includes leveraged ETF funds that track twice or thrice the daily returns of S&P 500 indices. Short or inverse ETF funds move in the opposite direction to the index they track and are useful during market pullbacks or during bear markets. Quick View: Move mouse or cursor over ETF symbol (ticker) to view short-term technical chart and over ETF name to view long term chart. Click on ticker or stock name for detailed view. Click on to add stock symbol to your watchlist and to view watchlist. |
12Stocks.com List of ETFs that track S&P 500 Index
| Ticker | ETF Name | Watchlist | Recent Price | Smart Investing & Trading Score | Change % | Week % | Year-to-date % |
| SPY | SPDR S&P 500 ETF | | 494.62 | 36 | -0.98 | -3.18 | 4.06% |
| IVV | iShares Core S&P 500 ETF | | 496.60 | 36 | -1.05 | -3.26 | 3.97% |
| VOO | Vanguard 500 ETF | | 454.18 | 36 | -1.04 | -3.28 | 3.98% |
| OEF | iShares S&P 100 | | 234.37 | 36 | -1.37 | -3.61 | 4.92% |
| SSO | ProShares Ultra S&P500 | | 68.82 | 36 | -2.15 | -6.57 | 5.76% |
| UPRO | ProShares UltraPro S&P500 | | 58.91 | 36 | -3.08 | -9.65 | 7.62% |
| SPXL | Direxion Daily S&P500 Bull 3X ETF | | 111.64 | 36 | -3.37 | -9.85 | 7.36% |
| SH | ProShares Short S&P500 | | 12.61 | 69 | 1.12 | 3.45 | -2.93% |
| SDS | ProShares UltraShort S&P500 | | 27.97 | 69 | 2.04 | 6.88 | -6.52% |
| SPXU | ProShares UltraPro Short S&P500 | | 38.22 | 64 | 2.38 | 9.64 | -11.12% |
| SPXS | Direxion Daily S&P 500 Bear 3X ETF | | 10.44 | 42 | 3.21 | 10.77 | -9.65% |
| 12Stocks.com: Charts, Trends, Fundamental Data and Performances of S&P 500 Stocks | |
|
We now take in-depth look at all S&P 500 stocks including charts, multi-period performances and overall trends (as measured by Smart Investing & Trading Score). One can sort S&P 500 stocks (click link to choose) by Daily, Weekly and by Year-to-Date performances. Also, one can sort by size of the company or by market capitalization. |
| Select Your Default Chart Type: | |||||
| |||||
| Click on stock symbol or name for detailed view. Click on to add stock symbol to your watchlist and to view watchlist. Quick View: Move mouse or cursor over "Daily" to quickly view daily technical stock chart and over "Weekly" to view weekly technical stock chart. | |||||

 | EFX Equifax Inc. |
| Sector: Financials | |
| SubSector: Credit Services | |
| MarketCap: 13754.6 Millions | |
| Recent Price: 214.94 Smart Investing & Trading Score: 0 | |
| Day Percent Change: -1.18% Day Change: -2.57 | |
| Week Change: -12.98% Year-to-date Change: -13.1% | |
| EFX Links: Profile News Message Board | |
| Charts:- Daily , Weekly | |
| Add EFX to Watchlist: View: Get EFX Trend Analysis ➞ | |
 | FFIV F5 Networks, Inc. |
| Sector: Technology | |
| SubSector: Business Software & Services | |
| MarketCap: 6675.38 Millions | |
| Recent Price: 177.47 Smart Investing & Trading Score: 0 | |
| Day Percent Change: -1.18% Day Change: -2.12 | |
| Week Change: -7.61% Year-to-date Change: -0.8% | |
| FFIV Links: Profile News Message Board | |
| Charts:- Daily , Weekly | |
| Add FFIV to Watchlist: View: Get FFIV Trend Analysis ➞ | |
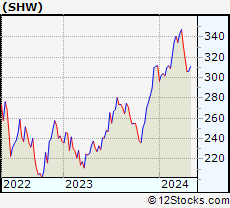 | SHW The Sherwin-Williams Company |
| Sector: Materials | |
| SubSector: Specialty Chemicals | |
| MarketCap: 40832.5 Millions | |
| Recent Price: 305.61 Smart Investing & Trading Score: 51 | |
| Day Percent Change: -1.22% Day Change: -3.77 | |
| Week Change: -3.97% Year-to-date Change: -2.0% | |
| SHW Links: Profile News Message Board | |
| Charts:- Daily , Weekly | |
| Add SHW to Watchlist: View: Get SHW Trend Analysis ➞ | |
 | PHM PulteGroup, Inc. |
| Sector: Industrials | |
| SubSector: Residential Construction | |
| MarketCap: 6186.46 Millions | |
| Recent Price: 104.65 Smart Investing & Trading Score: 44 | |
| Day Percent Change: -1.24% Day Change: -1.31 | |
| Week Change: -5.63% Year-to-date Change: 1.4% | |
| PHM Links: Profile News Message Board | |
| Charts:- Daily , Weekly | |
| Add PHM to Watchlist: View: Get PHM Trend Analysis ➞ | |
 | MSFT Microsoft Corporation |
| Sector: Technology | |
| SubSector: Business Software & Services | |
| MarketCap: 1154150 Millions | |
| Recent Price: 399.24 Smart Investing & Trading Score: 26 | |
| Day Percent Change: -1.24% Day Change: -5.03 | |
| Week Change: -5.37% Year-to-date Change: 6.2% | |
| MSFT Links: Profile News Message Board | |
| Charts:- Daily , Weekly | |
| Add MSFT to Watchlist: View: Get MSFT Trend Analysis ➞ | |
 | KEYS Keysight Technologies, Inc. |
| Sector: Technology | |
| SubSector: Scientific & Technical Instruments | |
| MarketCap: 17355.1 Millions | |
| Recent Price: 145.00 Smart Investing & Trading Score: 10 | |
| Day Percent Change: -1.29% Day Change: -1.89 | |
| Week Change: -6.51% Year-to-date Change: -8.9% | |
| KEYS Links: Profile News Message Board | |
| Charts:- Daily , Weekly | |
| Add KEYS to Watchlist: View: Get KEYS Trend Analysis ➞ | |
 | URI United Rentals, Inc. |
| Sector: Transports | |
| SubSector: Rental & Leasing Services | |
| MarketCap: 6246.64 Millions | |
| Recent Price: 624.68 Smart Investing & Trading Score: 23 | |
| Day Percent Change: -1.30% Day Change: -8.20 | |
| Week Change: -7.43% Year-to-date Change: 8.9% | |
| URI Links: Profile News Message Board | |
| Charts:- Daily , Weekly | |
| Add URI to Watchlist: View: Get URI Trend Analysis ➞ | |
 | AAPL Apple Inc. |
| Sector: Technology | |
| SubSector: Electronic Equipment | |
| MarketCap: 1112940 Millions | |
| Recent Price: 164.87 Smart Investing & Trading Score: 0 | |
| Day Percent Change: -1.30% Day Change: -2.17 | |
| Week Change: -6.62% Year-to-date Change: -14.4% | |
| AAPL Links: Profile News Message Board | |
| Charts:- Daily , Weekly | |
| Add AAPL to Watchlist: View: Get AAPL Trend Analysis ➞ | |
 | GEHC GE HealthCare Technologies Inc. |
| Sector: Health Care | |
| SubSector: Health Information Services | |
| MarketCap: 36240 Millions | |
| Recent Price: 84.38 Smart Investing & Trading Score: 41 | |
| Day Percent Change: -1.30% Day Change: -1.12 | |
| Week Change: -4.34% Year-to-date Change: 9.1% | |
| GEHC Links: Profile News Message Board | |
| Charts:- Daily , Weekly | |
| Add GEHC to Watchlist: View: Get GEHC Trend Analysis ➞ | |
 | VMC Vulcan Materials Company |
| Sector: Industrials | |
| SubSector: General Building Materials | |
| MarketCap: 12304.7 Millions | |
| Recent Price: 251.69 Smart Investing & Trading Score: 36 | |
| Day Percent Change: -1.33% Day Change: -3.38 | |
| Week Change: -4.22% Year-to-date Change: 10.9% | |
| VMC Links: Profile News Message Board | |
| Charts:- Daily , Weekly | |
| Add VMC to Watchlist: View: Get VMC Trend Analysis ➞ | |
 | EXR Extra Space Storage Inc. |
| Sector: Financials | |
| SubSector: REIT - Industrial | |
| MarketCap: 11203.9 Millions | |
| Recent Price: 132.42 Smart Investing & Trading Score: 20 | |
| Day Percent Change: -1.33% Day Change: -1.78 | |
| Week Change: -5.88% Year-to-date Change: -17.4% | |
| EXR Links: Profile News Message Board | |
| Charts:- Daily , Weekly | |
| Add EXR to Watchlist: View: Get EXR Trend Analysis ➞ | |
 | FTNT Fortinet, Inc. |
| Sector: Technology | |
| SubSector: Application Software | |
| MarketCap: 16993.8 Millions | |
| Recent Price: 63.15 Smart Investing & Trading Score: 41 | |
| Day Percent Change: -1.37% Day Change: -0.88 | |
| Week Change: -7.43% Year-to-date Change: 7.9% | |
| FTNT Links: Profile News Message Board | |
| Charts:- Daily , Weekly | |
| Add FTNT to Watchlist: View: Get FTNT Trend Analysis ➞ | |
 | CPRT Copart, Inc. |
| Sector: Services & Goods | |
| SubSector: Auto Dealerships | |
| MarketCap: 15462.1 Millions | |
| Recent Price: 52.47 Smart Investing & Trading Score: 36 | |
| Day Percent Change: -1.38% Day Change: -0.73 | |
| Week Change: -5.26% Year-to-date Change: 7.1% | |
| CPRT Links: Profile News Message Board | |
| Charts:- Daily , Weekly | |
| Add CPRT to Watchlist: View: Get CPRT Trend Analysis ➞ | |
 | HUBB Hubbell Incorporated |
| Sector: Technology | |
| SubSector: Diversified Electronics | |
| MarketCap: 6002.46 Millions | |
| Recent Price: 386.86 Smart Investing & Trading Score: 41 | |
| Day Percent Change: -1.38% Day Change: -5.42 | |
| Week Change: -3.7% Year-to-date Change: 17.6% | |
| HUBB Links: Profile News Message Board | |
| Charts:- Daily , Weekly | |
| Add HUBB to Watchlist: View: Get HUBB Trend Analysis ➞ | |
 | INCY Incyte Corporation |
| Sector: Health Care | |
| SubSector: Biotechnology | |
| MarketCap: 15343.2 Millions | |
| Recent Price: 52.06 Smart Investing & Trading Score: 10 | |
| Day Percent Change: -1.44% Day Change: -0.76 | |
| Week Change: -3.32% Year-to-date Change: -17.1% | |
| INCY Links: Profile News Message Board | |
| Charts:- Daily , Weekly | |
| Add INCY to Watchlist: View: Get INCY Trend Analysis ➞ | |
 | PANW Palo Alto Networks, Inc. |
| Sector: Technology | |
| SubSector: Networking & Communication Devices | |
| MarketCap: 16039.4 Millions | |
| Recent Price: 277.03 Smart Investing & Trading Score: 50 | |
| Day Percent Change: -1.46% Day Change: -4.11 | |
| Week Change: -0.73% Year-to-date Change: -6.1% | |
| PANW Links: Profile News Message Board | |
| Charts:- Daily , Weekly | |
| Add PANW to Watchlist: View: Get PANW Trend Analysis ➞ | |
 | CAT Caterpillar Inc. |
| Sector: Industrials | |
| SubSector: Farm & Construction Machinery | |
| MarketCap: 58636 Millions | |
| Recent Price: 352.68 Smart Investing & Trading Score: 54 | |
| Day Percent Change: -1.47% Day Change: -5.25 | |
| Week Change: -3.54% Year-to-date Change: 19.3% | |
| CAT Links: Profile News Message Board | |
| Charts:- Daily , Weekly | |
| Add CAT to Watchlist: View: Get CAT Trend Analysis ➞ | |
 | ETN Eaton Corporation plc |
| Sector: Industrials | |
| SubSector: Diversified Machinery | |
| MarketCap: 29829.4 Millions | |
| Recent Price: 304.35 Smart Investing & Trading Score: 46 | |
| Day Percent Change: -1.49% Day Change: -4.59 | |
| Week Change: -4.44% Year-to-date Change: 26.4% | |
| ETN Links: Profile News Message Board | |
| Charts:- Daily , Weekly | |
| Add ETN to Watchlist: View: Get ETN Trend Analysis ➞ | |
 | IR Ingersoll Rand Inc. |
| Sector: Industrials | |
| SubSector: Diversified Machinery | |
| MarketCap: 8970.56 Millions | |
| Recent Price: 87.63 Smart Investing & Trading Score: 36 | |
| Day Percent Change: -1.51% Day Change: -1.34 | |
| Week Change: -4.67% Year-to-date Change: 13.3% | |
| IR Links: Profile News Message Board | |
| Charts:- Daily , Weekly | |
| Add IR to Watchlist: View: Get IR Trend Analysis ➞ | |
 | GOOG Alphabet Inc. |
| Sector: Technology | |
| SubSector: Internet Information Providers | |
| MarketCap: 730159 Millions | |
| Recent Price: 155.09 Smart Investing & Trading Score: 83 | |
| Day Percent Change: -1.51% Day Change: -2.38 | |
| Week Change: -2.58% Year-to-date Change: 10.0% | |
| GOOG Links: Profile News Message Board | |
| Charts:- Daily , Weekly | |
| Add GOOG to Watchlist: View: Get GOOG Trend Analysis ➞ | |
 | ALGN Align Technology, Inc. |
| Sector: Health Care | |
| SubSector: Medical Appliances & Equipment | |
| MarketCap: 12802 Millions | |
| Recent Price: 296.77 Smart Investing & Trading Score: 53 | |
| Day Percent Change: -1.51% Day Change: -4.56 | |
| Week Change: -5.78% Year-to-date Change: 8.3% | |
| ALGN Links: Profile News Message Board | |
| Charts:- Daily , Weekly | |
| Add ALGN to Watchlist: View: Get ALGN Trend Analysis ➞ | |
 | ORLY O Reilly Automotive, Inc. |
| Sector: Services & Goods | |
| SubSector: Auto Parts Stores | |
| MarketCap: 22391.5 Millions | |
| Recent Price: 1084.17 Smart Investing & Trading Score: 44 | |
| Day Percent Change: -1.53% Day Change: -16.89 | |
| Week Change: 0.71% Year-to-date Change: 14.1% | |
| ORLY Links: Profile News Message Board | |
| Charts:- Daily , Weekly | |
| Add ORLY to Watchlist: View: Get ORLY Trend Analysis ➞ | |
 | HPE Hewlett Packard Enterprise Company |
| Sector: Technology | |
| SubSector: Communication Equipment | |
| MarketCap: 12886.1 Millions | |
| Recent Price: 16.78 Smart Investing & Trading Score: 61 | |
| Day Percent Change: -1.53% Day Change: -0.26 | |
| Week Change: -3.67% Year-to-date Change: -1.2% | |
| HPE Links: Profile News Message Board | |
| Charts:- Daily , Weekly | |
| Add HPE to Watchlist: View: Get HPE Trend Analysis ➞ | |
 | AXON Axovant Sciences Ltd. |
| Sector: Health Care | |
| SubSector: Biotechnology | |
| MarketCap: 1492.04 Millions | |
| Recent Price: 293.01 Smart Investing & Trading Score: 26 | |
| Day Percent Change: -1.54% Day Change: -4.58 | |
| Week Change: -5.73% Year-to-date Change: 13.4% | |
| AXON Links: Profile News Message Board | |
| Charts:- Daily , Weekly | |
| Add AXON to Watchlist: View: Get AXON Trend Analysis ➞ | |
 | NRG NRG Energy, Inc. |
| Sector: Utilities | |
| SubSector: Diversified Utilities | |
| MarketCap: 6510.7 Millions | |
| Recent Price: 69.42 Smart Investing & Trading Score: 51 | |
| Day Percent Change: -1.57% Day Change: -1.10 | |
| Week Change: -6.11% Year-to-date Change: 34.3% | |
| NRG Links: Profile News Message Board | |
| Charts:- Daily , Weekly | |
| Add NRG to Watchlist: View: Get NRG Trend Analysis ➞ | |
| For tabular summary view of above stock list: Summary View ➞ 0 - 25 , 25 - 50 , 50 - 75 , 75 - 100 , 100 - 125 , 125 - 150 , 150 - 175 , 175 - 200 , 200 - 225 , 225 - 250 , 250 - 275 , 275 - 300 , 300 - 325 , 325 - 350 , 350 - 375 , 375 - 400 , 400 - 425 , 425 - 450 , 450 - 475 , 475 - 500 | ||
| Click To Change The Sort Order: By Market Cap or Company Size Performance: Year-to-date, Week and Day | |
| Select Chart Type: | ||
|
Best Stocks Today 12Stocks.com |
© 2024 12Stocks.com Terms & Conditions Privacy Contact Us
All Information Provided Only For Education And Not To Be Used For Investing or Trading. See Terms & Conditions


One More Thing ... Get Best Stocks Delivered Daily!
Never Ever Miss A Move With Our Top Ten Stocks Lists
Find Best Stocks In Any Market - Bull or Bear Market
Take A Peek At Our Top Ten Stocks Lists: Daily, Weekly, Year-to-Date & Top Trends
Find Best Stocks In Any Market - Bull or Bear Market
Take A Peek At Our Top Ten Stocks Lists: Daily, Weekly, Year-to-Date & Top Trends
S&P 500 Stocks With Best Up Trends [0-bearish to 100-bullish]: Bunge [100], Kinder Morgan[100], Wells Fargo[100], Lockheed Martin[100], Consolidated Edison[100], Conagra Brands[100], Genuine Parts[100], Charles Schwab[100], United Airlines[100], Dominion [95], Progressive [95]
Best S&P 500 Stocks Year-to-Date:
NVIDIA [56.71%], Constellation [52.26%], Meta Platforms[38.28%], Progressive [34.59%], NRG [34.26%], Marathon [31.63%], Targa Resources[29.75%], Diamondback [29.38%], Eaton [26.38%], Western Digital[25.66%], Valero [25.27%] Best S&P 500 Stocks This Week:
United Airlines[22.58%], UnitedHealth [13.96%], Genuine Parts[11.21%], Globe Life[10.86%], ProShares UltraPro[9.64%], American Airlines[7.11%], Southwest Airlines[6.79%], Wells Fargo[6.67%], General Mills[6.51%], Centene [6.15%], Bunge [6.1%] Best S&P 500 Stocks Daily:
Fifth Third[5.46%], American Express[5.14%], Bunge [3.38%], J. M.[3.24%], Bank of America[3.17%], Kinder Morgan[3.13%], Entergy [2.91%], Walgreens Boots[2.76%], Edison [2.72%], Aflac [2.70%], HCA Healthcare[2.59%]