
 Login Sign Up


| |||||
 |  | ||||

| 12Stocks.com Market Intelligence |
Best S&P 500 Stocks
|
On this page, you will find the most comprehensive analysis of S&P 500 stocks and ETFs - from latest trends to performances to charts ➞. First, here are the year-to-date (YTD) performances of the most requested S&P 500 stocks at 12Stocks.com (click stock for review):
| NVIDIA 83% | ||
| Amazon.com 24% | ||
| Google 23% | ||
| Merck 20% | ||
| Caterpillar 17% | ||
| Walmart 15% | ||
| Goldman Sachs 15% | ||
| JPMorgan Chase 13% | ||
| Chevron 9% | ||
| Microsoft 9% | ||
| Johnson & Johnson -5% | ||
| Apple -5% | ||
| McDonald s -10% | ||
| Gilead -19% | ||
| Starbucks -24% | ||
| Boeing -32% | ||
| Intel -39% | ||
| Quick: S&P 500 Stocks Lists: Performances & Trends, S&P 500 Stock Charts
Sort S&P 500 stocks: Daily, Weekly, Year-to-Date, Market Cap & Trends. Filter S&P 500 stocks list by sector: Show all, Tech, Finance, Energy, Staples, Retail, Industrial, Materials, Utilities and HealthCare |
| 12Stocks.com S&P 500 Stocks Performances & Trends Daily Report | |||||||||
|
| 
The overall Smart Investing & Trading Score is 95 (0-bearish to 100-bullish) which puts S&P 500 index in short term bullish trend. The Smart Investing & Trading Score from previous trading session is 60 and an improvement of trend continues. | ||||||||
Here are the Smart Investing & Trading Scores of the most requested S&P 500 stocks at 12Stocks.com (click stock name for detailed review):
|


| 12Stocks.com: Top Performing S&P 500 Index Stocks | ||||||||||||||||||||||||||||||||||||||||||||||||
 The top performing S&P 500 Index stocks year to date are
Now, more recently, over last week, the top performing S&P 500 Index stocks on the move are


|
||||||||||||||||||||||||||||||||||||||||||||||||
| 12Stocks.com: Investing in S&P 500 Index with Stocks | |
|
The following table helps investors and traders sort through current performance and trends (as measured by Smart Investing & Trading Score) of various
stocks in the S&P 500 Index. Quick View: Move mouse or cursor over stock symbol (ticker) to view short-term technical chart and over stock name to view long term chart. Click on  to add stock symbol to your watchlist and to add stock symbol to your watchlist and  to view watchlist. Click on any ticker or stock name for detailed market intelligence report for that stock. to view watchlist. Click on any ticker or stock name for detailed market intelligence report for that stock. |
12Stocks.com Performance of Stocks in S&P 500 Index
| Ticker | Stock Name | Watchlist | Category | Recent Price | Smart Investing & Trading Score | Change % | Weekly Change% |
| ANET | Arista Networks |   | Technology | 273.99 | 57 | -1.73% | -0.15% |
| ZBH | Zimmer Biomet | | Health Care | 121.43 | 47 | 0.72% | -0.19% |
| NWSA | News | | Services & Goods | 24.42 | 64 | -0.57% | -0.20% |
| TROW | T. Rowe | | Financials | 111.25 | 33 | -0.68% | -0.22% |
| HES | Hess | | Energy | 158.49 | 66 | -0.57% | -0.23% |
| AMT | American Tower | | Financials | 181.28 | 57 | 1.45% | -0.25% |
| RHI | Robert Half | | Services & Goods | 69.98 | 49 | -0.04% | -0.26% |
| ADSK | Autodesk | | Technology | 214.62 | 35 | -0.96% | -0.26% |
| CVS | CVS Health | | Health Care | 55.74 | 32 | -0.41% | -0.29% |
| LOW | Lowe s | | Services & Goods | 231.46 | 40 | -0.10% | -0.29% |
| DGX | Quest Diagnostics | | Health Care | 136.94 | 76 | 0.96% | -0.32% |
| LVS | Las Vegas | | Services & Goods | 46.72 | 57 | -0.64% | -0.32% |
| BEN | Franklin Resources | | Financials | 23.30 | 25 | -0.51% | -0.34% |
| MTD | Mettler-Toledo | | Health Care | 1247.74 | 58 | -0.24% | -0.34% |
| JNJ | Johnson & Johnson | | Health Care | 148.72 | 37 | 0.09% | -0.37% |
| RMD | ResMed | | Health Care | 216.16 | 68 | -0.36% | -0.38% |
| O | Realty Income | | Financials | 55.02 | 76 | -0.78% | -0.43% |
| FDX | FedEx | | Transports | 259.47 | 36 | -0.32% | -0.45% |
| NOW | ServiceNow | | Technology | 713.33 | 40 | -1.82% | -0.46% |
| GPN | Global Payments | | Services & Goods | 110.85 | 18 | -0.22% | -0.47% |
| ALGN | Align | | Health Care | 286.52 | 30 | -0.30% | -0.47% |
| CMCSA | Comcast | | Services & Goods | 38.49 | 35 | 0.00% | -0.52% |
| HAS | Hasbro | | Consumer Staples | 61.16 | 66 | 0.41% | -0.52% |
| AAPL | Apple | | Technology | 182.40 | 100 | 0.38% | -0.53% |
| WHR | Whirlpool | | Consumer Staples | 95.02 | 18 | -0.20% | -0.57% |
| For chart view version of above stock list: Chart View ➞ 0 - 25 , 25 - 50 , 50 - 75 , 75 - 100 , 100 - 125 , 125 - 150 , 150 - 175 , 175 - 200 , 200 - 225 , 225 - 250 , 250 - 275 , 275 - 300 , 300 - 325 , 325 - 350 , 350 - 375 , 375 - 400 , 400 - 425 , 425 - 450 , 450 - 475 , 475 - 500 | ||
 | Click To Change The Sort Order: By Market Cap or Company Size Performance: Year-to-date, Week and Day |  |
|
Get the most comprehensive stock market coverage daily at 12Stocks.com ➞ Best Stocks Today ➞ Best Stocks Weekly ➞ Best Stocks Year-to-Date ➞ Best Stocks Trends ➞  Best Stocks Today 12Stocks.com Best Nasdaq Stocks ➞ Best S&P 500 Stocks ➞ Best Tech Stocks ➞ Best Biotech Stocks ➞ |
| Detailed Overview of S&P 500 Stocks |
| S&P 500 Technical Overview, Leaders & Laggards, Top S&P 500 ETF Funds & Detailed S&P 500 Stocks List, Charts, Trends & More |
| S&P 500: Technical Analysis, Trends & YTD Performance | |
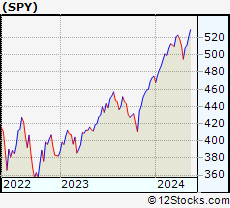
| S&P 500 index as represented by
SPY, an exchange-traded fund [ETF], holds basket of five hundred (mostly largecap) stocks from across all major sectors of the US stock market. The S&P 500 index (contains stocks like Apple and Exxon) is up by 8.8% and is currently outperforming the overall market by 0.68% year-to-date. Below is a quick view of technical charts and trends: | |
 SPY Weekly Chart |
|
| Long Term Trend: Good | |
| Medium Term Trend: Very Good | |
 SPY Daily Chart |
|
| Short Term Trend: Very Good | |
| Overall Trend Score: 95 | |
| YTD Performance: 8.8% | |
| **Trend Scores & Views Are Only For Educational Purposes And Not For Investing | |
| 12Stocks.com: Investing in S&P 500 Index using Exchange Traded Funds | |
|
The following table shows list of key exchange traded funds (ETF) that
help investors track S&P 500 index. The following list also includes leveraged ETF funds that track twice or thrice the daily returns of S&P 500 indices. Short or inverse ETF funds move in the opposite direction to the index they track and are useful during market pullbacks or during bear markets. Quick View: Move mouse or cursor over ETF symbol (ticker) to view short-term technical chart and over ETF name to view long term chart. Click on ticker or stock name for detailed view. Click on to add stock symbol to your watchlist and to view watchlist. |
12Stocks.com List of ETFs that track S&P 500 Index
| Ticker | ETF Name | Watchlist | Recent Price | Smart Investing & Trading Score | Change % | Week % | Year-to-date % |
| SPY | SPDR S&P 500 ETF | | 517.14 | 95 | 0.11 | 1.14 | 8.8% |
| IVV | iShares Core S&P 500 ETF | | 519.86 | 95 | 0.13 | 1.17 | 8.84% |
| VOO | Vanguard 500 ETF | | 475.40 | 95 | 0.14 | 1.15 | 8.84% |
| OEF | iShares S&P 100 | | 246.42 | 95 | 0.06 | 1.1 | 10.31% |
| SSO | ProShares Ultra S&P500 | | 75.10 | 95 | 0.20 | 2.23 | 15.41% |
| UPRO | ProShares UltraPro S&P500 | | 66.89 | 95 | 0.30 | 3.4 | 22.2% |
| SPXL | Direxion Daily S&P500 Bull 3X ETF | | 127.10 | 95 | 0.38 | 3.45 | 22.22% |
| SH | ProShares Short S&P500 | | 12.09 | 15 | -0.08 | -1.14 | -6.93% |
| SDS | ProShares UltraShort S&P500 | | 25.66 | 5 | -0.23 | -2.25 | -14.24% |
| SPXU | ProShares UltraPro Short S&P500 | | 33.73 | 0 | -0.30 | -3.32 | -21.56% |
| SPXS | Direxion Daily S&P 500 Bear 3X ETF | | 9.13 | 0 | -0.33 | -3.49 | -20.95% |
| 12Stocks.com: Charts, Trends, Fundamental Data and Performances of S&P 500 Stocks | |
|
We now take in-depth look at all S&P 500 stocks including charts, multi-period performances and overall trends (as measured by Smart Investing & Trading Score). One can sort S&P 500 stocks (click link to choose) by Daily, Weekly and by Year-to-Date performances. Also, one can sort by size of the company or by market capitalization. |
| Select Your Default Chart Type: | |||||
| |||||
| Click on stock symbol or name for detailed view. Click on to add stock symbol to your watchlist and to view watchlist. Quick View: Move mouse or cursor over "Daily" to quickly view daily technical stock chart and over "Weekly" to view weekly technical stock chart. | |||||

 | ANET Arista Networks, Inc. |
| Sector: Technology | |
| SubSector: Diversified Computer Systems | |
| MarketCap: 14071.2 Millions | |
| Recent Price: 273.99 Smart Investing & Trading Score: 57 | |
| Day Percent Change: -1.73% Day Change: -4.83 | |
| Week Change: -0.15% Year-to-date Change: 16.3% | |
| ANET Links: Profile News Message Board | |
| Charts:- Daily , Weekly | |
| Add ANET to Watchlist: View: Get ANET Trend Analysis ➞ | |
 | ZBH Zimmer Biomet Holdings, Inc. |
| Sector: Health Care | |
| SubSector: Medical Appliances & Equipment | |
| MarketCap: 19339.4 Millions | |
| Recent Price: 121.43 Smart Investing & Trading Score: 47 | |
| Day Percent Change: 0.72% Day Change: 0.87 | |
| Week Change: -0.19% Year-to-date Change: -0.2% | |
| ZBH Links: Profile News Message Board | |
| Charts:- Daily , Weekly | |
| Add ZBH to Watchlist: View: Get ZBH Trend Analysis ➞ | |
 | NWSA News Corporation |
| Sector: Services & Goods | |
| SubSector: Broadcasting - TV | |
| MarketCap: 5857.53 Millions | |
| Recent Price: 24.42 Smart Investing & Trading Score: 64 | |
| Day Percent Change: -0.57% Day Change: -0.14 | |
| Week Change: -0.2% Year-to-date Change: -0.5% | |
| NWSA Links: Profile News Message Board | |
| Charts:- Daily , Weekly | |
| Add NWSA to Watchlist: View: Get NWSA Trend Analysis ➞ | |
 | TROW T. Rowe Price Group, Inc. |
| Sector: Financials | |
| SubSector: Asset Management | |
| MarketCap: 24530 Millions | |
| Recent Price: 111.25 Smart Investing & Trading Score: 33 | |
| Day Percent Change: -0.68% Day Change: -0.76 | |
| Week Change: -0.22% Year-to-date Change: 3.3% | |
| TROW Links: Profile News Message Board | |
| Charts:- Daily , Weekly | |
| Add TROW to Watchlist: View: Get TROW Trend Analysis ➞ | |
 | HES Hess Corporation |
| Sector: Energy | |
| SubSector: Independent Oil & Gas | |
| MarketCap: 10465.3 Millions | |
| Recent Price: 158.49 Smart Investing & Trading Score: 66 | |
| Day Percent Change: -0.57% Day Change: -0.91 | |
| Week Change: -0.23% Year-to-date Change: 9.9% | |
| HES Links: Profile News Message Board | |
| Charts:- Daily , Weekly | |
| Add HES to Watchlist: View: Get HES Trend Analysis ➞ | |
 | AMT American Tower Corporation (REIT) |
| Sector: Financials | |
| SubSector: REIT - Diversified | |
| MarketCap: 92527 Millions | |
| Recent Price: 181.28 Smart Investing & Trading Score: 57 | |
| Day Percent Change: 1.45% Day Change: 2.59 | |
| Week Change: -0.25% Year-to-date Change: -16.0% | |
| AMT Links: Profile News Message Board | |
| Charts:- Daily , Weekly | |
| Add AMT to Watchlist: View: Get AMT Trend Analysis ➞ | |
 | RHI Robert Half International Inc. |
| Sector: Services & Goods | |
| SubSector: Staffing & Outsourcing Services | |
| MarketCap: 4302 Millions | |
| Recent Price: 69.98 Smart Investing & Trading Score: 49 | |
| Day Percent Change: -0.04% Day Change: -0.03 | |
| Week Change: -0.26% Year-to-date Change: -20.4% | |
| RHI Links: Profile News Message Board | |
| Charts:- Daily , Weekly | |
| Add RHI to Watchlist: View: Get RHI Trend Analysis ➞ | |
 | ADSK Autodesk, Inc. |
| Sector: Technology | |
| SubSector: Technical & System Software | |
| MarketCap: 36975.8 Millions | |
| Recent Price: 214.62 Smart Investing & Trading Score: 35 | |
| Day Percent Change: -0.96% Day Change: -2.08 | |
| Week Change: -0.26% Year-to-date Change: -11.9% | |
| ADSK Links: Profile News Message Board | |
| Charts:- Daily , Weekly | |
| Add ADSK to Watchlist: View: Get ADSK Trend Analysis ➞ | |
 | CVS CVS Health Corporation |
| Sector: Health Care | |
| SubSector: Health Care Plans | |
| MarketCap: 80104.3 Millions | |
| Recent Price: 55.74 Smart Investing & Trading Score: 32 | |
| Day Percent Change: -0.41% Day Change: -0.23 | |
| Week Change: -0.29% Year-to-date Change: -29.4% | |
| CVS Links: Profile News Message Board | |
| Charts:- Daily , Weekly | |
| Add CVS to Watchlist: View: Get CVS Trend Analysis ➞ | |
 | LOW Lowe s Companies, Inc. |
| Sector: Services & Goods | |
| SubSector: Home Improvement Stores | |
| MarketCap: 56084.2 Millions | |
| Recent Price: 231.46 Smart Investing & Trading Score: 40 | |
| Day Percent Change: -0.10% Day Change: -0.24 | |
| Week Change: -0.29% Year-to-date Change: 4.0% | |
| LOW Links: Profile News Message Board | |
| Charts:- Daily , Weekly | |
| Add LOW to Watchlist: View: Get LOW Trend Analysis ➞ | |
 | DGX Quest Diagnostics Incorporated |
| Sector: Health Care | |
| SubSector: Medical Laboratories & Research | |
| MarketCap: 11076.1 Millions | |
| Recent Price: 136.94 Smart Investing & Trading Score: 76 | |
| Day Percent Change: 0.96% Day Change: 1.30 | |
| Week Change: -0.32% Year-to-date Change: -0.7% | |
| DGX Links: Profile News Message Board | |
| Charts:- Daily , Weekly | |
| Add DGX to Watchlist: View: Get DGX Trend Analysis ➞ | |
 | LVS Las Vegas Sands Corp. |
| Sector: Services & Goods | |
| SubSector: Resorts & Casinos | |
| MarketCap: 36431.6 Millions | |
| Recent Price: 46.72 Smart Investing & Trading Score: 57 | |
| Day Percent Change: -0.64% Day Change: -0.30 | |
| Week Change: -0.32% Year-to-date Change: -5.1% | |
| LVS Links: Profile News Message Board | |
| Charts:- Daily , Weekly | |
| Add LVS to Watchlist: View: Get LVS Trend Analysis ➞ | |
 | BEN Franklin Resources, Inc. |
| Sector: Financials | |
| SubSector: Asset Management | |
| MarketCap: 9419.73 Millions | |
| Recent Price: 23.30 Smart Investing & Trading Score: 25 | |
| Day Percent Change: -0.51% Day Change: -0.12 | |
| Week Change: -0.34% Year-to-date Change: -21.8% | |
| BEN Links: Profile News Message Board | |
| Charts:- Daily , Weekly | |
| Add BEN to Watchlist: View: Get BEN Trend Analysis ➞ | |
 | MTD Mettler-Toledo International Inc. |
| Sector: Health Care | |
| SubSector: Medical Instruments & Supplies | |
| MarketCap: 15973.1 Millions | |
| Recent Price: 1247.74 Smart Investing & Trading Score: 58 | |
| Day Percent Change: -0.24% Day Change: -3.06 | |
| Week Change: -0.34% Year-to-date Change: 2.9% | |
| MTD Links: Profile News Message Board | |
| Charts:- Daily , Weekly | |
| Add MTD to Watchlist: View: Get MTD Trend Analysis ➞ | |
 | JNJ Johnson & Johnson |
| Sector: Health Care | |
| SubSector: Drug Manufacturers - Major | |
| MarketCap: 331972 Millions | |
| Recent Price: 148.72 Smart Investing & Trading Score: 37 | |
| Day Percent Change: 0.09% Day Change: 0.14 | |
| Week Change: -0.37% Year-to-date Change: -5.1% | |
| JNJ Links: Profile News Message Board | |
| Charts:- Daily , Weekly | |
| Add JNJ to Watchlist: View: Get JNJ Trend Analysis ➞ | |
 | RMD ResMed Inc. |
| Sector: Health Care | |
| SubSector: Medical Instruments & Supplies | |
| MarketCap: 18660.2 Millions | |
| Recent Price: 216.16 Smart Investing & Trading Score: 68 | |
| Day Percent Change: -0.36% Day Change: -0.78 | |
| Week Change: -0.38% Year-to-date Change: 25.7% | |
| RMD Links: Profile News Message Board | |
| Charts:- Daily , Weekly | |
| Add RMD to Watchlist: View: Get RMD Trend Analysis ➞ | |
 | O Realty Income Corporation |
| Sector: Financials | |
| SubSector: REIT - Retail | |
| MarketCap: 17647.4 Millions | |
| Recent Price: 55.02 Smart Investing & Trading Score: 76 | |
| Day Percent Change: -0.78% Day Change: -0.43 | |
| Week Change: -0.43% Year-to-date Change: -4.2% | |
| O Links: Profile News Message Board | |
| Charts:- Daily , Weekly | |
| Add O to Watchlist: View: Get O Trend Analysis ➞ | |
 | FDX FedEx Corporation |
| Sector: Transports | |
| SubSector: Air Delivery & Freight Services | |
| MarketCap: 33188 Millions | |
| Recent Price: 259.47 Smart Investing & Trading Score: 36 | |
| Day Percent Change: -0.32% Day Change: -0.82 | |
| Week Change: -0.45% Year-to-date Change: 2.6% | |
| FDX Links: Profile News Message Board | |
| Charts:- Daily , Weekly | |
| Add FDX to Watchlist: View: Get FDX Trend Analysis ➞ | |
 | NOW ServiceNow, Inc. |
| Sector: Technology | |
| SubSector: Information Technology Services | |
| MarketCap: 53599.1 Millions | |
| Recent Price: 713.33 Smart Investing & Trading Score: 40 | |
| Day Percent Change: -1.82% Day Change: -13.23 | |
| Week Change: -0.46% Year-to-date Change: 1.0% | |
| NOW Links: Profile News Message Board | |
| Charts:- Daily , Weekly | |
| Add NOW to Watchlist: View: Get NOW Trend Analysis ➞ | |
 | GPN Global Payments Inc. |
| Sector: Services & Goods | |
| SubSector: Business Services | |
| MarketCap: 39068.8 Millions | |
| Recent Price: 110.85 Smart Investing & Trading Score: 18 | |
| Day Percent Change: -0.22% Day Change: -0.24 | |
| Week Change: -0.47% Year-to-date Change: -12.7% | |
| GPN Links: Profile News Message Board | |
| Charts:- Daily , Weekly | |
| Add GPN to Watchlist: View: Get GPN Trend Analysis ➞ | |
 | ALGN Align Technology, Inc. |
| Sector: Health Care | |
| SubSector: Medical Appliances & Equipment | |
| MarketCap: 12802 Millions | |
| Recent Price: 286.52 Smart Investing & Trading Score: 30 | |
| Day Percent Change: -0.30% Day Change: -0.85 | |
| Week Change: -0.47% Year-to-date Change: 4.6% | |
| ALGN Links: Profile News Message Board | |
| Charts:- Daily , Weekly | |
| Add ALGN to Watchlist: View: Get ALGN Trend Analysis ➞ | |
 | CMCSA Comcast Corporation |
| Sector: Services & Goods | |
| SubSector: Entertainment - Diversified | |
| MarketCap: 164849 Millions | |
| Recent Price: 38.49 Smart Investing & Trading Score: 35 | |
| Day Percent Change: 0.00% Day Change: 0.00 | |
| Week Change: -0.52% Year-to-date Change: -12.2% | |
| CMCSA Links: Profile News Message Board | |
| Charts:- Daily , Weekly | |
| Add CMCSA to Watchlist: View: Get CMCSA Trend Analysis ➞ | |
 | HAS Hasbro, Inc. |
| Sector: Consumer Staples | |
| SubSector: Toys & Games | |
| MarketCap: 7389.5 Millions | |
| Recent Price: 61.16 Smart Investing & Trading Score: 66 | |
| Day Percent Change: 0.41% Day Change: 0.25 | |
| Week Change: -0.52% Year-to-date Change: 19.8% | |
| HAS Links: Profile News Message Board | |
| Charts:- Daily , Weekly | |
| Add HAS to Watchlist: View: Get HAS Trend Analysis ➞ | |
 | AAPL Apple Inc. |
| Sector: Technology | |
| SubSector: Electronic Equipment | |
| MarketCap: 1112940 Millions | |
| Recent Price: 182.40 Smart Investing & Trading Score: 100 | |
| Day Percent Change: 0.38% Day Change: 0.69 | |
| Week Change: -0.53% Year-to-date Change: -5.3% | |
| AAPL Links: Profile News Message Board | |
| Charts:- Daily , Weekly | |
| Add AAPL to Watchlist: View: Get AAPL Trend Analysis ➞ | |
 | WHR Whirlpool Corporation |
| Sector: Consumer Staples | |
| SubSector: Appliances | |
| MarketCap: 5015.08 Millions | |
| Recent Price: 95.02 Smart Investing & Trading Score: 18 | |
| Day Percent Change: -0.20% Day Change: -0.19 | |
| Week Change: -0.57% Year-to-date Change: -22.0% | |
| WHR Links: Profile News Message Board | |
| Charts:- Daily , Weekly | |
| Add WHR to Watchlist: View: Get WHR Trend Analysis ➞ | |
| For tabular summary view of above stock list: Summary View ➞ 0 - 25 , 25 - 50 , 50 - 75 , 75 - 100 , 100 - 125 , 125 - 150 , 150 - 175 , 175 - 200 , 200 - 225 , 225 - 250 , 250 - 275 , 275 - 300 , 300 - 325 , 325 - 350 , 350 - 375 , 375 - 400 , 400 - 425 , 425 - 450 , 450 - 475 , 475 - 500 | ||
| Click To Change The Sort Order: By Market Cap or Company Size Performance: Year-to-date, Week and Day | |
| Select Chart Type: | ||
|
Best Stocks Today 12Stocks.com |
© 2024 12Stocks.com Terms & Conditions Privacy Contact Us
All Information Provided Only For Education And Not To Be Used For Investing or Trading. See Terms & Conditions


One More Thing ... Get Best Stocks Delivered Daily!
Never Ever Miss A Move With Our Top Ten Stocks Lists
Find Best Stocks In Any Market - Bull or Bear Market
Take A Peek At Our Top Ten Stocks Lists: Daily, Weekly, Year-to-Date & Top Trends
Find Best Stocks In Any Market - Bull or Bear Market
Take A Peek At Our Top Ten Stocks Lists: Daily, Weekly, Year-to-Date & Top Trends
S&P 500 Stocks With Best Up Trends [0-bearish to 100-bullish]: FMC [100], Flavors[100], Fidelity National[100], Kenvue [100], Paper[100], Insulet [100], Motorola Solutions[100], Verisk Analytics[100], Costco Wholesale[100], Southern [100], Eastman Chemical[100]
Best S&P 500 Stocks Year-to-Date:
NVIDIA [82.86%], Constellation [71.26%], NRG [41.97%], Micron [39.69%], Chipotle Mexican[39.65%], Western Digital[36.51%], Eaton [35.96%], Progressive [35.27%], Eli Lilly[33.43%], Meta Platforms[32.27%], General Electric[32.24%] Best S&P 500 Stocks This Week:
Globe Life[9.81%], Flavors[8.88%], FMC [7.92%], Paper[7.06%], Eli Lilly[5.82%], Insulet [5.65%], Fidelity National[5.08%], Henry Schein[5.05%], Etsy [4.67%], Netflix [4.6%], Kenvue [4.58%] Best S&P 500 Stocks Daily:
FMC [9.46%], Flavors[6.40%], Fidelity National[5.48%], Globe Life[5.34%], Kenvue [5.24%], Paper[5.20%], Insulet [4.47%], Henry Schein[3.90%], Prologis [2.95%], Mosaic [2.89%], Dollar General[2.76%]