
 Login Sign Up


| |||||
 |  | ||||

| 12Stocks.com Market Intelligence |
Best S&P 500 Stocks
|
On this page, you will find the most comprehensive analysis of S&P 500 stocks and ETFs - from latest trends to performances to charts ➞. First, here are the year-to-date (YTD) performances of the most requested S&P 500 stocks at 12Stocks.com (click stock for review):
| NVIDIA 61% | ||
| Caterpillar 21% | ||
| Amazon.com 17% | ||
| Merck 16% | ||
| Walmart 14% | ||
| Google 12% | ||
| JPMorgan Chase 11% | ||
| Chevron 9% | ||
| Goldman Sachs 8% | ||
| Microsoft 7% | ||
| Johnson & Johnson -5% | ||
| McDonald s -7% | ||
| Starbucks -8% | ||
| Apple -14% | ||
| Gilead -17% | ||
| Intel -32% | ||
| Boeing -35% | ||
| Quick: S&P 500 Stocks Lists: Performances & Trends, S&P 500 Stock Charts
Sort S&P 500 stocks: Daily, Weekly, Year-to-Date, Market Cap & Trends. Filter S&P 500 stocks list by sector: Show all, Tech, Finance, Energy, Staples, Retail, Industrial, Materials, Utilities and HealthCare |
| 12Stocks.com S&P 500 Stocks Performances & Trends Daily Report | |||||||||
|
| 
The overall Smart Investing & Trading Score is 51 (0-bearish to 100-bullish) which puts S&P 500 index in short term neutral trend. The Smart Investing & Trading Score from previous trading session is 26 and hence an improvement of trend. | ||||||||
Here are the Smart Investing & Trading Scores of the most requested S&P 500 stocks at 12Stocks.com (click stock name for detailed review):
|


| 12Stocks.com: Top Performing S&P 500 Index Stocks | ||||||||||||||||||||||||||||||||||||||||||||||||
 The top performing S&P 500 Index stocks year to date are
Now, more recently, over last week, the top performing S&P 500 Index stocks on the move are


|
||||||||||||||||||||||||||||||||||||||||||||||||
| 12Stocks.com: Investing in S&P 500 Index with Stocks | |
|
The following table helps investors and traders sort through current performance and trends (as measured by Smart Investing & Trading Score) of various
stocks in the S&P 500 Index. Quick View: Move mouse or cursor over stock symbol (ticker) to view short-term technical chart and over stock name to view long term chart. Click on  to add stock symbol to your watchlist and to add stock symbol to your watchlist and  to view watchlist. Click on any ticker or stock name for detailed market intelligence report for that stock. to view watchlist. Click on any ticker or stock name for detailed market intelligence report for that stock. |
12Stocks.com Performance of Stocks in S&P 500 Index
| Ticker | Stock Name | Watchlist | Category | Recent Price | Smart Investing & Trading Score | Change % | Weekly Change% |
| XOM | Exxon Mobil |   | Energy | 120.56 | 76 | 0.57% | 0.57% |
| OXY | Occidental | | Energy | 67.00 | 61 | 0.56% | 0.56% |
| CTAS | Cintas | | Services & Goods | 665.00 | 51 | 0.56% | 0.56% |
| MRO | Marathon Oil | | Energy | 27.65 | 54 | 0.55% | 0.55% |
| EOG | EOG Resources | | Energy | 133.90 | 73 | 0.55% | 0.55% |
| O | Realty Income | | Financials | 53.33 | 67 | 0.55% | 0.55% |
| VICI | VICI Properties | | Financials | 28.04 | 42 | 0.54% | 0.54% |
| ECL | Ecolab | | Materials | 219.31 | 51 | 0.53% | 0.53% |
| CMG | Chipotle Mexican | | Services & Goods | 2884.25 | 53 | 0.53% | 0.53% |
| OTIS | Otis Worldwide | | Industrials | 96.29 | 68 | 0.53% | 0.53% |
| CB | Chubb | | Financials | 251.50 | 78 | 0.52% | 0.52% |
| AAPL | Apple | | Technology | 165.84 | 17 | 0.51% | 0.51% |
| TXT | Textron | | Industrials | 93.77 | 63 | 0.50% | 0.50% |
| WEC | WEC | | Utilities | 81.97 | 100 | 0.50% | 0.50% |
| MCK | McKesson | | Services & Goods | 527.32 | 58 | 0.47% | 0.47% |
| MSFT | Microsoft | | Technology | 400.96 | 36 | 0.46% | 0.46% |
| FTNT | Fortinet | | Technology | 63.69 | 20 | 0.46% | 0.46% |
| TAP | Molson Coors | | Consumer Staples | 64.52 | 58 | 0.45% | 0.45% |
| AIZ | Assurant | | Financials | 174.60 | 58 | 0.44% | 0.44% |
| XEL | Xcel | | Utilities | 54.96 | 74 | 0.44% | 0.44% |
| BR | Broadridge Financial | | Technology | 194.23 | 25 | 0.44% | 0.44% |
| GPC | Genuine Parts | | Services & Goods | 163.09 | 100 | 0.43% | 0.43% |
| BMY | Bristol-Myers | | Health Care | 49.14 | 62 | 0.43% | 0.43% |
| LOW | Lowe s | | Services & Goods | 231.23 | 58 | 0.43% | 0.43% |
| PSA | Public Storage | | Financials | 261.44 | 25 | 0.41% | 0.41% |
| For chart view version of above stock list: Chart View ➞ 0 - 25 , 25 - 50 , 50 - 75 , 75 - 100 , 100 - 125 , 125 - 150 , 150 - 175 , 175 - 200 , 200 - 225 , 225 - 250 , 250 - 275 , 275 - 300 , 300 - 325 , 325 - 350 , 350 - 375 , 375 - 400 , 400 - 425 , 425 - 450 , 450 - 475 , 475 - 500 | ||
 | Click To Change The Sort Order: By Market Cap or Company Size Performance: Year-to-date, Week and Day |  |
|
Get the most comprehensive stock market coverage daily at 12Stocks.com ➞ Best Stocks Today ➞ Best Stocks Weekly ➞ Best Stocks Year-to-Date ➞ Best Stocks Trends ➞  Best Stocks Today 12Stocks.com Best Nasdaq Stocks ➞ Best S&P 500 Stocks ➞ Best Tech Stocks ➞ Best Biotech Stocks ➞ |
| Detailed Overview of S&P 500 Stocks |
| S&P 500 Technical Overview, Leaders & Laggards, Top S&P 500 ETF Funds & Detailed S&P 500 Stocks List, Charts, Trends & More |
| S&P 500: Technical Analysis, Trends & YTD Performance | |
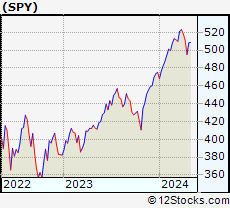
| S&P 500 index as represented by
SPY, an exchange-traded fund [ETF], holds basket of five hundred (mostly largecap) stocks from across all major sectors of the US stock market. The S&P 500 index (contains stocks like Apple and Exxon) is up by 5.14% and is currently outperforming the overall market by 0.75% year-to-date. Below is a quick view of technical charts and trends: | |
 SPY Weekly Chart |
|
| Long Term Trend: Good | |
| Medium Term Trend: Not Good | |
 SPY Daily Chart |
|
| Short Term Trend: Deteriorating | |
| Overall Trend Score: 51 | |
| YTD Performance: 5.14% | |
| **Trend Scores & Views Are Only For Educational Purposes And Not For Investing | |
| 12Stocks.com: Investing in S&P 500 Index using Exchange Traded Funds | |
|
The following table shows list of key exchange traded funds (ETF) that
help investors track S&P 500 index. The following list also includes leveraged ETF funds that track twice or thrice the daily returns of S&P 500 indices. Short or inverse ETF funds move in the opposite direction to the index they track and are useful during market pullbacks or during bear markets. Quick View: Move mouse or cursor over ETF symbol (ticker) to view short-term technical chart and over ETF name to view long term chart. Click on ticker or stock name for detailed view. Click on to add stock symbol to your watchlist and to view watchlist. |
12Stocks.com List of ETFs that track S&P 500 Index
| Ticker | ETF Name | Watchlist | Recent Price | Smart Investing & Trading Score | Change % | Week % | Year-to-date % |
| SPY | SPDR S&P 500 ETF | | 499.72 | 51 | 0.92 | 0.92 | 5.14% |
| IVV | iShares Core S&P 500 ETF | | 498.19 | 36 | 0.13 | 0.13 | 4.3% |
| VOO | Vanguard 500 ETF | | 455.61 | 36 | 0.11 | 0.11 | 4.31% |
| OEF | iShares S&P 100 | | 236.81 | 51 | 0.91 | 0.91 | 6.01% |
| SSO | ProShares Ultra S&P500 | | 70.33 | 51 | 1.77 | 1.77 | 8.08% |
| UPRO | ProShares UltraPro S&P500 | | 60.75 | 43 | 2.69 | 2.69 | 10.98% |
| SPXL | Direxion Daily S&P500 Bull 3X ETF | | 115.45 | 43 | 2.58 | 2.58 | 11.02% |
| SH | ProShares Short S&P500 | | 12.49 | 50 | -0.79 | -0.79 | -3.85% |
| SDS | ProShares UltraShort S&P500 | | 27.41 | 50 | -1.76 | -1.76 | -8.39% |
| SPXU | ProShares UltraPro Short S&P500 | | 37.34 | 50 | -2.58 | -2.58 | -13.16% |
| SPXS | Direxion Daily S&P 500 Bear 3X ETF | | 10.31 | 64 | -0.48 | -0.48 | -10.74% |
| 12Stocks.com: Charts, Trends, Fundamental Data and Performances of S&P 500 Stocks | |
|
We now take in-depth look at all S&P 500 stocks including charts, multi-period performances and overall trends (as measured by Smart Investing & Trading Score). One can sort S&P 500 stocks (click link to choose) by Daily, Weekly and by Year-to-Date performances. Also, one can sort by size of the company or by market capitalization. |
| Select Your Default Chart Type: | |||||
| |||||
| Click on stock symbol or name for detailed view. Click on to add stock symbol to your watchlist and to view watchlist. Quick View: Move mouse or cursor over "Daily" to quickly view daily technical stock chart and over "Weekly" to view weekly technical stock chart. | |||||

 | XOM Exxon Mobil Corporation |
| Sector: Energy | |
| SubSector: Major Integrated Oil & Gas | |
| MarketCap: 156450 Millions | |
| Recent Price: 120.56 Smart Investing & Trading Score: 76 | |
| Day Percent Change: 0.57% Day Change: 0.68 | |
| Week Change: 0.57% Year-to-date Change: 20.6% | |
| XOM Links: Profile News Message Board | |
| Charts:- Daily , Weekly | |
| Add XOM to Watchlist: View: Get XOM Trend Analysis ➞ | |
 | OXY Occidental Petroleum Corporation |
| Sector: Energy | |
| SubSector: Independent Oil & Gas | |
| MarketCap: 9152.73 Millions | |
| Recent Price: 67.00 Smart Investing & Trading Score: 61 | |
| Day Percent Change: 0.56% Day Change: 0.37 | |
| Week Change: 0.56% Year-to-date Change: 12.2% | |
| OXY Links: Profile News Message Board | |
| Charts:- Daily , Weekly | |
| Add OXY to Watchlist: View: Get OXY Trend Analysis ➞ | |
 | CTAS Cintas Corporation |
| Sector: Services & Goods | |
| SubSector: Business Services | |
| MarketCap: 20154.6 Millions | |
| Recent Price: 665.00 Smart Investing & Trading Score: 51 | |
| Day Percent Change: 0.56% Day Change: 3.71 | |
| Week Change: 0.56% Year-to-date Change: 10.3% | |
| CTAS Links: Profile News Message Board | |
| Charts:- Daily , Weekly | |
| Add CTAS to Watchlist: View: Get CTAS Trend Analysis ➞ | |
 | MRO Marathon Oil Corporation |
| Sector: Energy | |
| SubSector: Independent Oil & Gas | |
| MarketCap: 2911.53 Millions | |
| Recent Price: 27.65 Smart Investing & Trading Score: 54 | |
| Day Percent Change: 0.55% Day Change: 0.15 | |
| Week Change: 0.55% Year-to-date Change: 14.5% | |
| MRO Links: Profile News Message Board | |
| Charts:- Daily , Weekly | |
| Add MRO to Watchlist: View: Get MRO Trend Analysis ➞ | |
 | EOG EOG Resources, Inc. |
| Sector: Energy | |
| SubSector: Independent Oil & Gas | |
| MarketCap: 24282.1 Millions | |
| Recent Price: 133.90 Smart Investing & Trading Score: 73 | |
| Day Percent Change: 0.55% Day Change: 0.73 | |
| Week Change: 0.55% Year-to-date Change: 10.7% | |
| EOG Links: Profile News Message Board | |
| Charts:- Daily , Weekly | |
| Add EOG to Watchlist: View: Get EOG Trend Analysis ➞ | |
 | O Realty Income Corporation |
| Sector: Financials | |
| SubSector: REIT - Retail | |
| MarketCap: 17647.4 Millions | |
| Recent Price: 53.33 Smart Investing & Trading Score: 67 | |
| Day Percent Change: 0.55% Day Change: 0.29 | |
| Week Change: 0.55% Year-to-date Change: -7.1% | |
| O Links: Profile News Message Board | |
| Charts:- Daily , Weekly | |
| Add O to Watchlist: View: Get O Trend Analysis ➞ | |
 | VICI VICI Properties Inc. |
| Sector: Financials | |
| SubSector: REIT - Diversified | |
| MarketCap: 7327.03 Millions | |
| Recent Price: 28.04 Smart Investing & Trading Score: 42 | |
| Day Percent Change: 0.54% Day Change: 0.15 | |
| Week Change: 0.54% Year-to-date Change: -12.1% | |
| VICI Links: Profile News Message Board | |
| Charts:- Daily , Weekly | |
| Add VICI to Watchlist: View: Get VICI Trend Analysis ➞ | |
 | ECL Ecolab Inc. |
| Sector: Materials | |
| SubSector: Specialty Chemicals | |
| MarketCap: 46215.9 Millions | |
| Recent Price: 219.31 Smart Investing & Trading Score: 51 | |
| Day Percent Change: 0.53% Day Change: 1.15 | |
| Week Change: 0.53% Year-to-date Change: 10.6% | |
| ECL Links: Profile News Message Board | |
| Charts:- Daily , Weekly | |
| Add ECL to Watchlist: View: Get ECL Trend Analysis ➞ | |
 | CMG Chipotle Mexican Grill, Inc. |
| Sector: Services & Goods | |
| SubSector: Restaurants | |
| MarketCap: 16849.9 Millions | |
| Recent Price: 2884.25 Smart Investing & Trading Score: 53 | |
| Day Percent Change: 0.53% Day Change: 15.14 | |
| Week Change: 0.53% Year-to-date Change: 26.1% | |
| CMG Links: Profile News Message Board | |
| Charts:- Daily , Weekly | |
| Add CMG to Watchlist: View: Get CMG Trend Analysis ➞ | |
 | OTIS Otis Worldwide Corporation |
| Sector: Industrials | |
| SubSector: Specialty Industrial Machinery | |
| MarketCap: 27727 Millions | |
| Recent Price: 96.29 Smart Investing & Trading Score: 68 | |
| Day Percent Change: 0.53% Day Change: 0.51 | |
| Week Change: 0.53% Year-to-date Change: 7.6% | |
| OTIS Links: Profile News Message Board | |
| Charts:- Daily , Weekly | |
| Add OTIS to Watchlist: View: Get OTIS Trend Analysis ➞ | |
 | CB Chubb Limited |
| Sector: Financials | |
| SubSector: Property & Casualty Insurance | |
| MarketCap: 51615.9 Millions | |
| Recent Price: 251.50 Smart Investing & Trading Score: 78 | |
| Day Percent Change: 0.52% Day Change: 1.29 | |
| Week Change: 0.52% Year-to-date Change: 11.3% | |
| CB Links: Profile News Message Board | |
| Charts:- Daily , Weekly | |
| Add CB to Watchlist: View: Get CB Trend Analysis ➞ | |
 | AAPL Apple Inc. |
| Sector: Technology | |
| SubSector: Electronic Equipment | |
| MarketCap: 1112940 Millions | |
| Recent Price: 165.84 Smart Investing & Trading Score: 17 | |
| Day Percent Change: 0.51% Day Change: 0.84 | |
| Week Change: 0.51% Year-to-date Change: -13.9% | |
| AAPL Links: Profile News Message Board | |
| Charts:- Daily , Weekly | |
| Add AAPL to Watchlist: View: Get AAPL Trend Analysis ➞ | |
 | TXT Textron Inc. |
| Sector: Industrials | |
| SubSector: Aerospace/Defense - Major Diversified | |
| MarketCap: 6123.09 Millions | |
| Recent Price: 93.77 Smart Investing & Trading Score: 63 | |
| Day Percent Change: 0.50% Day Change: 0.47 | |
| Week Change: 0.5% Year-to-date Change: 16.6% | |
| TXT Links: Profile News Message Board | |
| Charts:- Daily , Weekly | |
| Add TXT to Watchlist: View: Get TXT Trend Analysis ➞ | |
 | WEC WEC Energy Group, Inc. |
| Sector: Utilities | |
| SubSector: Electric Utilities | |
| MarketCap: 24852 Millions | |
| Recent Price: 81.97 Smart Investing & Trading Score: 100 | |
| Day Percent Change: 0.50% Day Change: 0.41 | |
| Week Change: 0.5% Year-to-date Change: -2.6% | |
| WEC Links: Profile News Message Board | |
| Charts:- Daily , Weekly | |
| Add WEC to Watchlist: View: Get WEC Trend Analysis ➞ | |
 | MCK McKesson Corporation |
| Sector: Services & Goods | |
| SubSector: Drugs Wholesale | |
| MarketCap: 24096.7 Millions | |
| Recent Price: 527.32 Smart Investing & Trading Score: 58 | |
| Day Percent Change: 0.47% Day Change: 2.49 | |
| Week Change: 0.47% Year-to-date Change: 13.9% | |
| MCK Links: Profile News Message Board | |
| Charts:- Daily , Weekly | |
| Add MCK to Watchlist: View: Get MCK Trend Analysis ➞ | |
 | MSFT Microsoft Corporation |
| Sector: Technology | |
| SubSector: Business Software & Services | |
| MarketCap: 1154150 Millions | |
| Recent Price: 400.96 Smart Investing & Trading Score: 36 | |
| Day Percent Change: 0.46% Day Change: 1.84 | |
| Week Change: 0.46% Year-to-date Change: 6.6% | |
| MSFT Links: Profile News Message Board | |
| Charts:- Daily , Weekly | |
| Add MSFT to Watchlist: View: Get MSFT Trend Analysis ➞ | |
 | FTNT Fortinet, Inc. |
| Sector: Technology | |
| SubSector: Application Software | |
| MarketCap: 16993.8 Millions | |
| Recent Price: 63.69 Smart Investing & Trading Score: 20 | |
| Day Percent Change: 0.46% Day Change: 0.29 | |
| Week Change: 0.46% Year-to-date Change: 8.8% | |
| FTNT Links: Profile News Message Board | |
| Charts:- Daily , Weekly | |
| Add FTNT to Watchlist: View: Get FTNT Trend Analysis ➞ | |
 | TAP Molson Coors Beverage Company |
| Sector: Consumer Staples | |
| SubSector: Beverages - Brewers | |
| MarketCap: 8619.97 Millions | |
| Recent Price: 64.52 Smart Investing & Trading Score: 58 | |
| Day Percent Change: 0.45% Day Change: 0.29 | |
| Week Change: 0.45% Year-to-date Change: 5.4% | |
| TAP Links: Profile News Message Board | |
| Charts:- Daily , Weekly | |
| Add TAP to Watchlist: View: Get TAP Trend Analysis ➞ | |
 | AIZ Assurant, Inc. |
| Sector: Financials | |
| SubSector: Accident & Health Insurance | |
| MarketCap: 6110.3 Millions | |
| Recent Price: 174.60 Smart Investing & Trading Score: 58 | |
| Day Percent Change: 0.44% Day Change: 0.77 | |
| Week Change: 0.44% Year-to-date Change: 3.6% | |
| AIZ Links: Profile News Message Board | |
| Charts:- Daily , Weekly | |
| Add AIZ to Watchlist: View: Get AIZ Trend Analysis ➞ | |
 | XEL Xcel Energy Inc. |
| Sector: Utilities | |
| SubSector: Electric Utilities | |
| MarketCap: 28960.8 Millions | |
| Recent Price: 54.96 Smart Investing & Trading Score: 74 | |
| Day Percent Change: 0.44% Day Change: 0.24 | |
| Week Change: 0.44% Year-to-date Change: -11.2% | |
| XEL Links: Profile News Message Board | |
| Charts:- Daily , Weekly | |
| Add XEL to Watchlist: View: Get XEL Trend Analysis ➞ | |
 | BR Broadridge Financial Solutions, Inc. |
| Sector: Technology | |
| SubSector: Information Technology Services | |
| MarketCap: 10633.8 Millions | |
| Recent Price: 194.23 Smart Investing & Trading Score: 25 | |
| Day Percent Change: 0.44% Day Change: 0.85 | |
| Week Change: 0.44% Year-to-date Change: -5.6% | |
| BR Links: Profile News Message Board | |
| Charts:- Daily , Weekly | |
| Add BR to Watchlist: View: Get BR Trend Analysis ➞ | |
 | GPC Genuine Parts Company |
| Sector: Services & Goods | |
| SubSector: Auto Parts Stores | |
| MarketCap: 8605.9 Millions | |
| Recent Price: 163.09 Smart Investing & Trading Score: 100 | |
| Day Percent Change: 0.43% Day Change: 0.70 | |
| Week Change: 0.43% Year-to-date Change: 17.8% | |
| GPC Links: Profile News Message Board | |
| Charts:- Daily , Weekly | |
| Add GPC to Watchlist: View: Get GPC Trend Analysis ➞ | |
 | BMY Bristol-Myers Squibb Company |
| Sector: Health Care | |
| SubSector: Drug Manufacturers - Major | |
| MarketCap: 117052 Millions | |
| Recent Price: 49.14 Smart Investing & Trading Score: 62 | |
| Day Percent Change: 0.43% Day Change: 0.21 | |
| Week Change: 0.43% Year-to-date Change: -4.2% | |
| BMY Links: Profile News Message Board | |
| Charts:- Daily , Weekly | |
| Add BMY to Watchlist: View: Get BMY Trend Analysis ➞ | |
 | LOW Lowe s Companies, Inc. |
| Sector: Services & Goods | |
| SubSector: Home Improvement Stores | |
| MarketCap: 56084.2 Millions | |
| Recent Price: 231.23 Smart Investing & Trading Score: 58 | |
| Day Percent Change: 0.43% Day Change: 0.99 | |
| Week Change: 0.43% Year-to-date Change: 3.9% | |
| LOW Links: Profile News Message Board | |
| Charts:- Daily , Weekly | |
| Add LOW to Watchlist: View: Get LOW Trend Analysis ➞ | |
 | PSA Public Storage |
| Sector: Financials | |
| SubSector: REIT - Industrial | |
| MarketCap: 32733.9 Millions | |
| Recent Price: 261.44 Smart Investing & Trading Score: 25 | |
| Day Percent Change: 0.41% Day Change: 1.06 | |
| Week Change: 0.41% Year-to-date Change: -14.3% | |
| PSA Links: Profile News Message Board | |
| Charts:- Daily , Weekly | |
| Add PSA to Watchlist: View: Get PSA Trend Analysis ➞ | |
| For tabular summary view of above stock list: Summary View ➞ 0 - 25 , 25 - 50 , 50 - 75 , 75 - 100 , 100 - 125 , 125 - 150 , 150 - 175 , 175 - 200 , 200 - 225 , 225 - 250 , 250 - 275 , 275 - 300 , 300 - 325 , 325 - 350 , 350 - 375 , 375 - 400 , 400 - 425 , 425 - 450 , 450 - 475 , 475 - 500 | ||
| Click To Change The Sort Order: By Market Cap or Company Size Performance: Year-to-date, Week and Day | |
| Select Chart Type: | ||
|
Best Stocks Today 12Stocks.com |
© 2024 12Stocks.com Terms & Conditions Privacy Contact Us
All Information Provided Only For Education And Not To Be Used For Investing or Trading. See Terms & Conditions


One More Thing ... Get Best Stocks Delivered Daily!
Never Ever Miss A Move With Our Top Ten Stocks Lists
Find Best Stocks In Any Market - Bull or Bear Market
Take A Peek At Our Top Ten Stocks Lists: Daily, Weekly, Year-to-Date & Top Trends
Find Best Stocks In Any Market - Bull or Bear Market
Take A Peek At Our Top Ten Stocks Lists: Daily, Weekly, Year-to-Date & Top Trends
S&P 500 Stocks With Best Up Trends [0-bearish to 100-bullish]: United Airlines[100], EQT [100], Goldman Sachs[100], Capital One[100], Campbell Soup[100], Northrop Grumman[100], UDR [100], Kimberly-Clark [100], M&T Bank[100], Dominion [100], Church & Dwight Co[100]
Best S&P 500 Stocks Year-to-Date:
NVIDIA [60.57%], Constellation [56.45%], NRG [36.15%], Meta Platforms[36.08%], Progressive [33.73%], Marathon [33.63%], Targa Resources[31.01%], United Airlines[30.73%], Diamondback [30.63%], Western Digital[28.03%], Eaton [27.93%] Best S&P 500 Stocks This Week:
Ford Motor[6.1%], United Airlines[4.98%], NVIDIA [4.35%], Enphase [3.78%], DaVita [3.68%], EQT [3.6%], Zions Ban[3.51%], Truist Financial[3.42%], Goldman Sachs[3.3%], Seagate [3.3%], Blackstone [3.12%] Best S&P 500 Stocks Daily:
Ford Motor[6.10%], United Airlines[4.98%], NVIDIA [4.35%], Enphase [3.78%], DaVita [3.68%], EQT [3.60%], Zions Ban[3.51%], Truist Financial[3.42%], Goldman Sachs[3.30%], Seagate [3.30%], Blackstone [3.12%]